我是靠谱客的博主 落后大门,这篇文章主要介绍高德地图 Web JS API示例学习笔记(6)——图层(图层通用接口、高德官方图层、简易行政区图)图层通用接口图层透明度高德官方图层简易行政区图,现在分享给大家,希望可以做个参考。
文章目录
- 图层通用接口
- 图层添加与移除
- 层级设定
- 图层透明度
- 高德官方图层
- 默认标准图层
- 实时路况图层
- 卫星图
- 楼块图层
- 简易行政区图
- 简易行政区图-中国
- 简易行政区图-省区
- 点击高亮
图层通用接口
图层添加与移除
操作图层进行添加 setMap(map)、移除 setMap(null) 操作。
var satellite = new AMap.TileLayer.Satellite({
	map: map,
});

//绑定按钮事件
function addLayer() {
    satellite.setMap(map);
}

function rmLayer() {
    satellite.setMap(null);
}

function showLayer() {
    satellite.show();
}

function hideLayer() {
    satellite.hide();
}
层级设定
通过 setzIndex() 方法设置图层的层级,调整多个图层的显示层级。
var satellite = new AMap.TileLayer.Satellite({
	map: map,
    zIndex: 12,
    opacity: 0.8
});
satellite.setzIndex(16);
图层透明度
对图层进行透明度调节。setOpacity(value)。
var satellite = new AMap.TileLayer.Satellite({
	map: map,
    opacity: opacity
});
satellite.setOpacity(0.6);
高德官方图层
默认标准图层
当地图只想显示默认图层的时候,layers属性可以缺省,反之,在必要时,可以通过AMap.TileLayer()实例加载默认图层。
var map = new AMap.Map('container', {
	center: [116.397428, 39.90923],
    layers: [//只显示默认图层的时候,layers可以缺省
        new AMap.TileLayer()//高德默认标准图层
    ],
    zoom: 13
});
实时路况图层
使用TileLayer.Traffic在地图上添加实时交通图,适用于显示实时交通的场景。若只想显示单条路线的实时路况,可以使用“路线规划”API,此外,其他地图API(如Openlayers)可通过高德的Web服务API获取实时路况的json数据,自由渲染。
//实时路况图层
    var trafficLayer = new AMap.TileLayer.Traffic({
        zIndex: 10
    });
    trafficLayer.setMap(map);
卫星图
使用TileLayer.Satellite添加卫星图到地图上。
var map = new AMap.Map('container', {
        center: [116.397428, 39.90923],
        layers: [new AMap.TileLayer.Satellite()],
        zoom: 13
    });
楼块图层

本例展示使用AMap.Buildings类型添加独立的楼块图层,楼块图层同样接收自定义样式,支持IE9以上浏览器。
var map = new AMap.Map('container', {
      center: [116.397428, 39.90923],
      viewMode: '3D',
      pitch: 60,
      rotation: -35,
      // 隐藏默认楼块
      // features: ['bg', 'road', 'point'],
      mapStyle: 'amap://styles/light',
      layers: [
        // 高德默认标准图层
        new AMap.TileLayer.Satellite(),
        // 楼块图层
        new AMap.Buildings({
          // 通过zooms控制图层的显示层级
          zooms: [16, 18],
          zIndex: 10,
          heightFactor: 2 //2倍于默认高度,3D下有效
        })
      ],
      zoom: 16
    });
此处通过zomms数组控制图层显示的层级。
简易行政区图
简易行政区图-中国
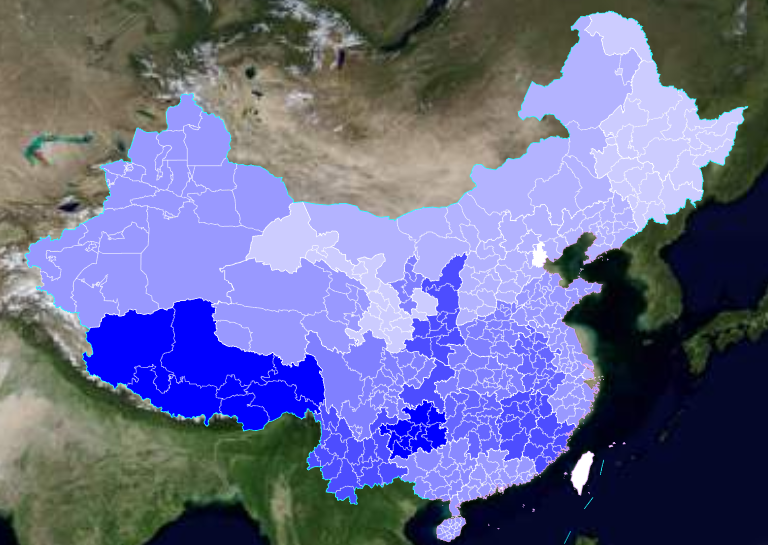
- 简易行政区图国家图可用来展示任意国家和地区的的省分界线及区块,并支持颜色配置,可用于满足可视化数据展示。
- 高德地图api的layers中的图层加载没有先后顺序,顺序颠倒不影响数据的正常显示
var disCountry = new AMap.DistrictLayer.Country({
 zIndex: 10,
 // SOC国家代码、名称、Bounds对照表可参考如下链接
 // https://a.amap.com/jsapi_demos/static/demo-center/js/soc-list.json
 SOC: 'CHN',
 // depth字段设定数据的层级深度,depth为0的时候只显示国家面,depth为1的时候显示省级,当国家为中国时设置depth为2的可以显示市一级
 depth: 2,
 styles: {
   // 国境线
   'nation-stroke': '#22ffff',
   // 海岸线
   'coastline-stroke': [0.85, 0.63, 0.94, 1],
   // 省界
   'province-stroke': 'white',
   // 市界
   'city-stroke': 'rgba(255,255,255,0.5)', //中国特有字段
   // 填充
   'fill': function (props) { //中国特有字段
     return getColorByDGP(props.adcode_pro)
   }
 }
})
var map = new AMap.Map("container",{
   zooms: [3, 10],
   showIndoorMap:false,
   zoom: 3,
   isHotspot:false,
   defaultCursor:'pointer',
   touchZoomCenter:1,
   pitch: 0,
   layers:[
       disCountry,
       new AMap.TileLayer.Satellite()
   ],
   viewMode:'3D',
   resizeEnable: true
})
简易行政区图-省区
简易行政区图省市区图层可用来展示任意省、市、区县的界线及区块,并支持颜色配置,可用于满足可视化数据展示。
// 创建省份图层
    var disProvince;
    // code为行政区代码
    // dep为显示行政区的深度,2表示显示当前层级的下2级
    // 如当前为省级,2表示显示县/区
    function initPro(code, dep) {
      dep = typeof dep == 'undefined' ? 2 : dep;
      adCode = code;
      depth = dep;

      disProvince && disProvince.setMap(null);

      disProvince = new AMap.DistrictLayer.Province({
        zIndex: 12,
        adcode: [code],
        depth: dep,
        styles: {
          'fill': function (properties) {
            // properties为可用于做样式映射的字段,包含
            // NAME_CHN:中文名称
            // adcode_pro
            // adcode_cit
            // adcode
            var adcode = properties.adcode;
            // 根据属性值赋颜色
            return getColorByAdcode(adcode);
          },
          'province-stroke': 'cornflowerblue',
          'city-stroke': 'white', // 中国地级市边界
          'county-stroke': 'rgba(255,255,255,0.5)' // 中国区县边界
        }
      });
      // 将省级数据添加到map中
      disProvince.setMap(map);
    }
点击高亮
- 通过 getDistrictByContainerPos() 方法拾取所在位置的行政区。
- 通过 setStyles() 重置行政区样式。
   var nationStroke = 'rgba(20, 20, 120, 0.6)';
    var nationFill = 'rgba(20, 120, 230, 0.3)';

    // 绘制世界地图国家轮廓
    var disWorld = new AMap.DistrictLayer.World({
      zIndex: 10,
      styles: {
        // 颜色格式: #RRGGBB、rgba()、rgb()、[r, g, b, a]
        // 国境线
        //'nation-stroke': nationStroke,
        // 海岸线
        //'coastline-stroke': '',
        // 填充
        'fill': function (props) {
          if (props.SOC == 'CHN') {
            updateInfo(props);
            return nationFill;
          } else {
            return 'white'
          }
        }
      }
    });

    var map = new AMap.Map('container', {
      zooms: [3, 18],
      center: [110, 30],
      showIndoorMap: false,
      zoom: 3,
      isHotspot: false,
      defaultCursor: 'pointer',
      touchZoomCenter: 1,
      pitch: 0,
      layers: [
        disWorld
      ],
      viewMode: '3D',
      resizeEnable: true
    });

    map.on('click', function (ev) {
      var px = ev.pixel;
      // 拾取所在位置的行政区
      var props = disWorld.getDistrictByContainerPos(px);

      if (props) {
        var SOC = props.SOC;
        if (SOC) {
          // 重置行政区样式
          disWorld.setStyles({
            // 国境线
            //nation-stroke': nationStroke,
            // 海岸线
            //'coastline-stroke': '',
            'fill': function (props) {
              return props.SOC == SOC ? nationFill : 'white';
            }
          });
          updateInfo(props);
        }
      }
    });

    function updateInfo(props) {
      document.getElementById('name').innerText = props.NAME_CHN;
      document.getElementById('eng-name').innerText = props.NAME_ENG;
      document.getElementById('soc').innerText = props.SOC;
    }
最后
以上就是落后大门最近收集整理的关于高德地图 Web JS API示例学习笔记(6)——图层(图层通用接口、高德官方图层、简易行政区图)图层通用接口图层透明度高德官方图层简易行政区图的全部内容,更多相关高德地图内容请搜索靠谱客的其他文章。
本图文内容来源于网友提供,作为学习参考使用,或来自网络收集整理,版权属于原作者所有。


发表评论 取消回复