
点击关注,桓峰基因
桓峰基因公众号推出机器学习应用于临床预测的方法,跟着教程轻松学习,每个文本教程配有视频教程大家都可以自由免费学习,目前已有的机器学习教程整理出来如下:
MachineLearning 1. 主成分分析(PCA)
MachineLearning 2. 因子分析(Factor Analysis)
MachineLearning 3. 聚类分析(Cluster Analysis)
MachineLearning 4. 癌症诊断方法之 K-邻近算法(KNN)
MachineLearning 5. 癌症诊断和分子分型方法之支持向量机(SVM)
MachineLearning 6. 癌症诊断机器学习之分类树(Classification Trees)
MachineLearning 7. 癌症诊断机器学习之回归树(Regression Trees)
MachineLearning 8. 癌症诊断机器学习之随机森林(Random Forest)
MachineLearning 9. 癌症诊断机器学习之梯度提升算法(Gradient Boosting)
MachineLearning 10. 癌症诊断_机器学习_之神经网络(Neural network)
MachineLearning 11. 机器学习之随机森林生存分析(randomForestSRC)
MachineLearning 12. 机器学习之降维方法t-SNE及可视化(Rtsne)
MachineLearning 13. 机器学习之降维方法UMAP及可视化 (umap)
这期介绍一下NB的最佳降维方法之一 UMAP,并实现在多个数据集上的应用,尤其是单细胞测序数据。
前言
UMAP(Uniform Manifold Approximation and Projection)是一种非线性降维的算法,相对于t-SNE,UMAP算法更加快速 该方法的原理是利用流形学和投影技术,达到降维目的 首先计算高维空间中的点之间的距离,将它们投影到低维空间,并计算该低维空间中的点之间的距离。然后,它使用随机梯度下降来最小化这些距离之间的差异。

软件安装
设置清华镜像,加快包的安装如下:
options("repos" = c(CRAN="https://mirrors.tuna.tsinghua.edu.cn/CRAN/"))
if(!require(umap))
  install.packages("umap")
if(!require(uwot))
  install.packages("uwot")
数据读取
这里我们准备了三个数据集,一个是例子中给出来的,一个是乳腺癌患者活检数据集,另一个是单细胞转录组的数据集。
1. 埃德加·安德森的iris数据
Description This famous (Fisher’s or Anderson’s) iris data set gives the measurements in centimeters of the variables sepal length and width and petal length and width, respectively, for 50 flowers from each of 3 species of iris. The species are Iris setosa, versicolor, and virginica. Usage iris Format iris is a data frame with 150 cases (rows) and 5 variables (columns) named Sepal.Length, Sepal.Width, Petal.Length, Petal.Width, and Species.
library(umap)
library(uwot)
data("iris")
iris.data <- iris[, grep("Sepal|Petal", colnames(iris))]
iris.labels <- iris[, "Species"]
2. 乳腺癌患者活检数据
我们已经多次使用过这个数据集了,class是二分类的结果变量恶性还是良性的。
Description This breast cancer database was obtained from the University of Wisconsin Hospitals, Madison from Dr. William H. Wolberg. He assessed biopsies of breast tumours for 699 patients up to 15 July 1992; each of nine attributes has been scored on a scale of 1 to 10, and the outcome is also known. There are 699 rows and 11 columns. Usage biopsy Format This data frame contains the following columns: ID sample code number (not unique). V1 clump thickness. V2 uniformity of cell size. V3 uniformity of cell shape. V4 marginal adhesion. V5 single epithelial cell size. V6 bare nuclei (16 values are missing). V7 bland chromatin. V8 normal nucleoli. V9 mitoses. class “benign” or “malignant”.
library(MASS)
data("biopsy")
head(biopsy)
##        ID V1 V2 V3 V4 V5 V6 V7 V8 V9     class
## 1 1000025  5  1  1  1  2  1  3  1  1    benign
## 2 1002945  5  4  4  5  7 10  3  2  1    benign
## 3 1015425  3  1  1  1  2  2  3  1  1    benign
## 4 1016277  6  8  8  1  3  4  3  7  1    benign
## 5 1017023  4  1  1  3  2  1  3  1  1    benign
## 6 1017122  8 10 10  8  7 10  9  7  1 malignant
data <- unique(na.omit(biopsy[, -1]))
head(data)
##   V1 V2 V3 V4 V5 V6 V7 V8 V9     class
## 1  5  1  1  1  2  1  3  1  1    benign
## 2  5  4  4  5  7 10  3  2  1    benign
## 3  3  1  1  1  2  2  3  1  1    benign
## 4  6  8  8  1  3  4  3  7  1    benign
## 5  4  1  1  3  2  1  3  1  1    benign
## 6  8 10 10  8  7 10  9  7  1 malignant
3. 单细胞转录组数据集
单细胞数据我们可以从scatter这个软件包获取,但是目前失效了,我到github上下载了一下,同样可以使用:
load("sc_example_counts.RData")
load("sc_example_cell_info.RData")
head(sc_example_cell_info)
##              Cell Mutation_Status Cell_Cycle Treatment
## Cell_001 Cell_001        positive          S    treat1
## Cell_002 Cell_002        positive         G0    treat1
## Cell_003 Cell_003        negative         G1    treat1
## Cell_004 Cell_004        negative          S    treat1
## Cell_005 Cell_005        negative         G1    treat2
## Cell_006 Cell_006        negative         G0    treat1
sc_example_counts = unique(sc_example_counts)
sc_example_counts[1:5, 1:5]
##           Cell_001 Cell_002 Cell_003 Cell_004 Cell_005
## Gene_0001        0      123        2        0        0
## Gene_0002      575       65        3     1561     2311
## Gene_0003        0        0        0        0     1213
## Gene_0004        0        1        0        0        0
## Gene_0005        0        0       11        0        0
参数说明
umap函数主要的就是method参数,有两个:naïve纯R语言编写;umap-learn需要调用python包。
Computes a manifold approximation and projection Description Computes a manifold approximation and projection Usage umap( d, config = umap.defaults, method = c(“naive”, “umap-learn”), preserve.seed = TRUE, … )
我们看下umap.defaults,这就是模型的配置函数了。它有一个默认的配置列表:
umap.defaults
## umap configuration parameters
##            n_neighbors: 15
##           n_components: 2
##                 metric: euclidean
##               n_epochs: 200
##                  input: data
##                   init: spectral
##               min_dist: 0.1
##       set_op_mix_ratio: 1
##     local_connectivity: 1
##              bandwidth: 1
##                  alpha: 1
##                  gamma: 1
##   negative_sample_rate: 5
##                      a: NA
##                      b: NA
##                 spread: 1
##           random_state: NA
##        transform_state: NA
##                    knn: NA
##            knn_repeats: 1
##                verbose: FALSE


##        umap_learn_args: NA
其中参数的意义:
n_neighbors:确定相邻点的数量,通常其设置在2-100之间。
n_components:降维的维数大小,默认是2,其范围最好也在2-100之间。
Metric:距离的计算方法,有很多可以选择,具体的需要我们在应用的时候自行筛选。如:euclidean,manhattan,chebyshev,minkowski,canberra,braycurtis,mahalanobis,wminkowski,seuclidean,cosine,correlation,haversine,hamming,jaccard,dice,russelrao,kulsinski,rogerstanimoto,sokalmichener,sokalsneath,yule。这个地方需要注意的是如果需要传参的算法,可以利用metric_kwds设置(此值python有)。
n_epochs:模型训练迭代次数。数据量大时200,小时500。
input:数据的类型,如果是data就会按照数据进行计算;如果dist就会认为是距离矩阵进行训练。
init:初始化用的。其中有这么三种方式:spectral,random,自定义。
min_dist:控制允许嵌入的紧密程度,值越小点越聚集,默认一般是0.1。
set_op_mix_ratio:设置降维过程中,各特征的结合方式,值0-1。0代表取交集,1代表取合集;中间就是比例。
local_connectivity:局部连接的点之间值,默认1,其值越大局部连接越多,导致的结果就是超越固有的流形维数出现改变。
bandwith:用于构造子集参数,具体怎么设,就默认吧。
alpha:相当于在python中的leanging_rate(学习率)参数。
gamma:布局最优的学习率
negative_sample_rate:每一个阳性样本导致的阴性率。其值越大导致高的优化也就是过拟合,预测准确度下降。默认是5.
a,b主要是关联min_dist 和 spread。可以不用设置。
spread:有效的嵌入式降维范围。与min_dist联合使用。
random_state:此值主要是确保模型的可重复性。如果不设置基于np.random,每次将会不同。
transform_seed:此值用于数值转换操作。一般默认42。
verbose:控制工作日志,防止存储过多。
umap_learn_args:这个参数就牛了,他可以调用python基于umap-learn训练好的参数。
custom.settings = umap.defaults
custom.settings$n_neighbors = 5
custom.settings
例子实操
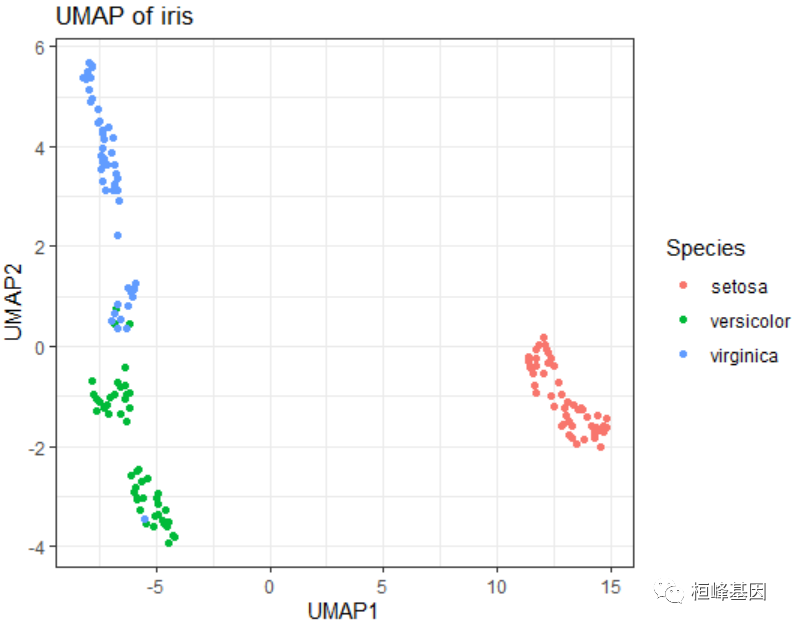
1. iris数据集的降维
读入矩阵,构造模型,给出结果:
library(umap)
# Set a seed if you want reproducible results
iris.umap <- umap(iris.data)
iris.umap
# head(iris.umap$layout, 3)
res <- as.data.frame(iris.umap$layout)
res$Species = iris[, "Species"]
head(res)
library(ggplot2)
p1 <- ggplot(res, aes(x = V1, y = V2, color = Species)) + geom_point(size = 1.25) +
    labs(title = "UMAP of iris", x = "UMAP1", y = "UMAP2") + theme(plot.title = element_text(hjust = 0.5)) +
    theme_bw()
p1
预测
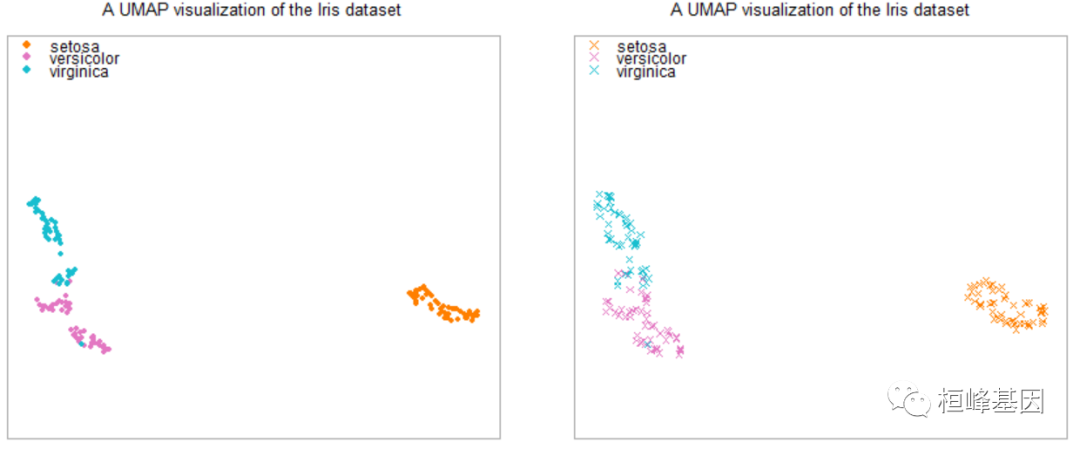
最后就是预测,其实并没有什么预测功能,主要就是用来降维,那既然提供了,那我们就简单提下是怎么实现的。其实就是基于前面计算的参数,将新的数据与原始数据合并,然后计算出新的降维结果,看是否可以和原模型一样。
par(mfrow = c(1, 2))
iris.wnoise <- iris.data + matrix(rnorm(150 * 40, 0, 0.1), ncol = 4)
colnames(iris.wnoise) <- colnames(iris.data)
head(iris.wnoise, 3)
iris.wnoise.umap <- predict(iris.umap, iris.wnoise)
head(iris.wnoise.umap, 3)
plot.iris(iris.umap, iris.labels)
plot.iris(iris.wnoise.umap, iris.labels, add = F, pch = 4, legend.suffix = " (with noise)")
2. biopsy数据集的降维
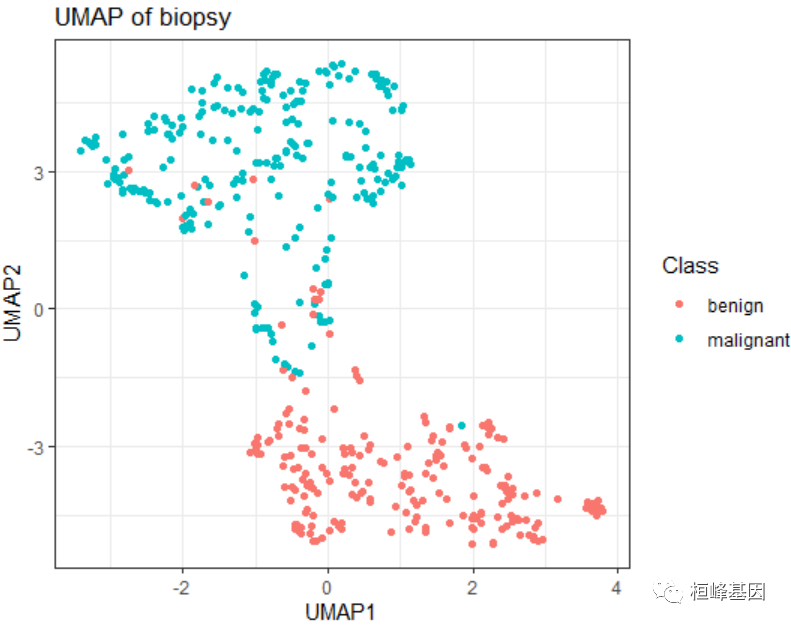
读入矩阵,构造模型,给出结果:
biopsy.umap <- umap(as.matrix(data[, 1:9]))
res <- as.data.frame(biopsy.umap$layout)
res$Class = data$class
p2 <- ggplot(res, aes(x = V1, y = V2, color = Class)) + geom_point(size = 1.25) +
    labs(title = "UMAP of biopsy", x = "UMAP1", y = "UMAP2") + theme(plot.title = element_text(hjust = 0.5)) +
    theme_bw()
p2
4. 单细胞转录组数据集降维
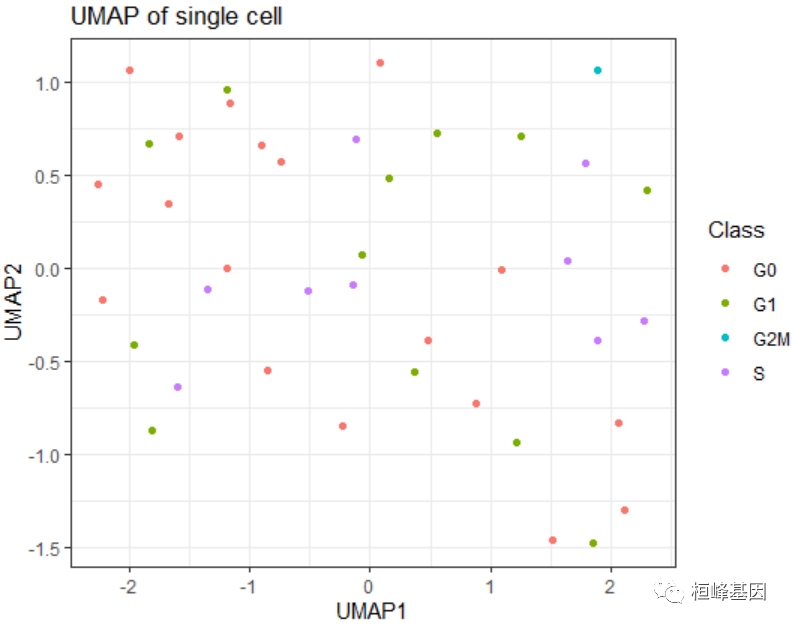
sc.umap <- umap(as.matrix(t(sc_example_counts)))
res <- as.data.frame(sc.umap$layout)
res$Class = sc_example_cell_info[sc_example_cell_info$Cell %in% colnames(sc_example_counts),
    ]$Cell_Cycle
length(unique(res$Class))
head(res)
p3 <- ggplot(res, aes(x = V1, y = V2, color = Class)) + geom_point(size = 1.25) +
    labs(title = "UMAP of single cell", x = "UMAP1", y = "UMAP2") + theme(plot.title = element_text(hjust = 0.5)) +
    theme_bw()
p3
合并三个数据集降维结果
library(patchwork)
p1 | p2 | p3

我这里都给大家分析三个数据集的,方便大家选择适合自己的数据方法,另外需要代码的将这期教程转发朋友圈,并配文“学生信,找桓峰基因,铸造成功的你!”即可获得!
桓峰基因,铸造成功的您!
有想进生信交流群的老师可以扫最后一个二维码加微信,备注“单位+姓名+目的”,有些想发广告的就免打扰吧,还得费力气把你踢出去!
References:
- Leland McInnes, John Healy, et al. UMAP: Uniform Manifold Approximation and Projection for Dimension Reduction. Machine Learning (stat.ML).2018

最后
以上就是俊逸白开水最近收集整理的关于MachineLearning 13. 机器学习之降维方法UMAP及可视化 (umap)的全部内容,更多相关MachineLearning内容请搜索靠谱客的其他文章。


发表评论 取消回复