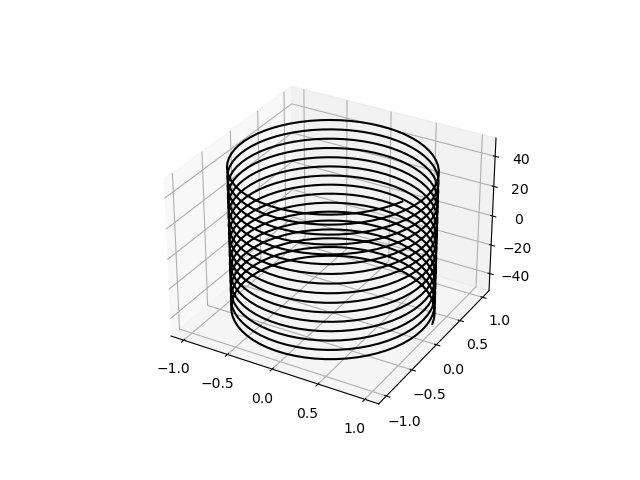
已知螺旋线的参数方程
{
x
=
cos
t
y
=
sin
t
z
=
t
left{begin{array}{l} x=cos t\ y=sin t \ z=t end{array}right.
⎩⎨⎧x=costy=sintz=t
import matplotlib.pyplot as plt
import numpy as np

ax = plt.axes(projection='3d')  # 设置三维图形模式
z = np.arange(-50, 50, 0.1)	 # z坐标范围-50~50
x = np.cos(z)
y = np.sin(z)
ax.plot3D(x, y, z, 'k')
plt.show()
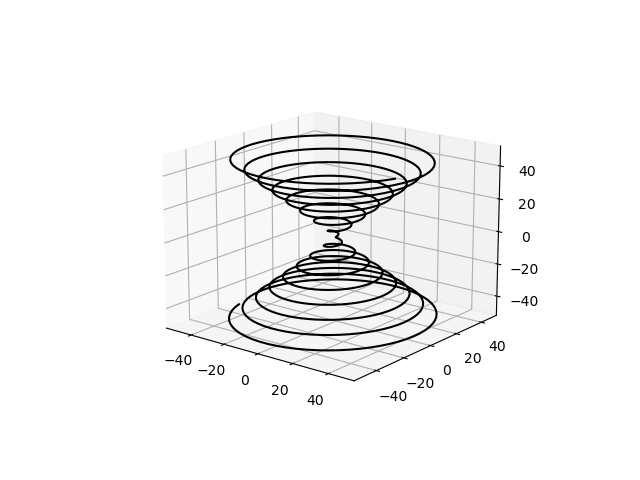
已知螺旋线的参数方程
{
x
=
t
cos
t
y
=
t
sin
t
z
=
t
left{begin{array}{l} x=tcos t\ y=tsin t \ z=t end{array}right.
⎩⎨⎧x=tcosty=tsintz=t
import matplotlib.pyplot as plt
import numpy as np

ax = plt.axes(projection='3d')  # 设置三维图形模式
z = np.arange(-50, 50, 0.1)
x = z * np.cos(z)
y = z * np.sin(z)
ax.plot3D(x, y, z, 'k')
plt.show()
最后
以上就是乐观毛巾最近收集整理的关于Python在已知参数方程情况下绘制三维曲线的全部内容,更多相关Python在已知参数方程情况下绘制三维曲线内容请搜索靠谱客的其他文章。


发表评论 取消回复