一、MATLAB画三维图
1、很多矩形叠加:mesh(X, Y, Z);其中X,Y坐标要先定义好。
for iter = 1: 10
x = 1:1:512; y = x;
[X, Y] = meshgrid(x, y);
mesh(X, Y, iter * ones(size(X)));
hold on
end
hold off
2、plot3 只能画曲线图,只能是写成参数函数形式的曲线方程才能用它画出来
t = (0:0.2:2) * pi;
x = sin(t); y = cos(t); z = x^2 + y^2;
plot(x, y, z);%三个向量或者矩阵一定要同维
3、在同一窗口中画多个图
绘制二维图的一般步骤
subplot(2,1,1);分割为2*1的子图,指定1号子图
imgshow
4、一个全面的例子展示了画图函数
Matlab的使用:如何画不同类型的三维图像
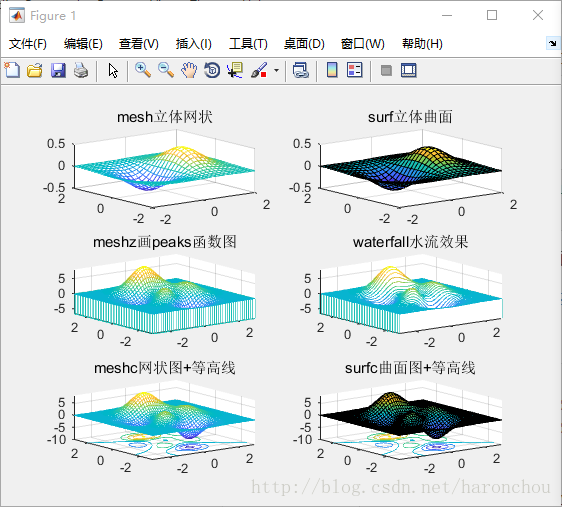 


%part1: mesh画立体网状图
x=linspace(-2, 2, 25); % 在x轴上取25点
y=linspace(-2, 2, 25); % 在y轴上取25点
[xx,yy]=meshgrid(x, y); % xx和yy都是21x21的矩阵
zz=xx.*exp(-xx.^2-yy.^2); % 计算函数值,zz也是21x21的矩阵
subplot(321);mesh(xx, yy, zz); % mesh画出立体网状图
title('mesh立体网状')
%part2:surf画立体曲面图
%figure(2);
subplot(322);surf(xx, yy, zz); title('surf立体曲面')% 画出立体曲面图
%为了方便测试立体绘图,MATLAB提供了一个peaks函数,
%可产生一个凹凸有致的曲面,包含了三个局部极大点及三个局部极小点,
%其方程式为:要画出此函数的最快方法即是直接键入peaks:
[x,y,z]=peaks;
%figure(3);
subplot(323);meshz(x,y,z);title('meshz画peaks函数图')%meshz可以将曲面加上围裙
axis([-inf inf -inf inf -inf inf]);
% waterfall可在x方向或y方向产生水流效果:
%figure(4);
subplot(324);waterfall(x,y,z);title('waterfall水流效果')
axis([-inf inf -inf inf -inf inf]);
%meshc同时画出网状图与等高线
subplot(325);meshc(x,y,z);title('meshc网状图+等高线')
axis([-inf inf -inf inf -inf inf]);
%surfc同时画出曲面图与等高线
subplot(326);surfc(x,y,z);title('surfc曲面图+等高线')
axis([-inf inf -inf inf -inf inf]);
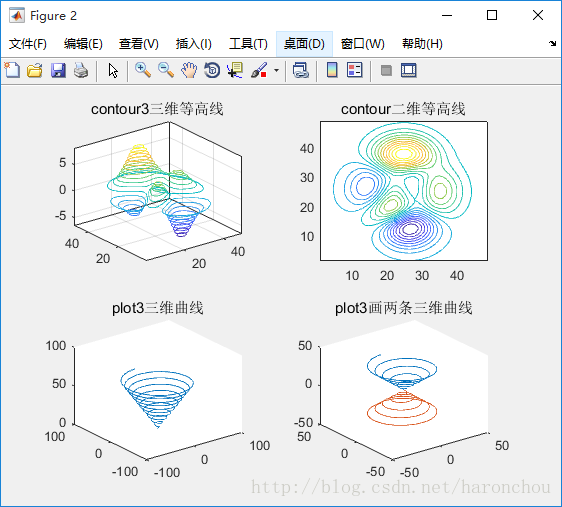
%contour3画出曲面在三维空间中的等高线
figure;
subplot(221);contour3(peaks, 20);title('contour3三维等高线')
axis([-inf inf -inf inf -inf inf]);
%contour画出曲面等高线在XY平面的投影
subplot(222);contour(peaks,20);title('contour二维等高线')
%plot3可画出三维空间中的曲线:
t=linspace(0,20*pi, 501);
subplot(223);plot3(t.*sin(t), t.*cos(t), t);title('plot3三维曲线')
%亦可同时画出两条三度空间中的曲线:
t=linspace(0, 10*pi, 501);
subplot(224);plot3(t.*sin(t), t.*cos(t), t, t.*sin(t), t.*cos(t), -t);title('plot3画两条三维曲线')绘制三维图的一般步骤
二、图像基本知识
matlab里有三种图像:变址图像、灰度图像、真彩色图像
真彩色(double、整数(uint8 uint16))——显示指令 image(X), axis image off
例:一副512*512 * 3 的lena.bmp是一副真彩色图像,imold = imfinfo(‘lena’,’bmp’) 是一个struct 具有24个成员。其中 水平/垂直分辨率=2835.
灰度图(double、整数(uint8 uint16))——显示指令:imagesc(X); colormap(gray); axis image off
dpi vs ppi
打印机500dpi * 500dpi 指的是打出的一英寸上有500个墨点,每两个墨点间的距离为1/500英寸。 1英寸 = 25.4mm毫米
图像分辨率:ppi是每英寸的像素数,一般是数码相机的分辨率。彩色打印机的分辨率为N dpi, 数码相机水平像素为M, 则最大可打印出的照片为 M/N 英寸。
计算方程 PPI=x2+y2√Z ,其中Z为屏幕的对角线尺寸。
最后
以上就是感性店员最近收集整理的关于Matlab 画图的全部内容,更多相关Matlab内容请搜索靠谱客的其他文章。


发表评论 取消回复