from matplotlib import pyplot as plt
import numpy as np

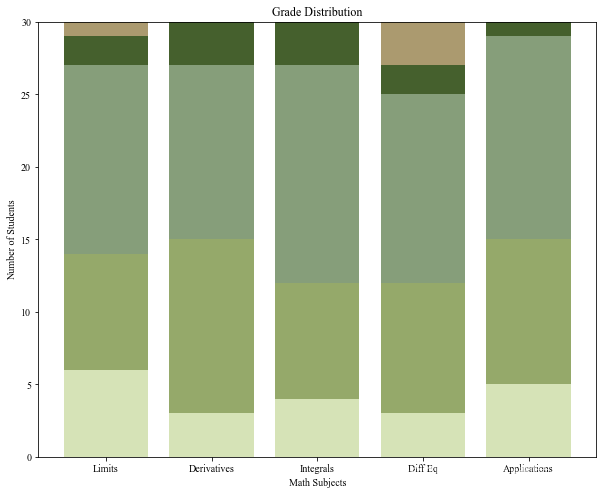
unit_topics = ['Limits', 'Derivatives', 'Integrals', 'Diff Eq', 'Applications']
As = [6, 3, 4, 3, 5]
Bs = [8, 12, 8, 9, 10]
Cs = [13, 12, 15, 13, 14]
Ds = [2, 3, 3, 2, 1]
Fs = [1, 0, 0, 3, 0]

c_bottom = np.add(As, Bs)
d_bottom = np.add(c_bottom, Cs)
f_bottom = np.add(d_bottom, Ds)

# create our plot here
plt.figure(figsize=(10, 8))
plt.bar(range(len(As)), As, color="#D6E3B7")
plt.bar(range(len(Bs)), Bs, bottom = As, color="#95A96A")
plt.bar(range(len(c_bottom)), Cs, bottom = c_bottom, color="#869E7A")
plt.bar(range(len(d_bottom)), Ds, bottom = d_bottom, color="#45602D")
plt.bar(range(len(f_bottom)), Fs, bottom = f_bottom, color="#AB9A6F")
ax = plt.subplot()
ax.set_xticks(range(len(unit_topics)))
ax.set_xticklabels(unit_topics)
ax.set_title("Grade Distribution")
ax.set_xlabel("Math Subjects")
ax.set_ylabel("Number of Students")
plt.savefig("our_stacked_bar.png")
plt.show()

最后
以上就是大力苗条最近收集整理的关于python matplotlib 堆叠柱状图 visualization的全部内容,更多相关python内容请搜索靠谱客的其他文章。
本图文内容来源于网友提供,作为学习参考使用,或来自网络收集整理,版权属于原作者所有。


发表评论 取消回复