线性模型的建模,运算过程,数据的展示,拟合结果的展示!
代码展示:
import numpy as np
import tensorflow as tf
import matplotlib.pyplot as plt

def liner_regression():
    #生成数据
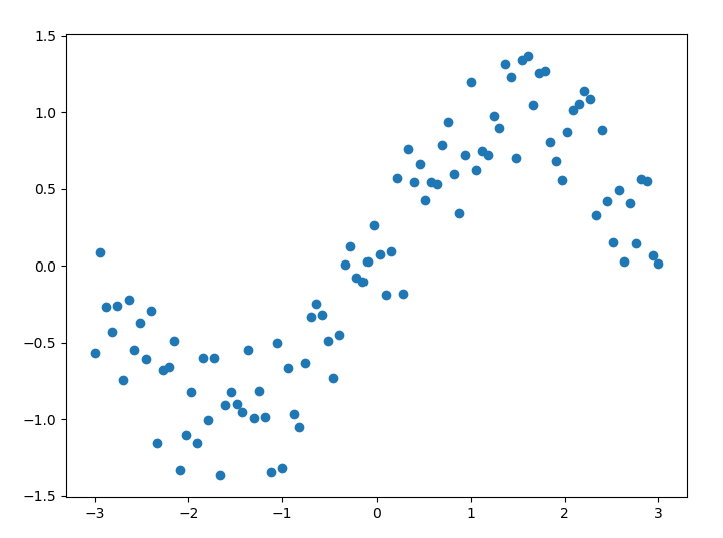
    n_object = 100
    xs = np.linspace(-3,3,n_object)
    ys = np.sin(xs) + np.random.uniform(-0.5,0.5,n_object)
    plt.figure(figsize=[8,6])
    plt.scatter(xs,ys)
    plt.show()
    #给数据建立placeholder
    X = tf.placeholder(tf.float32,name="X")
    Y = tf.placeholder(tf.float32,name="Y")
    #初始化权重和偏置
    weight = tf.Variable(tf.random_normal([1]),name="weight")
    bias = tf.Variable(tf.random_normal([1]),name="bias")
    #进行求预测值
    prediction = tf.add(tf.multiply(weight,X),bias)
    #定义损失函数和优化器
    loss = tf.square(Y-prediction)
    train = tf.train.GradientDescentOptimizer(learning_rate=1e-2).minimize(loss)
    #初始化变量
    init = tf.global_variables_initializer()
    #定义session
    with tf.Session() as sess:
        #初始化,保存定义的运算图
        sess.run(init)
        writer = tf.summary.FileWriter("./logs",sess.graph)
        #定义迭代次数
        for i in range(100):
            #定义梯度下降的batch_size,SGD
            loss_total = 0
            for x, y in zip(xs,ys):
                _,l = sess.run(fetches=[train,loss],feed_dict={X:x,Y:y})
                loss_total+=l
            loss_total/=xs.shape[0]
            if i%5==0:
                print("Iterator:{},loss:{}".format(i,loss_total))
        writer.close()
        w,b = sess.run([weight,bias])
        print("最终的  W:{},b:{}".format(w,b))
    #画图,展示结果
    plt.figure(figsize=[10,8])
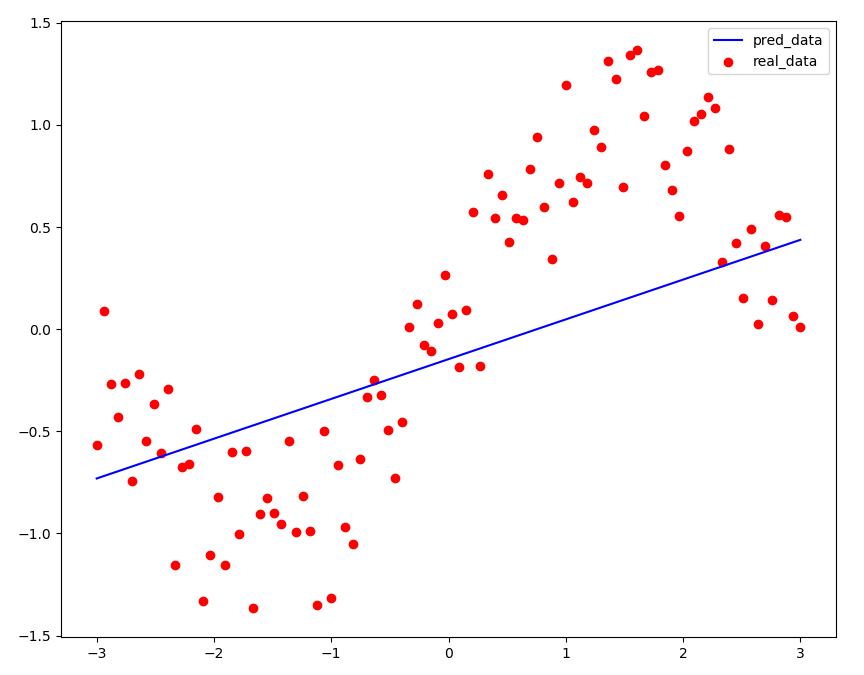
    plt.scatter(xs,ys,label="real_data",c="r")
    plt.plot(xs,w*xs+b,label="pred_data",c="b")
    plt.legend()
    plt.show()
    return
数据展示:(加入了噪声的结果)

效果展示:

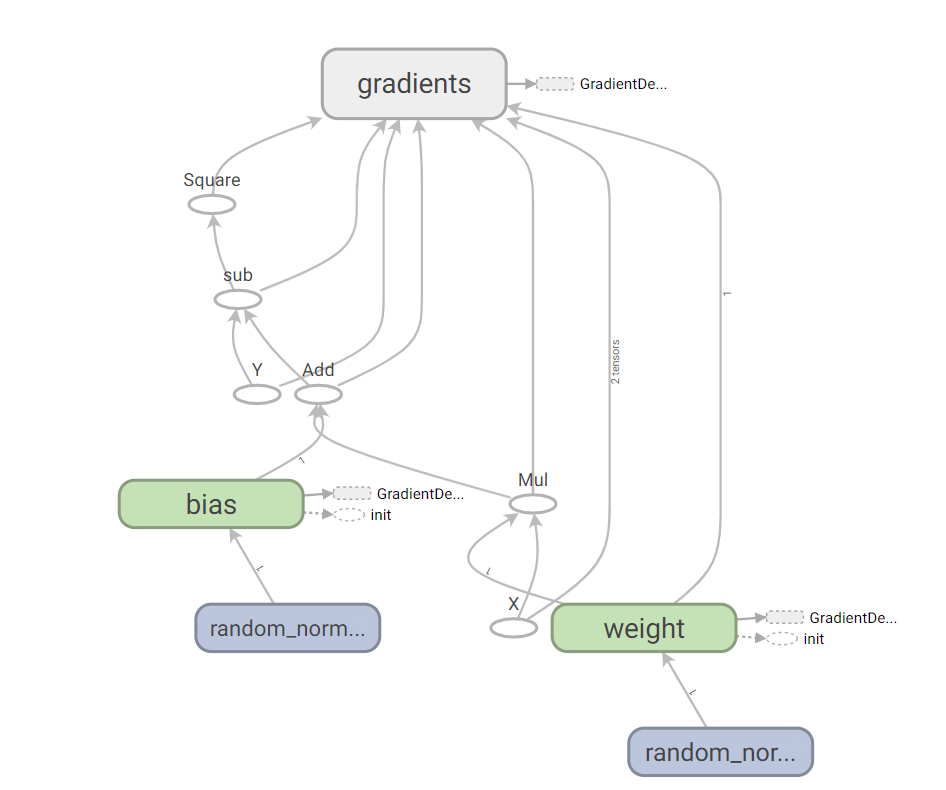
在附上tensorboard的图模型:

上述代码使用了,梯度下降的优化方法,是因为我们的函数凹凸性特别好,可以收敛的,但是复杂一点的函数呢?
有任何问题都可指出说明,一定解答!!
最后
以上就是舒适飞机最近收集整理的关于(二)Tensorflow的线性回归模型的全部内容,更多相关(二)Tensorflow内容请搜索靠谱客的其他文章。
本图文内容来源于网友提供,作为学习参考使用,或来自网络收集整理,版权属于原作者所有。


发表评论 取消回复