之前整理在印象笔记中,现在搬出来。分本地调试和远程调试。本文亲测通过并截图,有问题欢迎留言探讨。
(参考网上多位前辈的博客,整理在笔记里忘记保存原文链接,这里无法贴出链接,望见谅)
# 痛处
一般php项目调试都用echo, var_dump()之类的函数调试,项目大的话很不方便,也很低效;
# 预备
安装xdebug扩展;
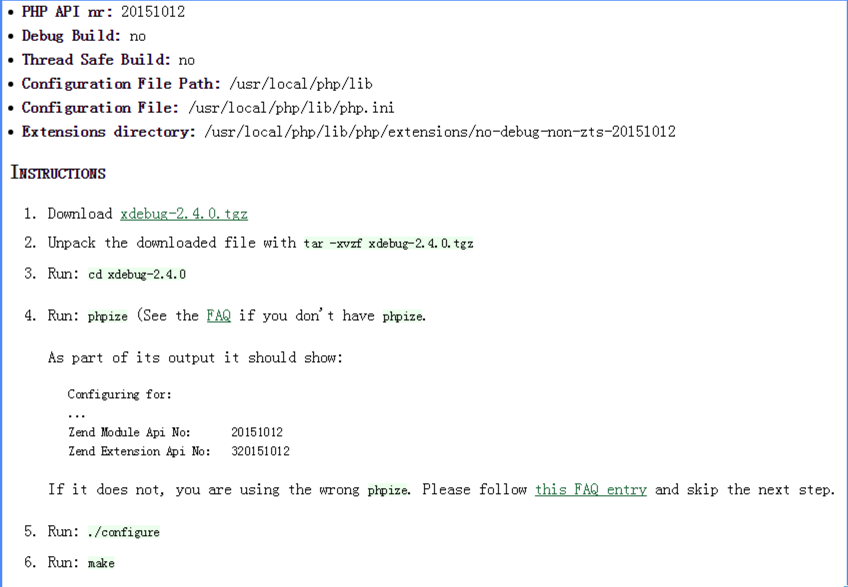
官网
https://xdebug.org/download.php
windows找相应的版本下载即可,linux下在
https://xdebug.org/wizard.php这个页面把 php -i 输出结果放里面会告诉你怎么弄,相当方便; 如下:
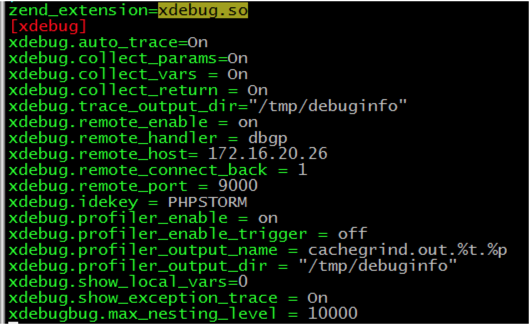
1,修改php配置文件,在最后添加.
zend_extension = "E:/wamp/bin/php/php5.5.12/zend_ext/php_xdebug-2.2.5-5.5-vc11-x86_64.dll";
[xdebug]
xdebug.auto_trace=On
xdebug.collect_params=On
xdebug.collect_vars = On ;收集变量
xdebug.collect_return = On ;收集返回值
xdebug.trace_output_dir="e:/wamp/tmp/debuginfo"
xdebug.remote_enable = on
xdebug.remote_handler = dbgp
xdebug.remote_host= localhost ;用于远程调试 服务器的地址
xdebug.remote_connect_back = 1;用于远程调试
xdebug.remote_port = 9000
xdebug.idekey = PHPSTORM
xdebug.profiler_enable = on
xdebug.profiler_enable_trigger = off
xdebug.profiler_output_name = cachegrind.out.%t.%p
xdebug.profiler_output_dir = "E:/wamp/tmp/debuginfo"
xdebug.show_local_vars=0
xdebug.show_exception_trace = On ;开启异常跟踪
xdebugbug.max_nesting_level = 10000
phpinfo中验证xdebug扩展是否启用。 服务端配置完成!
2,phpstrom 配置
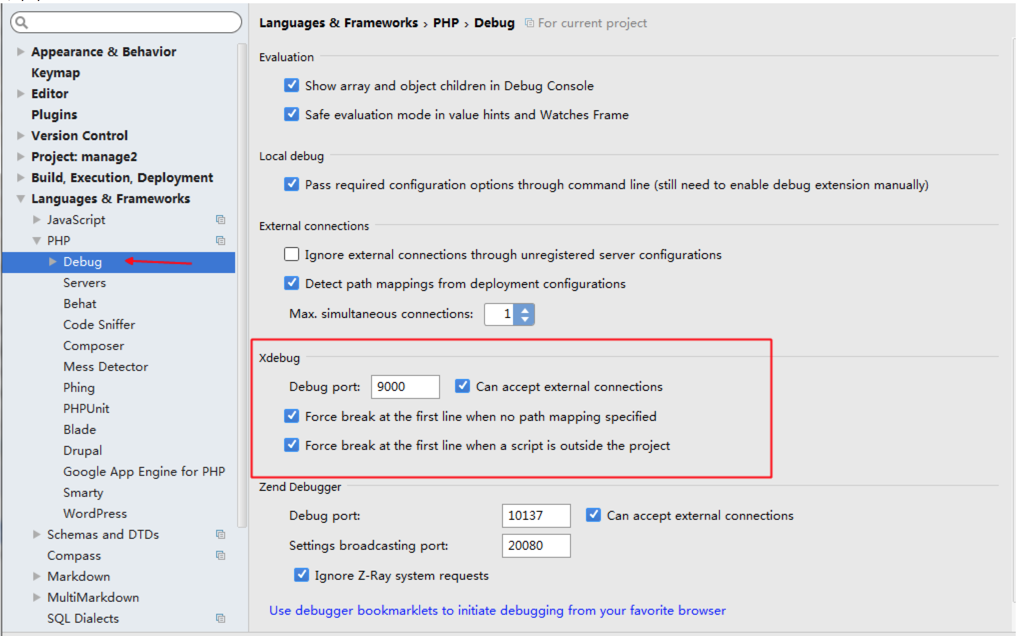
这部配置的端口意思是 IDE 会在本机监听9000端口
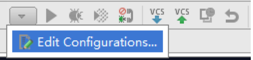
在项目右上角debug配置中
根据项目选择类型如下,网站选择web application,Name项自定义
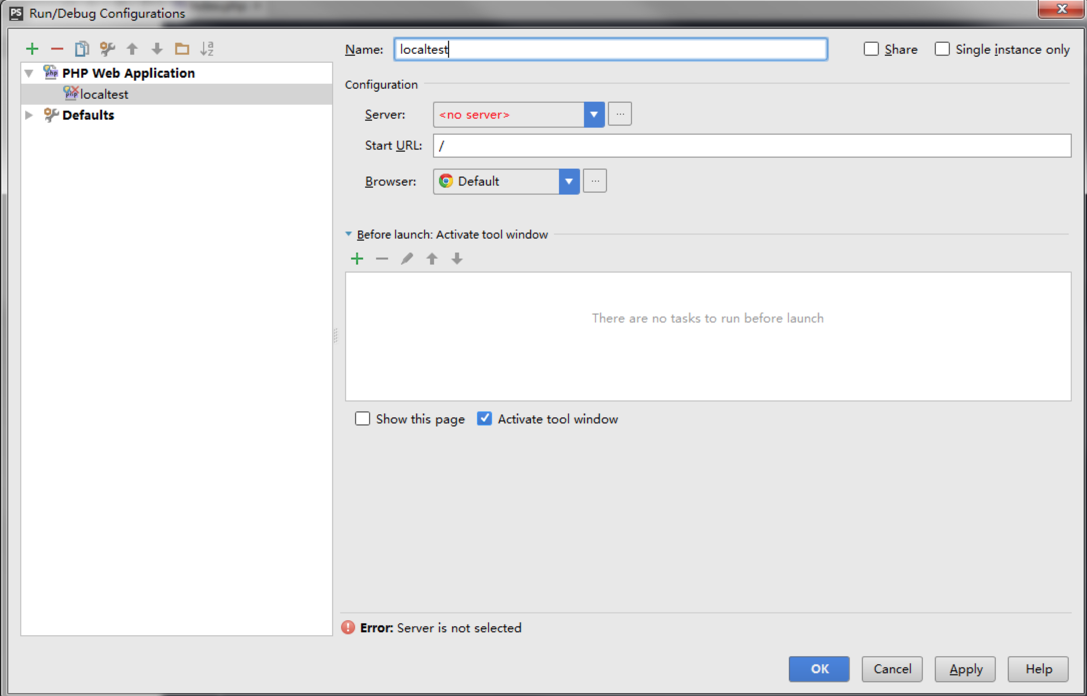
server项没有,点击后面按钮配置
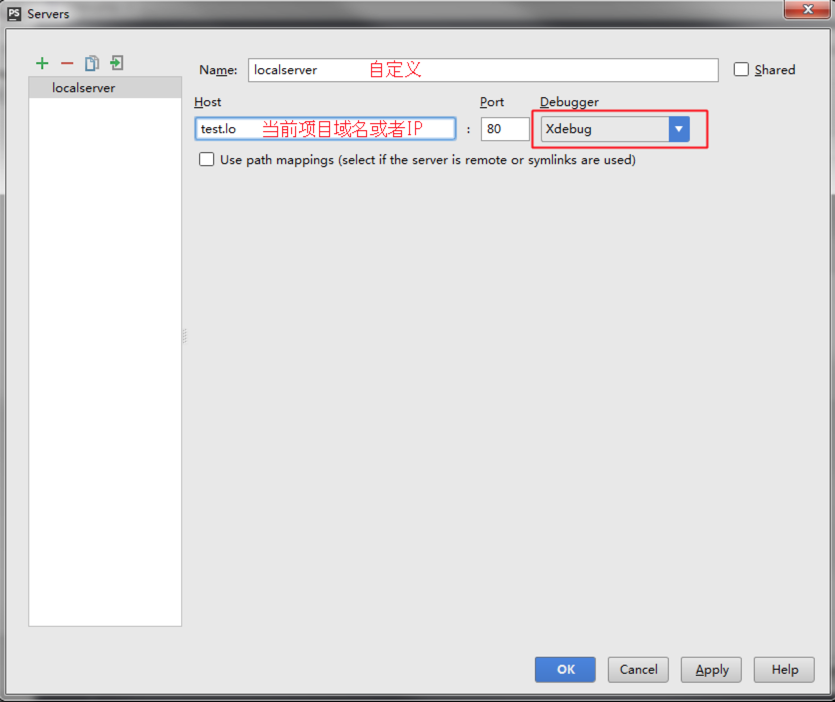
配置starturl(入口地址)
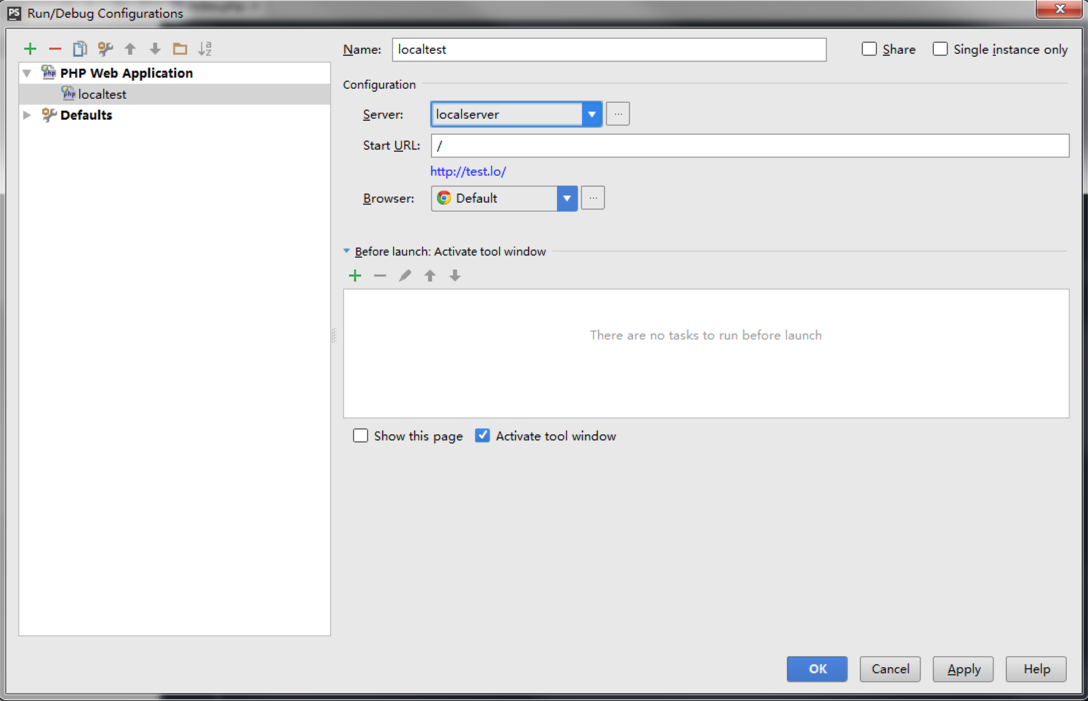
完成配置如下:
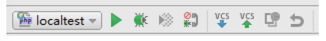
点那个虫子就开启了调试,会在上一步我们配置的默认浏览器打开starturl,如下:
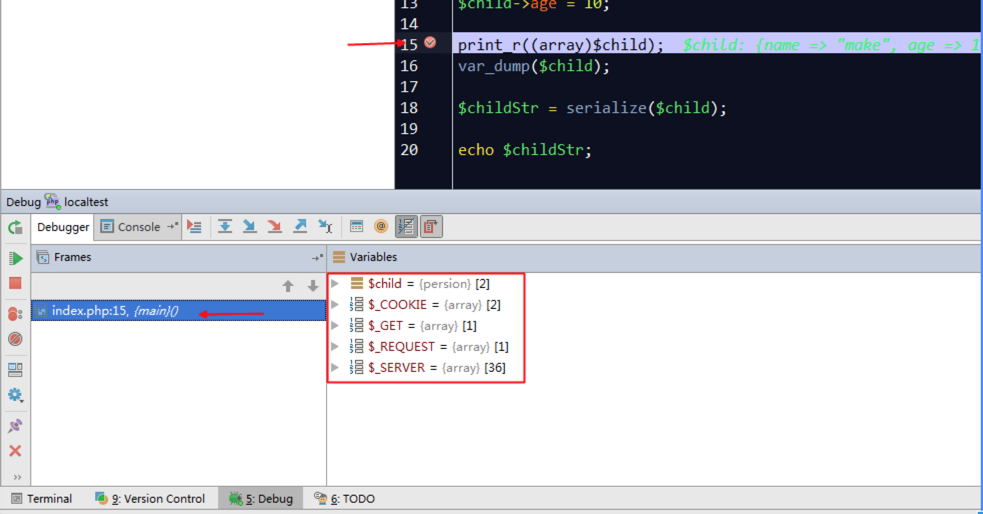
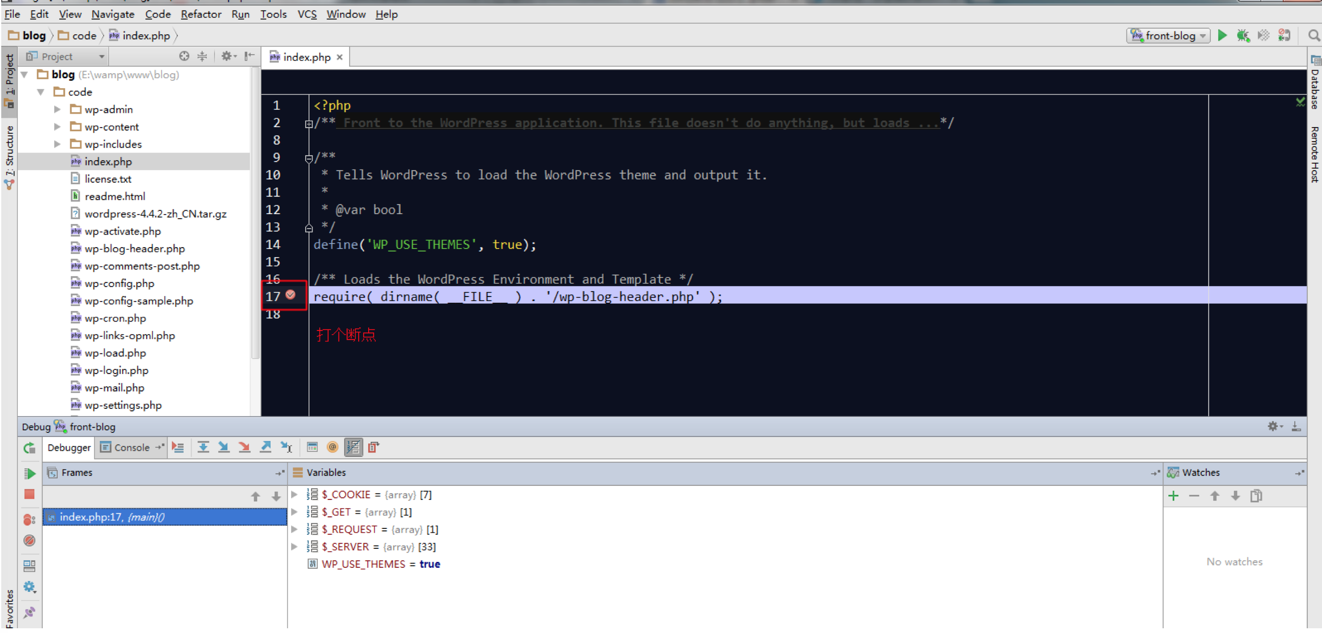
在代码里打一个断点,刷新一下页面,调试窗口会显示详细信息, 上面有操作按钮,如下:
# 优化地方
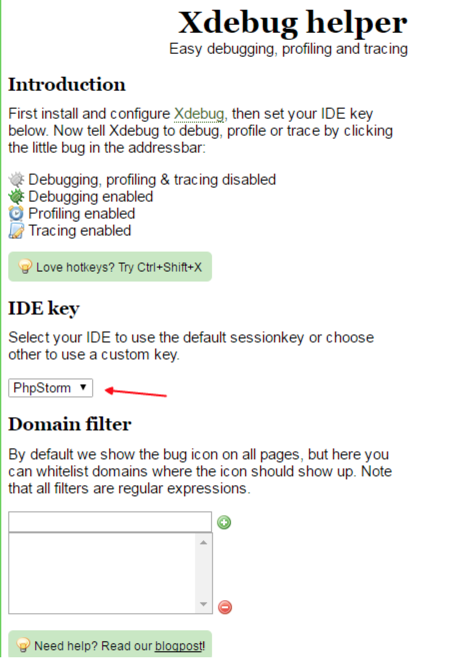
上面调试步骤很麻烦,我们都是希望想调试的时候就调试,推荐插件 chrome 插件 xdebug helper 方便 随时调试;也是个臭虫的图标,安装上配置一下,如下:
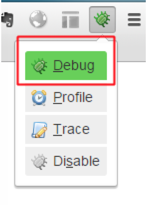
在需要调试的页面启用插件
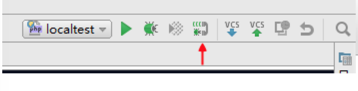
IDE中点亮电话的图标,启动监听,如下:
配置结束,代码里想调试直接打断点,完后浏览器访问页面,运行到断点IDE就会监听debug信息,并把信息显示出来;
#xdebug 远程调试
有点项目在本地开发很难搭建环境,我们需要在远程开发和调试。也就是在本地去调试远程开发机上的代码。
!0,远程调试原理:
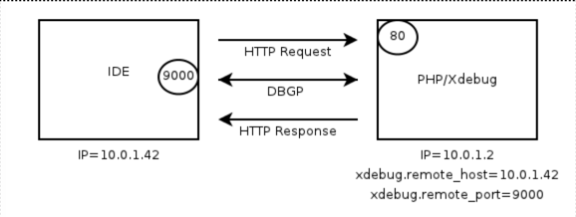
左边是调试客户端,比如IDEA、eclipse之类的IDE,右边是xdebug,运行按照如下步骤进行:
1, IDE监听一个调试端口,默认是9000,可以自行配置。
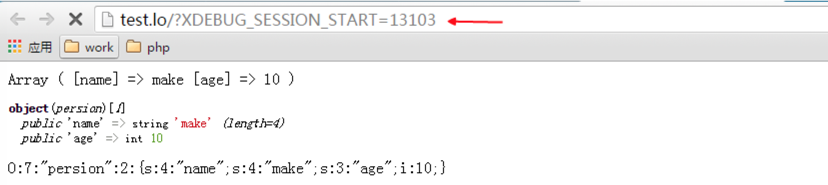
2, 用户访问右边php环境的server,我们这里使用浏览器访问(随便在那都行,为方便选择本地浏览器),一般IDE会自动帮我们在正常的url后面增加
XDEBUG_SESSION_START=一个随机数 的参数。这个参数是用来通知xdebug主动连接IDE的9000端口进行调试的,没有这个参数,xdebug不会去主动连接IDE,
调试也就不会触发。
3, xdebug主动去连接IDE的9000端口, 连接成功后,调试开始。
xdebug是如何知道IDE监听9000端口的呢?
xdebug有两个配置:remote_host和remote_port,分别代表IDE的ip地址和监听端口。由此可见,IDE和xdebug必须协商好监听端口。
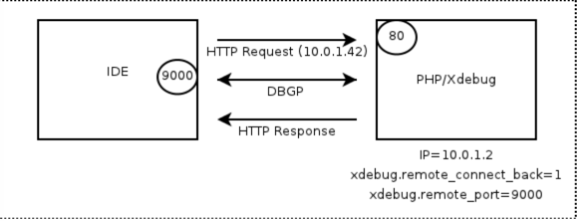
端口好办,但是如果我的ip会变化,那我换一个ip,岂不是要修改下xdebug.remote_host配置吗?好麻烦!!!
不知道ip没关系,xdebug可以自己知道,只要设置 xdebug.remote_connect_back 为1就可以了,其运行原理见下图,实现很简单,xdebug可以从http请求的头部获取ip
地址,之后就用该ip地址作为remote_host来连接。

!1,服务端环境安装xdebug(方法如上)
最关键的两个设置xdebug.remote_host和xdebug.remote_connect_back,
xdebug.remote_host 要设置成
你本机的地址,
多个用逗号隔开
xdebug.remote_connect_back要设置成1或者on
设置完这个会自动忽略remote_host的设置,如果本地是自动获取ip或者多人的话开启这个比较好
服务端的配置已完成!
!2,IDE配置
(调试远端代码一般会和远端开发同时进行,远端调试需要打开一个本地和远端的通道,要不接受不到调试信息)
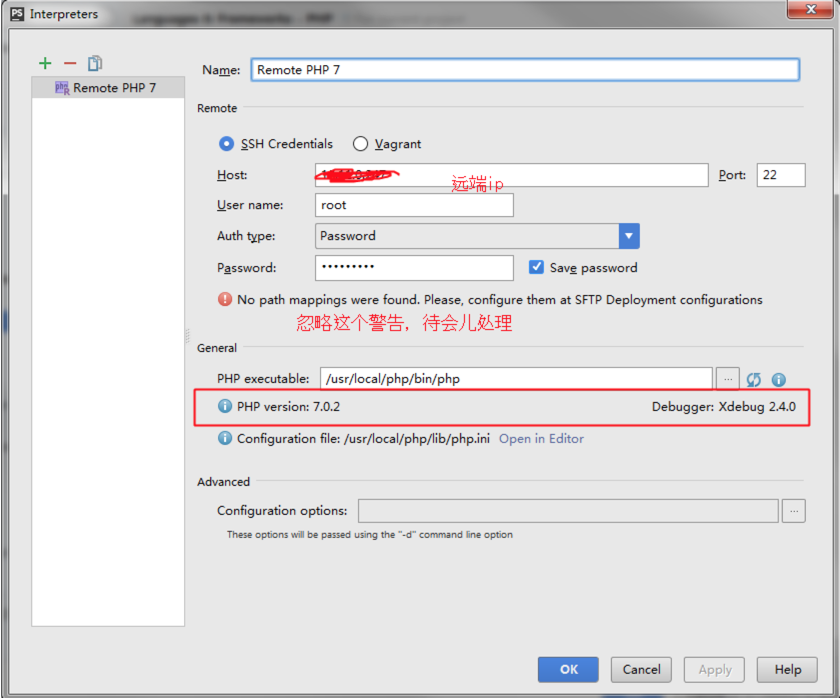
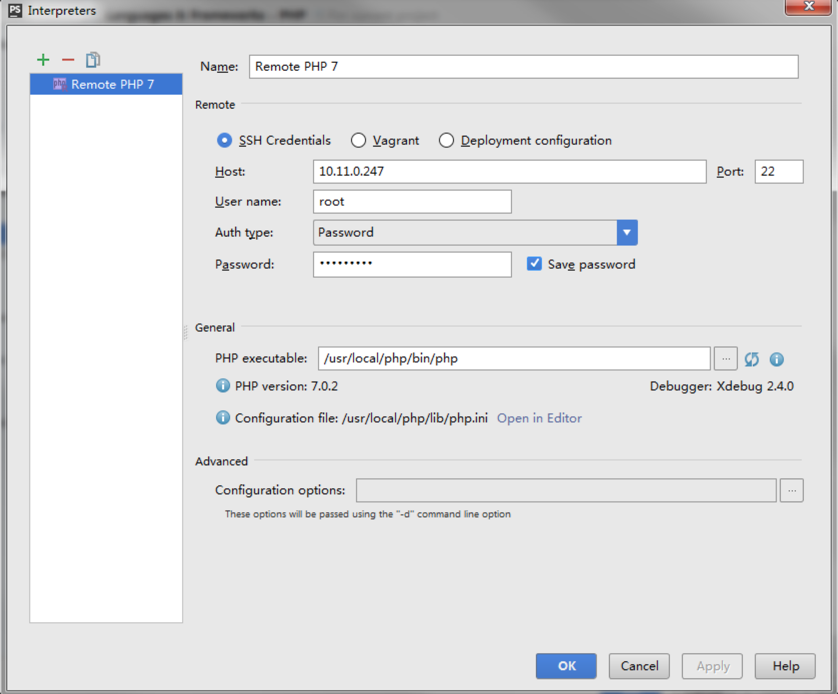
> 新建一个远端的php解释器
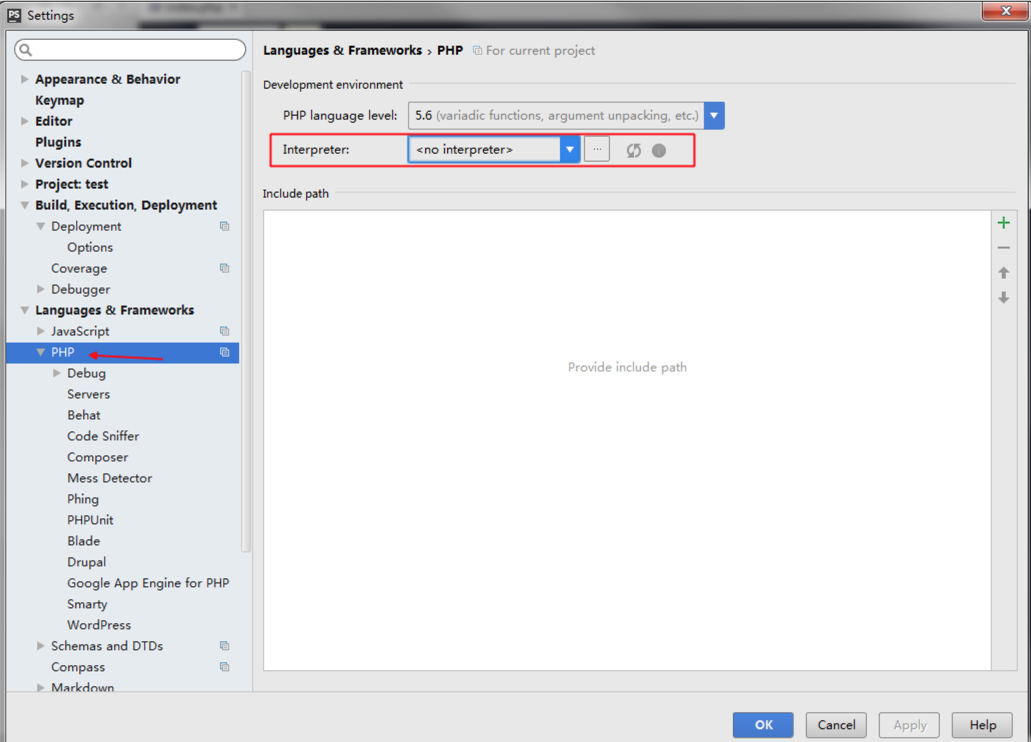
配置正确的话,如下图:
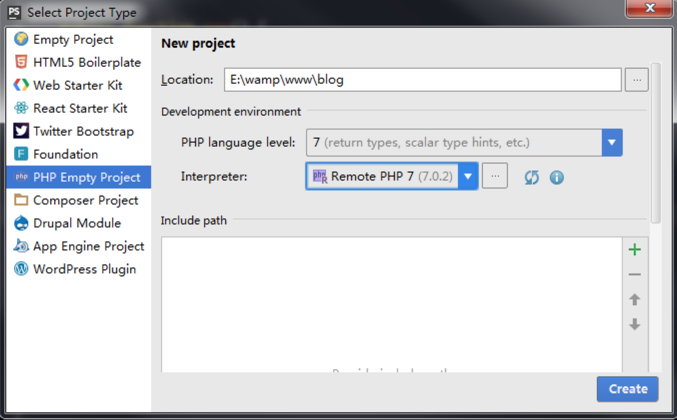
> 新建项目 或者 把本地已有的项目和远端的项目映射一下 都行
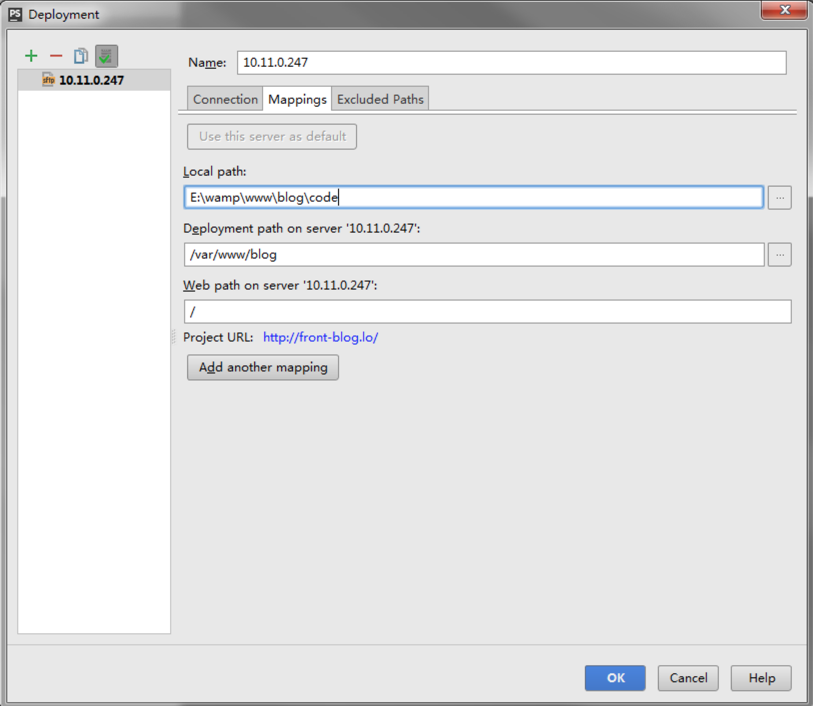
> 在项目中配置 sftp
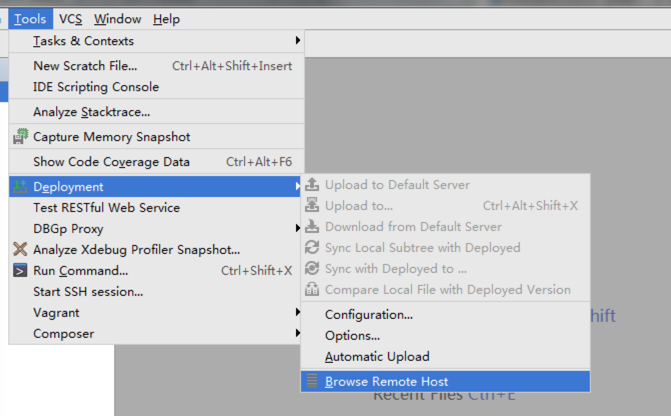
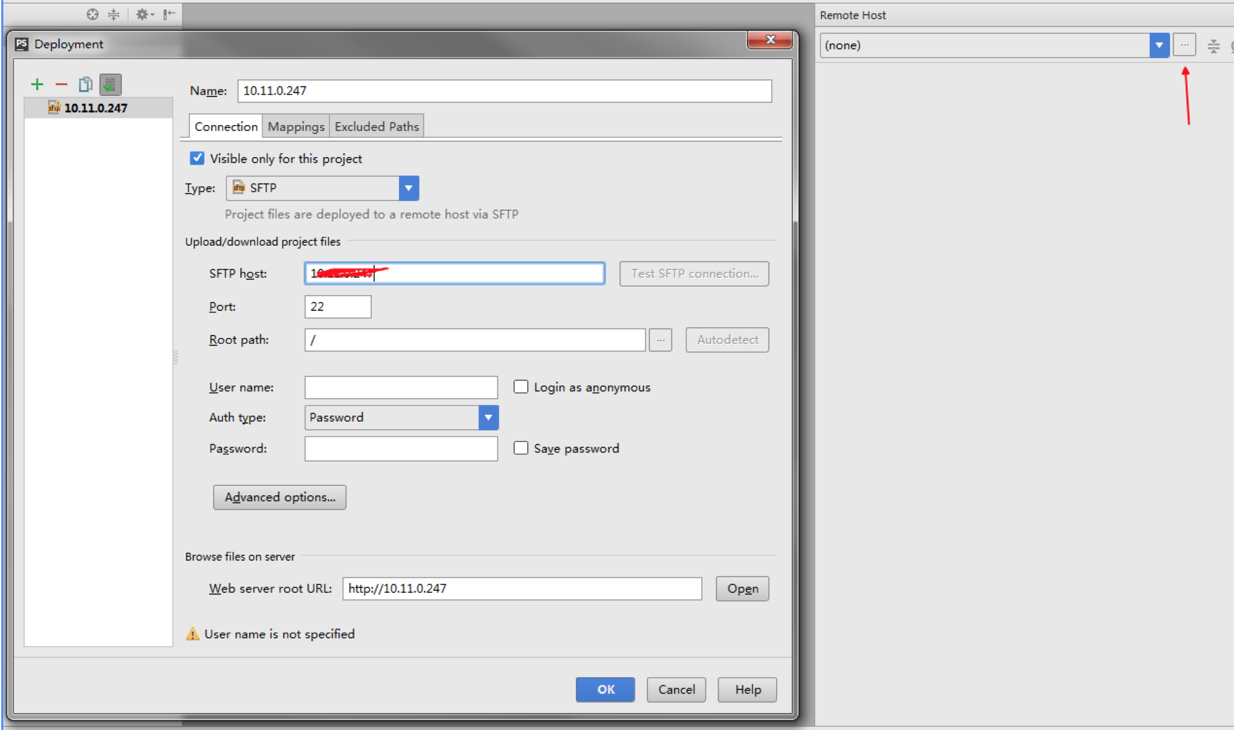
再配置mapping
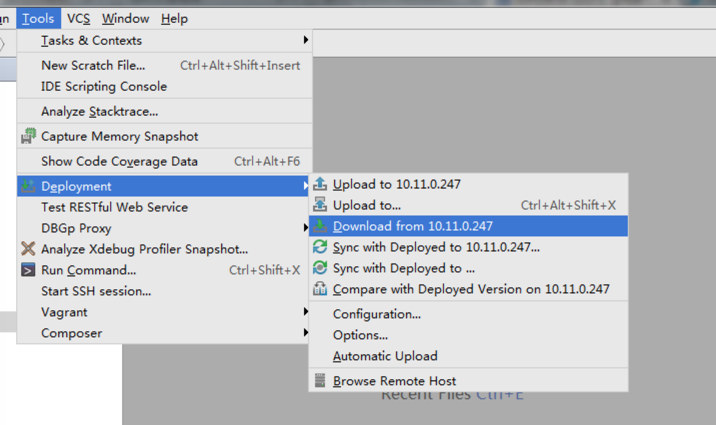
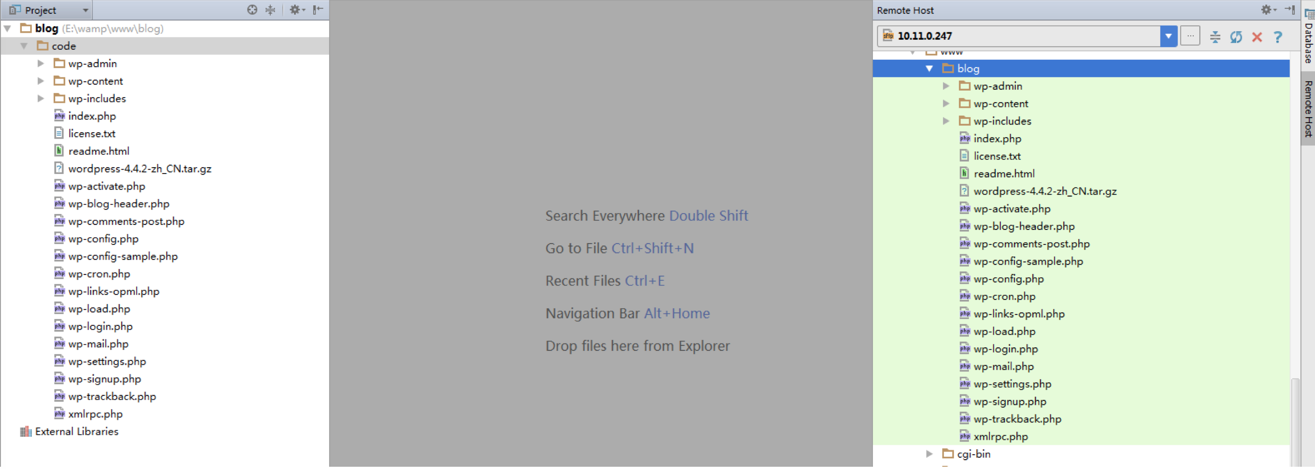
把远端代码下载下来,如下:
来个截图,好累啊
这个时候看我们开始配置的那个远端解释器 之前警告没了,因为我们配置了mapping
配置debug,步骤同上,不一样的地方是配置 path mapping
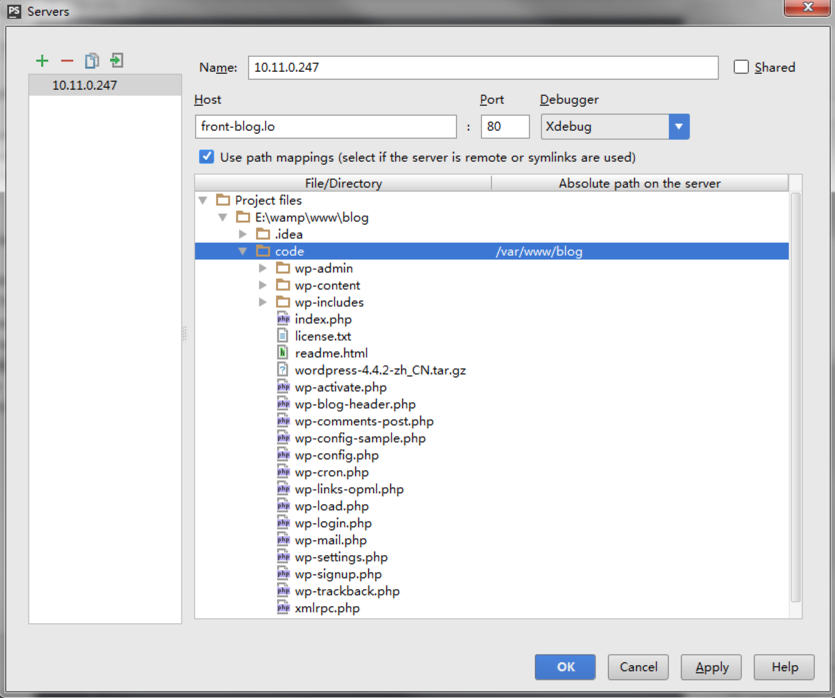
开始调试了 打断点 浏览器访问远端的地址 debug窗口已经有调试信息了

忽略我的504 这是别的原因造成的和xdebug没关系 因为是测试项目懒得管 ~ ~
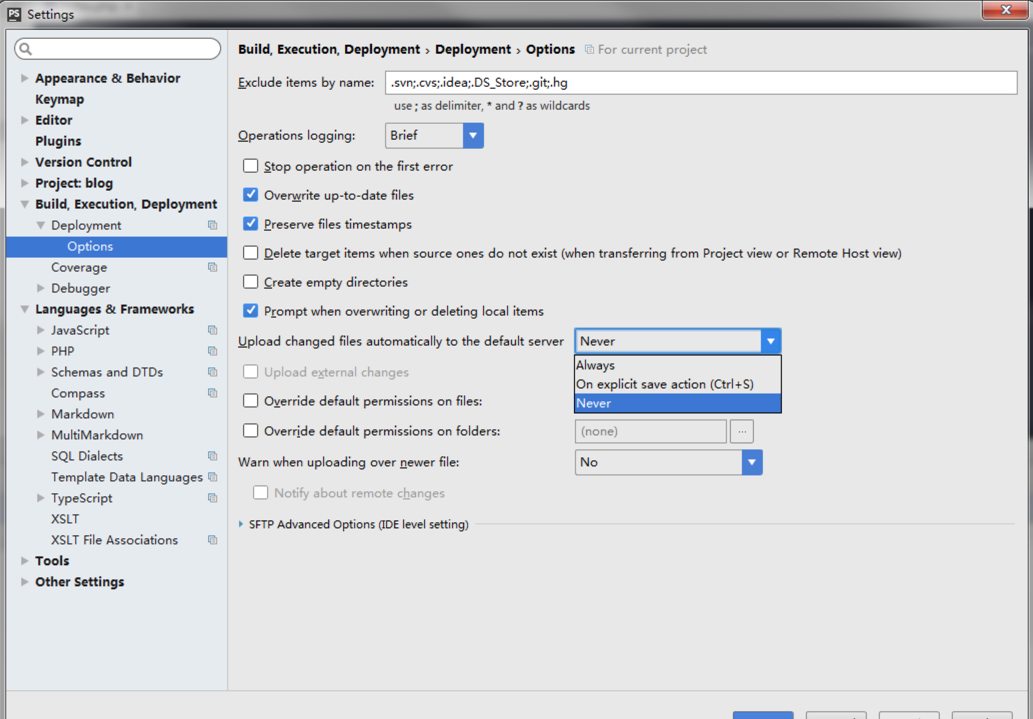
开发远端项目我们刚才配置好了sftp,我们本地修改可以通过如下配置自动同步到远端 我一般选 ctrl + s 那项 按ctrl + s会自动同步到远端开发机
转载于:https://www.cnblogs.com/anyeshe/p/5746404.html
最后
以上就是刻苦果汁最近收集整理的关于php调试利器 -- xdebug的全部内容,更多相关php调试利器内容请搜索靠谱客的其他文章。
本图文内容来源于网友提供,作为学习参考使用,或来自网络收集整理,版权属于原作者所有。


发表评论 取消回复