#导入模块
import matplotlib.pyplot as plt
#导入3d包
from mpl_toolkits.mplot3d import Axes3D
#创建X Y Z
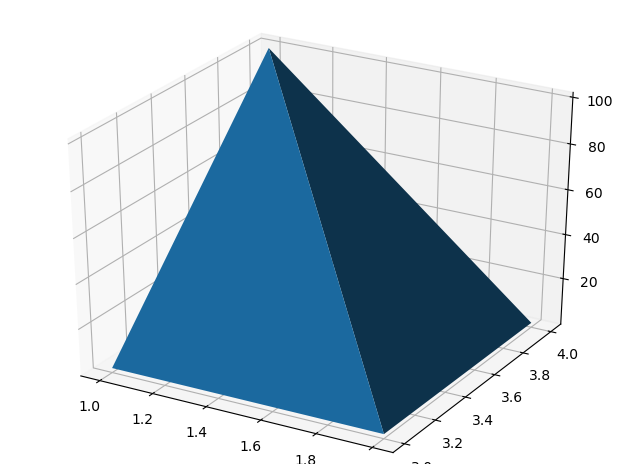
X=[1,1,2,2]
Y=[3,4,4,3]
Z=[1,100,1,1]
figure=plt.figure()
#创建Axes3D对象
ax=Axes3D(figure)
ax.plot_trisurf(X,Y,Z)
plt.show()
最后
以上就是谦让萝莉最近收集整理的关于matplotlib模块练习,绘制三维图的全部内容,更多相关matplotlib模块练习内容请搜索靠谱客的其他文章。
本图文内容来源于网友提供,作为学习参考使用,或来自网络收集整理,版权属于原作者所有。


发表评论 取消回复