zabbix监控nginx状态,显示状态active,accepts,handled,requests
一、
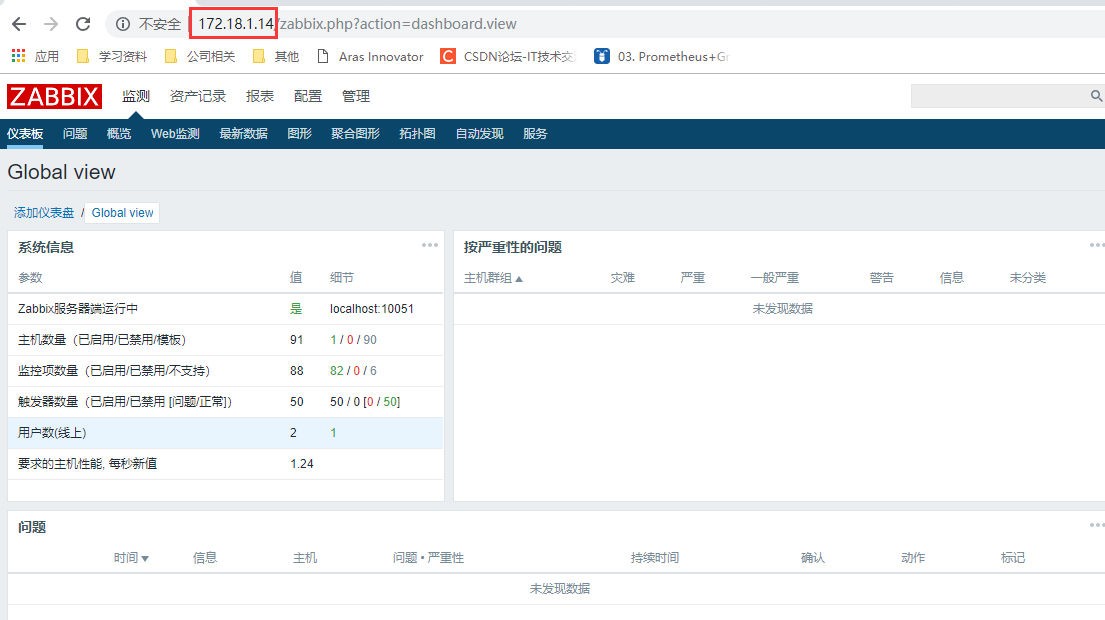
首先,zabbix server部署完成,可用。
接上篇zabbix部署文章,我这里zabbix server主机为:172.18.1.14
确保可以正常访问。
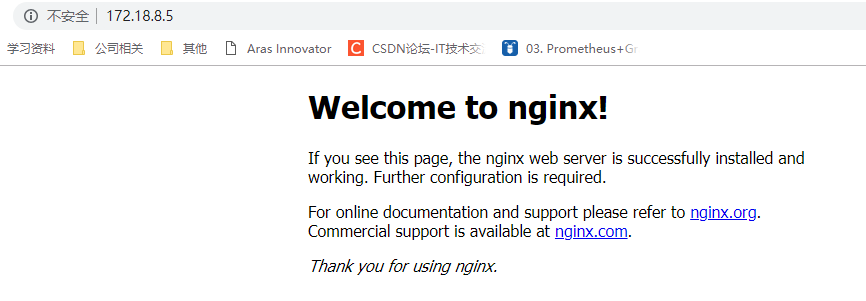
nginx主机为:172.18.8.5,确保主机安装了nginx服务,可用。
开启被监控端nginx状态模块。
[root@k8smaster2 nginx-1.8.1]# ./configure --help |grep statu
  --with-http_stub_status_module     enable ngx_http_stub_status_module
[root@k8smaster2 nginx-1.8.1]#
[root@k8smaster2 nginx-1.8.1]# ./configure --prefix=/usr/local/nginx --with-http_stub_status_module
[root@k8smaster2 nginx-1.8.1]# make
配置nginx.conf,启用status
vim /usr/local/nginx/conf/nginx.conf
#增加一个location
location /status {
        stub_status;
        }
/usr/local/nginx/sbin/nginx -s reload
确认可以拿到nginx状态
[root@k8smaster2 ~]# curl 172.18.8.5/status
Active connections: 1
server accepts handled requests
 2 2 2
Reading: 0 Writing: 1 Waiting: 0
[root@k8smaster2 ~]# curl 172.18.8.5/status | awk 'NR==1{print $NF}'
  % Total    % Received % Xferd  Average Speed   Time    Time     Time  Current
                                 Dload  Upload   Total   Spent    Left  Speed
100    97  100    97    0     0   157k      0 --:--:-- --:--:-- --:--:-- 97000
1
[root@k8smaster2 ~]# curl -s 172.18.8.5/status | awk 'NR==1{print $NF}'
1
[root@k8smaster2 ~]#
接下来,nginx主机上安装zabbix-agent服务。
yum install zabbix40-agent -y
配置zabbix_agent.conf
vim /etc/zabbix/zabbix_agentd.conf
#指定server和hostname
Server 172.18.1.14
Hostname= nginx
[root@k8smaster2 ~]# egrep -v "(^$|^#)" /etc/zabbix/zabbix_agentd.conf
PidFile=/run/zabbix/zabbix_agentd.pid
LogFile=/var/log/zabbix/zabbix_agentd.log
LogFileSize=0
Server=172.18.1.14
ServerActive=172.18.8.14
Hostname=nginx
[root@k8smaster2 ~]#
然后创建一个nginx状态的脚本
[root@k8smaster2 src]# ls
debug  kernels  nginx-1.8.1  nginx-1.8.1.tar.gz  nginx_status.sh
[root@k8smaster2 src]# cat nginx_status.sh
#!/bin/bash
#######################
function active {
curl 172.18.8.5/status 2>/dev/null | awk 'NR==1{print $NF}'
}

function accepts {
curl 172.18.8.5/status 2>/dev/null | awk 'NR==3{print $1}'
}
function handled {
curl 172.18.8.5/status 2>/dev/null | awk 'NR==3{print $2}'
}
function requests {
curl 172.18.8.5/status 2>/dev/null | awk 'NR==3{print $3}'
}
function reading {
curl 172.18.8.5/status 2>/dev/null | awk 'NR==4{print $2}'
}
function writing {
curl 172.18.8.5/status 2>/dev/null | awk 'NR==4{print $4}'
}
function waiting {
curl 172.18.8.5/status 2>/dev/null | awk 'NR==4{print $NF}'
}
$1
[root@k8smaster2 src]#
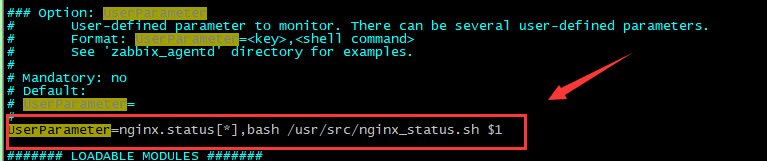
配置zabbix-agent,在用户自定义项中增加脚本路径,以及获取值的方法,来获取脚本值:
UserParameter=nginx.status[*],bash /usr/src/nginx_status.sh $1
在zabbix server确认,是否可以拿到脚本结果
只有拿到脚本执行结果,才能再zabbix web中配置。
[root@zabbix-server ~]#  zabbix_get -s 172.18.8.5 -k "nginx.status[active]"
1
[root@zabbix-server ~]#  zabbix_get -s 172.18.8.5 -k "nginx.status[accepts]"
195
[root@zabbix-server ~]#  zabbix_get -s 172.18.8.5 -k "nginx.status[handled]"
196
[root@zabbix-server ~]#  zabbix_get -s 172.18.8.5 -k "nginx.status[requests]"
225
[root@zabbix-server ~]#
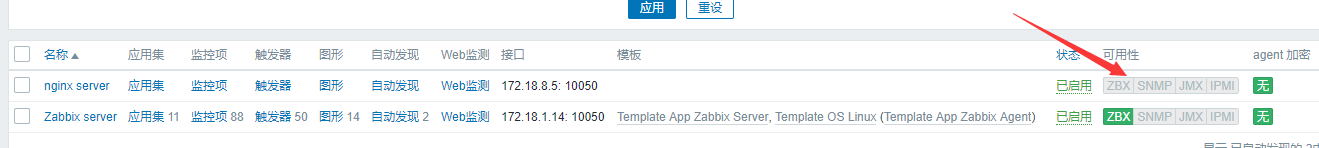
WEB登录zabbix,配置主机,监控项
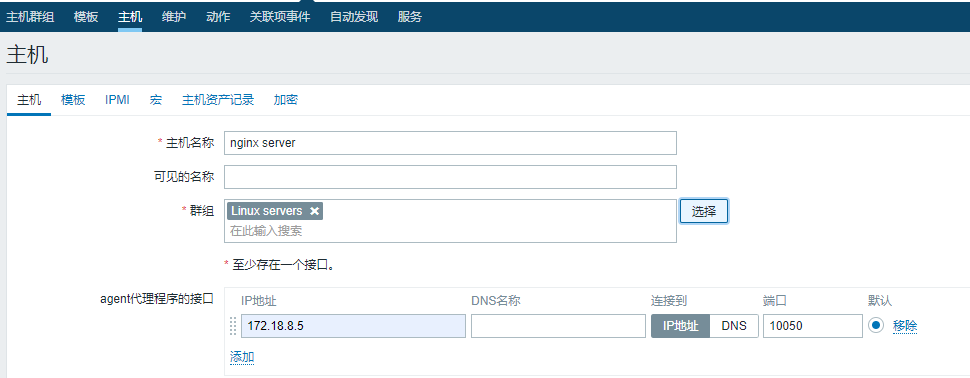
主机创建完成后,由于没有创建监控项,状态栏是灰色。
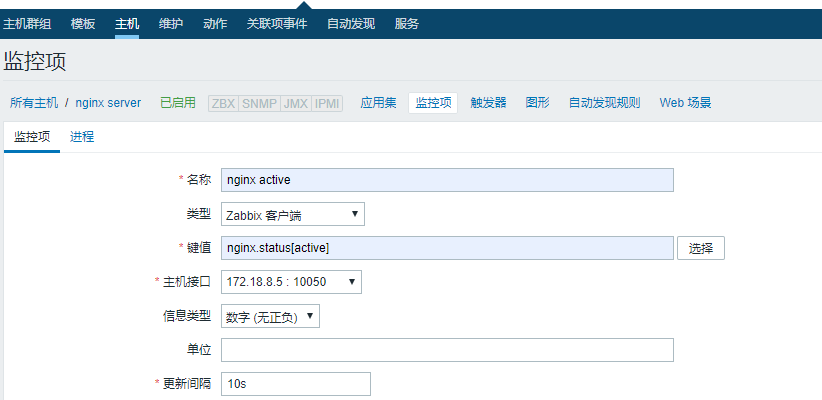
创建监控项
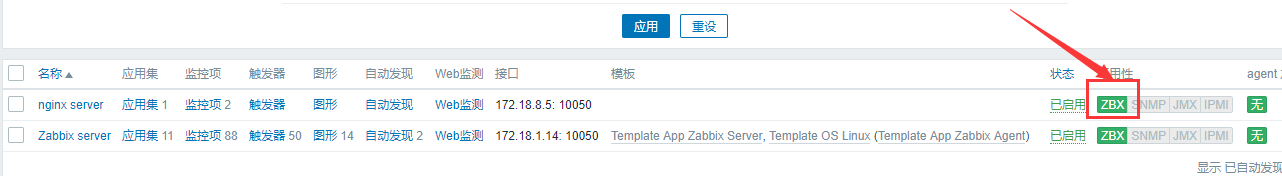
可以看到,此时状态栏显示绿色,可用。
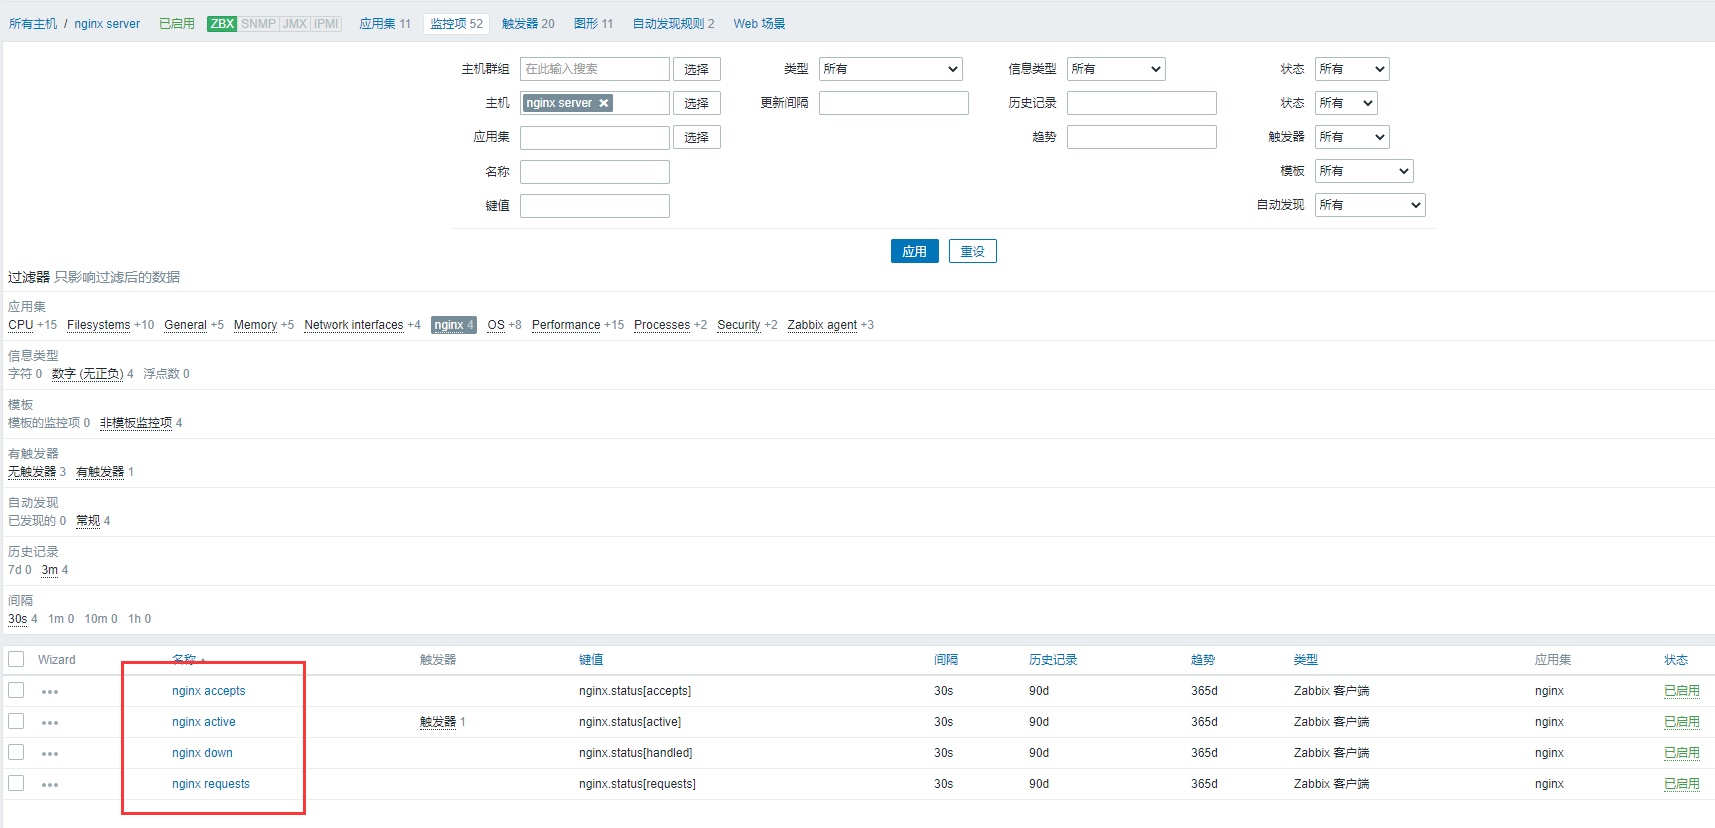
可以看到有数据进来,到这里说明配置没有问题。
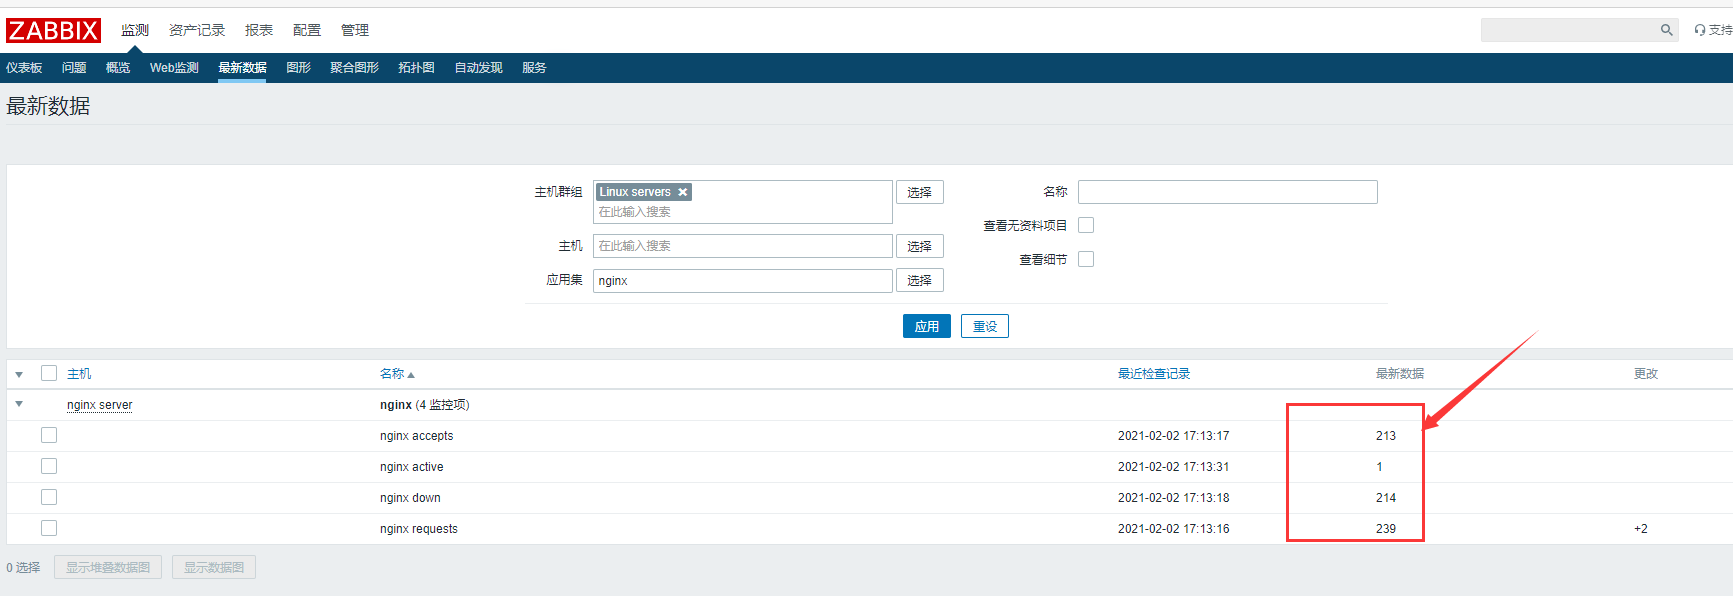
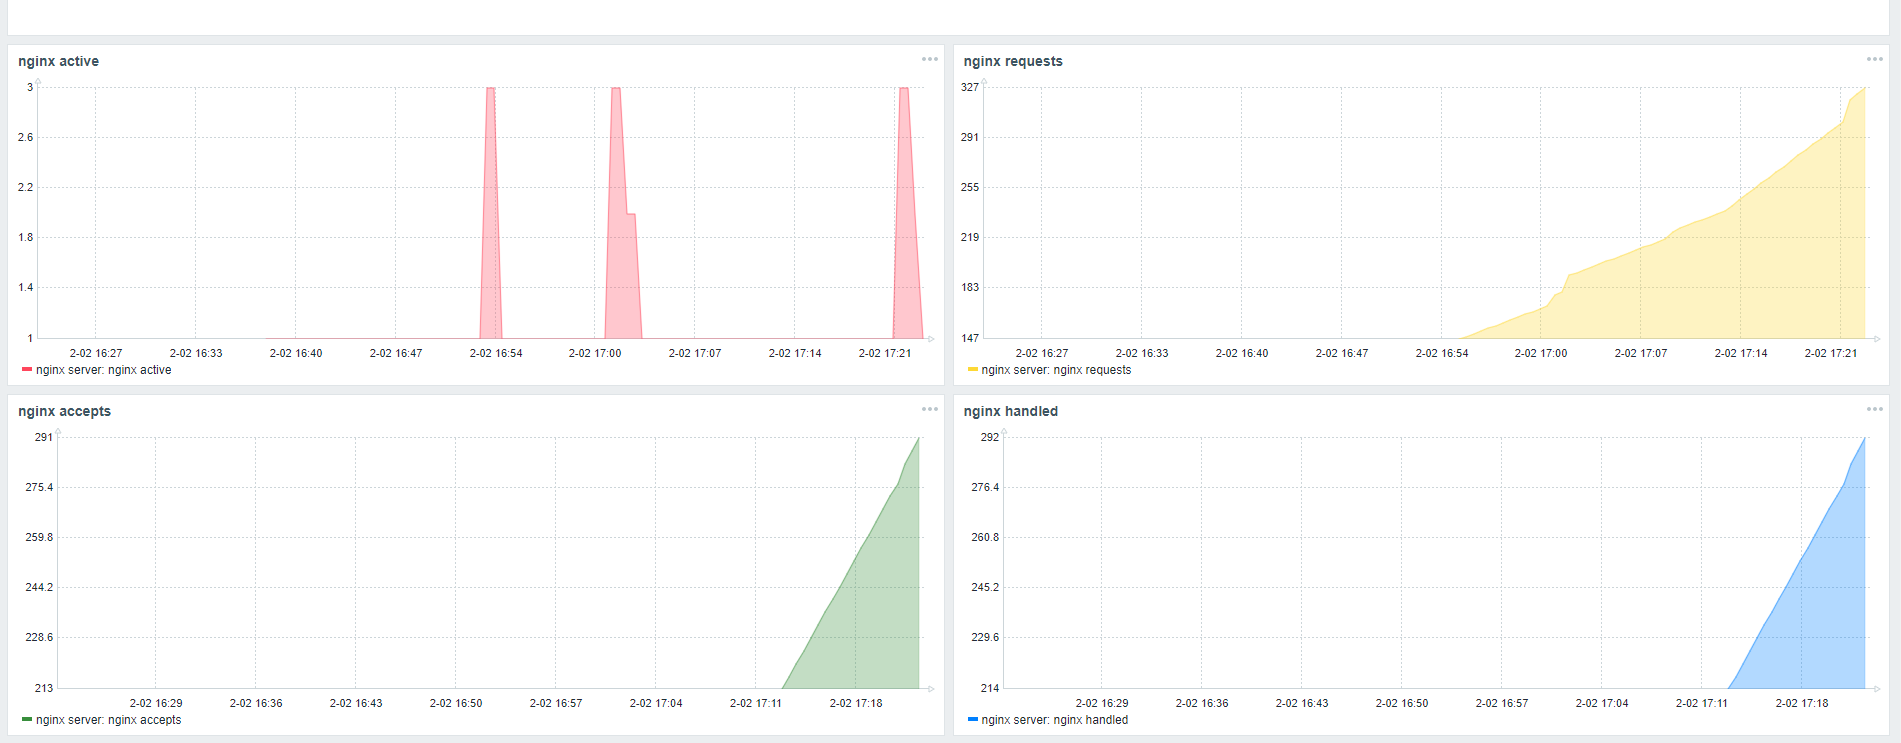
这样就可以实时监控nginx状态信息了。
如果nginx服务停止了,能否通知管理员呢?zabbix也是可以的,这就需要触发器与动作了。下篇会详细介绍这部分。
最后
以上就是笑点低白云最近收集整理的关于zabbix监控nginx状态,显示状态active,accepts,handled,requests的全部内容,更多相关zabbix监控nginx状态,显示状态active内容请搜索靠谱客的其他文章。
本图文内容来源于网友提供,作为学习参考使用,或来自网络收集整理,版权属于原作者所有。


发表评论 取消回复