我是靠谱客的博主 知性大白,这篇文章主要介绍Prometheus:监控与告警:18: 监控Kubernetes的Pod集成Api ServerKubernetes环境准备RBAC配置文件ConfigMap设定文件Deployment配置文件启动Prometheus服务结果确认确认连接信息配置文件,现在分享给大家,希望可以做个参考。
在前面的文章中介绍了Kubernetes和Prometheus进行集成的常见方式,这篇文章结合具体的示例介绍一下如何监控Kubernetes的Pod。
集成Api Server
集成方式
Kubernetes主要提供了如下5种服务发现模式和Prometheus进行集成:
- Node
- Pod
- Endpoints
- Service
- Ingress
监控Pod主要需要使用Pod服务发现模式,配置方式如下所示
Pod服务发现模式
        kubernetes_sd_configs:
        - role: pod
监控方法
| 监控对象 | 监控指标内容 | 服务发现模式 | 监控方式 | 数据来源 |
|---|---|---|---|---|
| 内置了Promthues支持的应用Pod实例 | Pod实例中采集的自定义的监控指标 | pod | 白盒监控 | 自定义Pod |
Kubernetes环境准备
本文使用Kubernetes 1.17,可参看下文进行快速环境搭建:
- 单机版本或者集群版本环境搭建
[root@host131 ~]# kubectl get nodes -o wide
NAME              STATUS   ROLES    AGE    VERSION   INTERNAL-IP       EXTERNAL-IP   OS-IMAGE                KERNEL-VERSION          CONTAINER-RUNTIME
192.168.163.131   Ready    <none>   116m   v1.17.0   192.168.163.131   <none>        CentOS Linux 7 (Core)   3.10.0-957.el7.x86_64   docker://18.9.7
[root@host131 ~]#
RBAC配置文件
准备如下RBAC配置文件
[root@host131 pod]# cat rbac.yml
---
apiVersion: rbac.authorization.k8s.io/v1
kind: ClusterRole
metadata:
  name: prometheus
rules:
- apiGroups: [""]
  resources:
  - pods
  verbs: ["get", "list", "watch"]
- nonResourceURLs: ["/metrics"]
  verbs: ["get"]
---
apiVersion: rbac.authorization.k8s.io/v1
kind: ClusterRoleBinding
metadata:
  name: prometheus
roleRef:
  apiGroup: rbac.authorization.k8s.io
  kind: ClusterRole
  name: prometheus
subjects:
- kind: ServiceAccount
  name: default
  namespace: default
[root@host131 pod]#
ConfigMap设定文件
ConfigMap设定文件如下所示:
[root@host131 pod]# cat configmap.yml
apiVersion: v1
kind: ConfigMap
metadata:
  name: prometheus-configmap
  labels:
    name: prometheus-configmap
  namespace: default
data:
  prometheus.yml: |-
    global:
      scrape_interval: 5s
      evaluation_interval: 5s

    scrape_configs:
      - job_name: 'k8s-pods'
        kubernetes_sd_configs:
        - role: pod

        relabel_configs:
        - source_labels: [__meta_kubernetes_pod_annotation_prometheus_io_scrape]
          action: keep
          regex: true
        - source_labels: [__meta_kubernetes_pod_annotation_prometheus_io_path]
          action: replace
          target_label: __metrics_path__
          regex: (.+)
        - source_labels: [__address__, __meta_kubernetes_pod_annotation_prometheus_io_port]
          action: replace
          regex: ([^:]+)(?::d+)?;(d+)
          replacement: $1:$2
          target_label: __address__
        - action: labelmap
          regex: __meta_kubernetes_pod_label_(.+)
        - source_labels: [__meta_kubernetes_namespace]
          action: replace
          target_label: kubernetes_namespace
        - source_labels: [__meta_kubernetes_pod_name]
          action: replace
          target_label: kubernetes_pod_name
[root@host131 pod]#
Deployment配置文件
Deployment与Service等配置文件内容如下所示:
[root@host131 pod]# cat deployment.yml
---
apiVersion: v1
kind: Service
metadata:
  name: prometheus-service
  namespace: default
  annotations:
      prometheus.io/scrape: 'true'
      prometheus.io/port:   '9090'

spec:
  selector:
    app: prometheus-deployment
  type: NodePort
  ports:
    - port: 8080
      targetPort: 9090
      nodePort: 33308
...
---
apiVersion: apps/v1
kind: Deployment
metadata:
  name: prometheus-deployment
  namespace: default
spec:
  replicas: 1
  selector:
    matchLabels:
      app: prometheus-deployment
  template:
    metadata:
      labels:
        app: prometheus-deployment
    spec:
      containers:
        - name: prometheus
          image: prom/prometheus:v2.15.1
          args:
            - "--config.file=/etc/prometheus/prometheus.yml"
            - "--storage.tsdb.path=/prometheus/"
          ports:
            - containerPort: 9090
          volumeMounts:
            - name: prometheus-configmap
              mountPath: /etc/prometheus/
            - name: prometheus-storage-volume
              mountPath: /prometheus/
      volumes:
        - name: prometheus-configmap
          configMap:
            defaultMode: 420
            name: prometheus-configmap

        - name: prometheus-storage-volume
          emptyDir: {}
[root@host131 pod]#
启动Prometheus服务
[root@host131 pod]# ls
configmap.yml  deployment.yml  rbac.yml
[root@host131 pod]# kubectl create -f .
configmap/prometheus-configmap created
service/prometheus-service created
deployment.apps/prometheus-deployment created
clusterrole.rbac.authorization.k8s.io/prometheus created
clusterrolebinding.rbac.authorization.k8s.io/prometheus created
[root@host131 pod]#
结果确认
[root@host131 pod]# kubectl get pods
NAME                                     READY   STATUS    RESTARTS   AGE
prometheus-deployment-774dcd78bc-g2zjr   1/1     Running   0          29s
[root@host131 pod]# kubectl get deployments
NAME                    READY   UP-TO-DATE   AVAILABLE   AGE
prometheus-deployment   1/1     1            1           35s
[root@host131 pod]# kubectl get service
NAME                 TYPE        CLUSTER-IP       EXTERNAL-IP   PORT(S)          AGE
kubernetes           ClusterIP   10.254.0.1       <none>        443/TCP          10h
prometheus-service   NodePort    10.254.160.227   <none>        8080:33308/TCP   39s
[root@host131 pod]#
确认连接信息
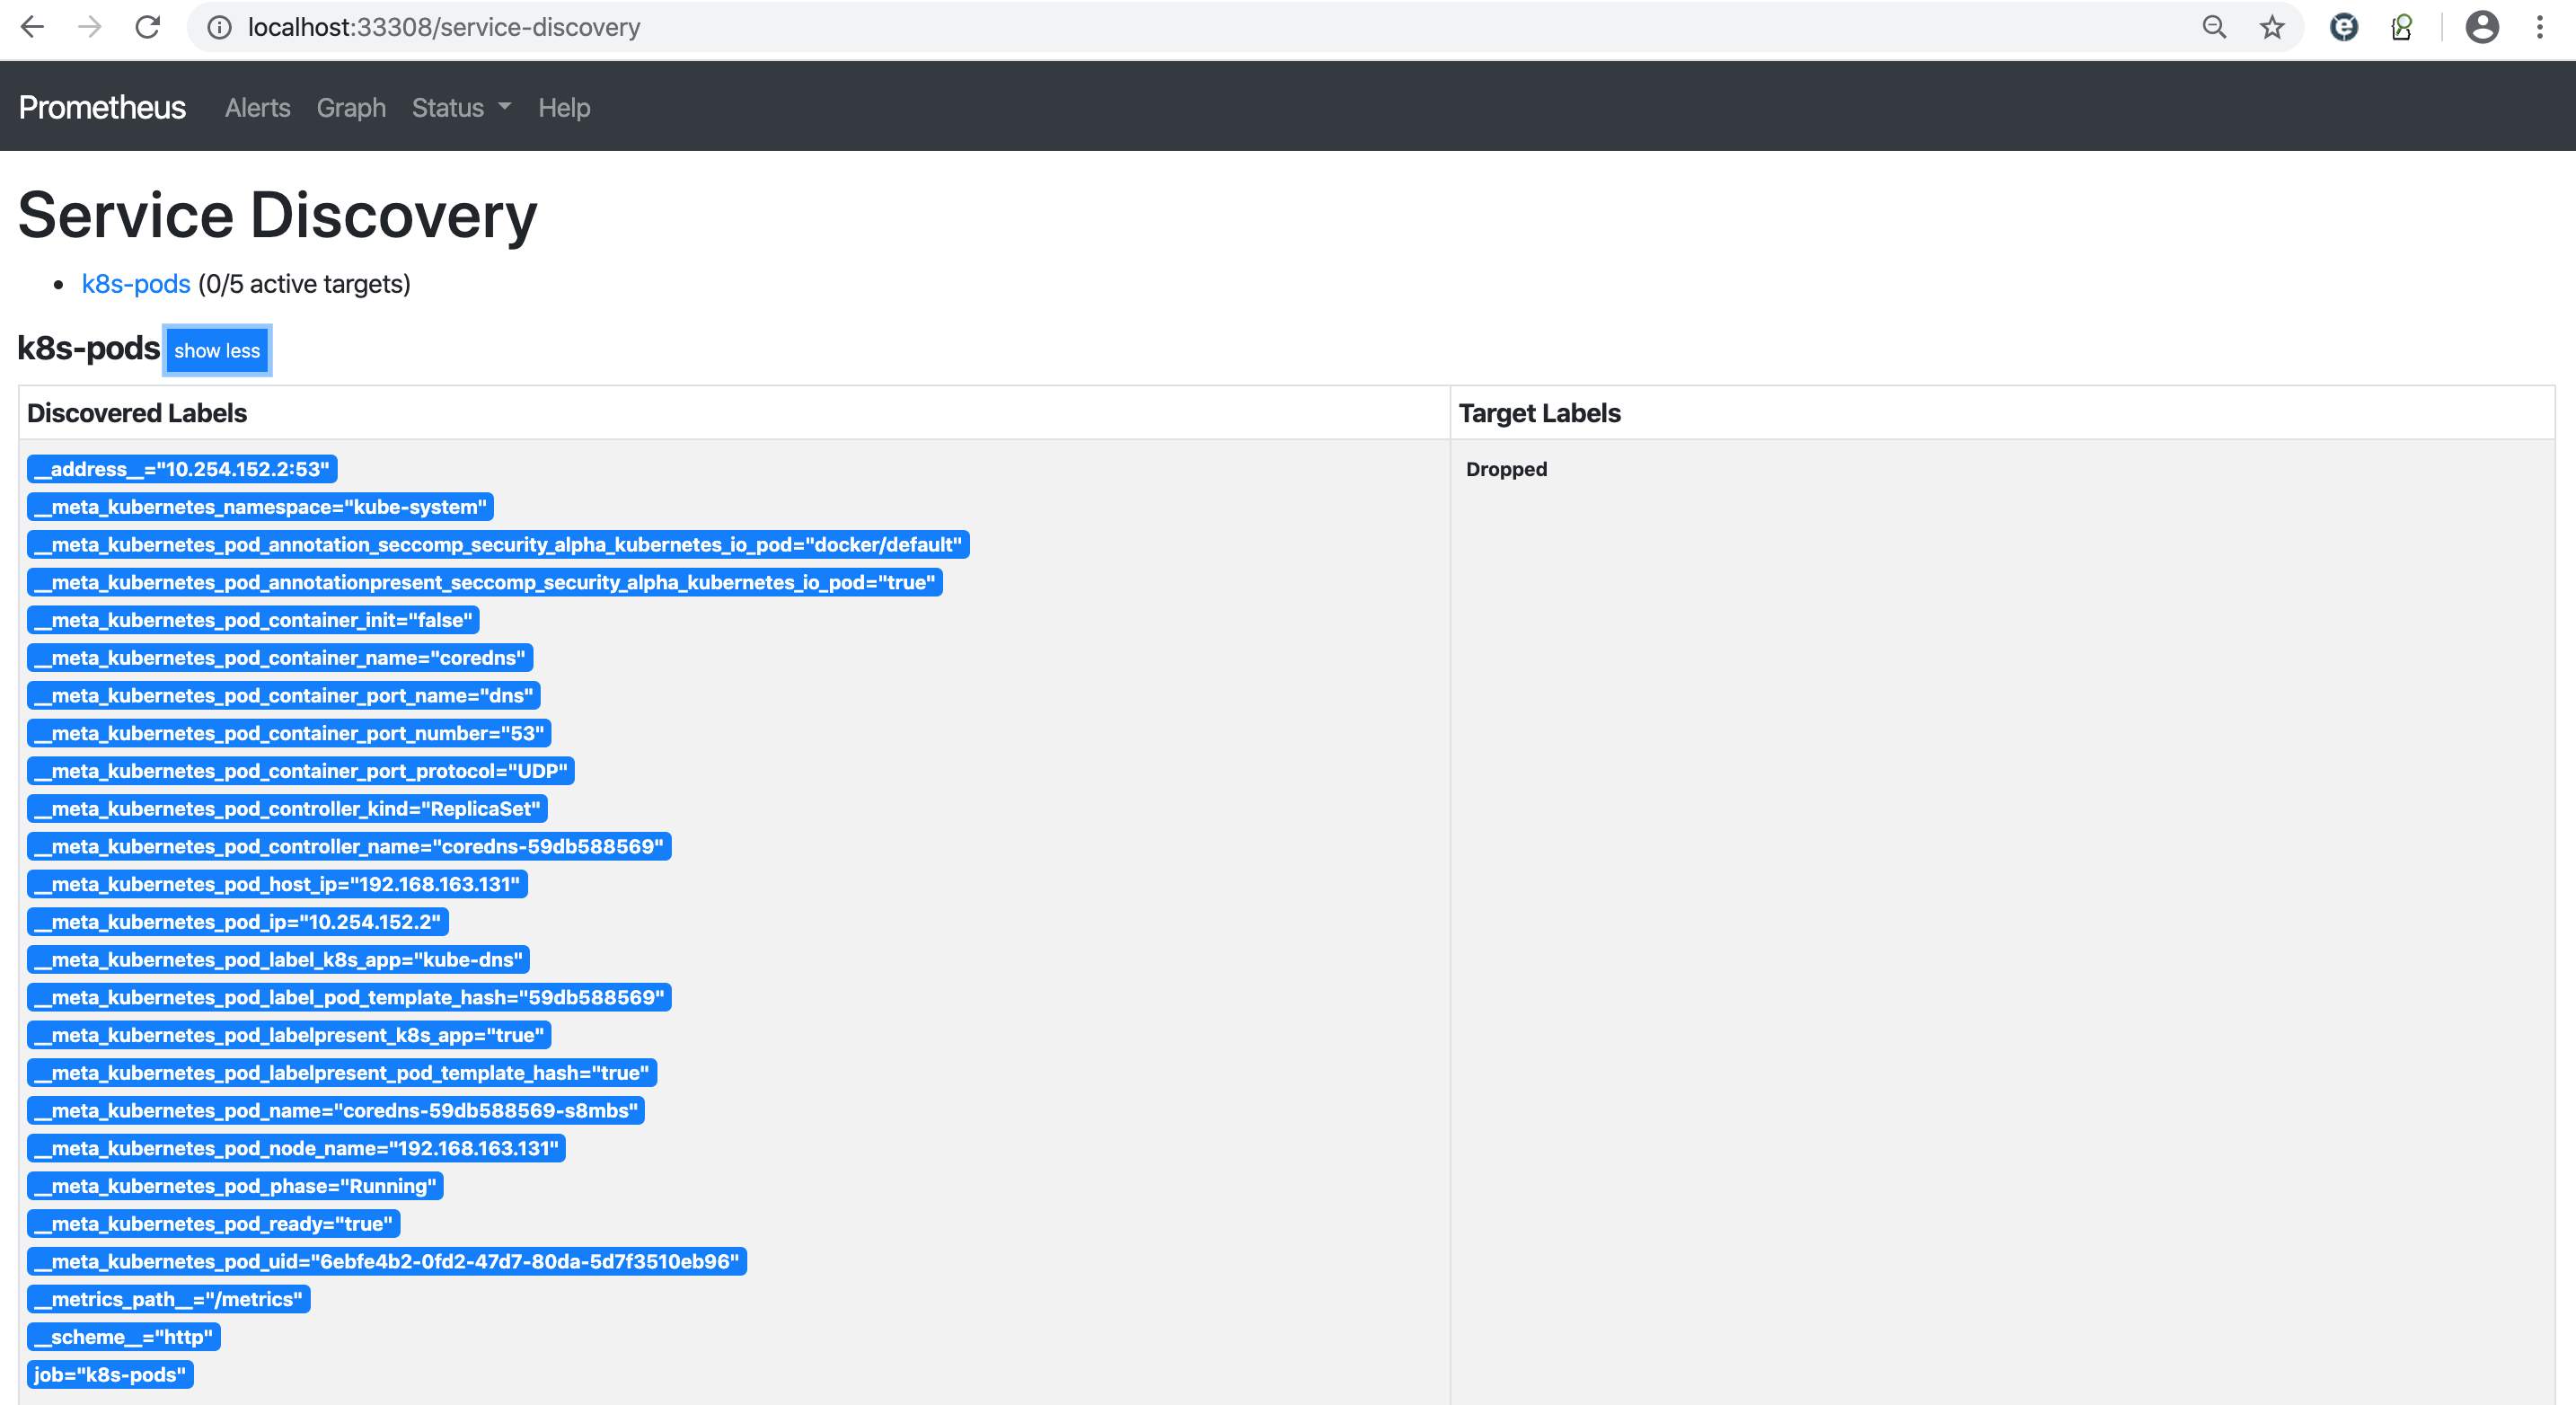
从/targets链接也可以确认连接信息,但是未获取到连接数据
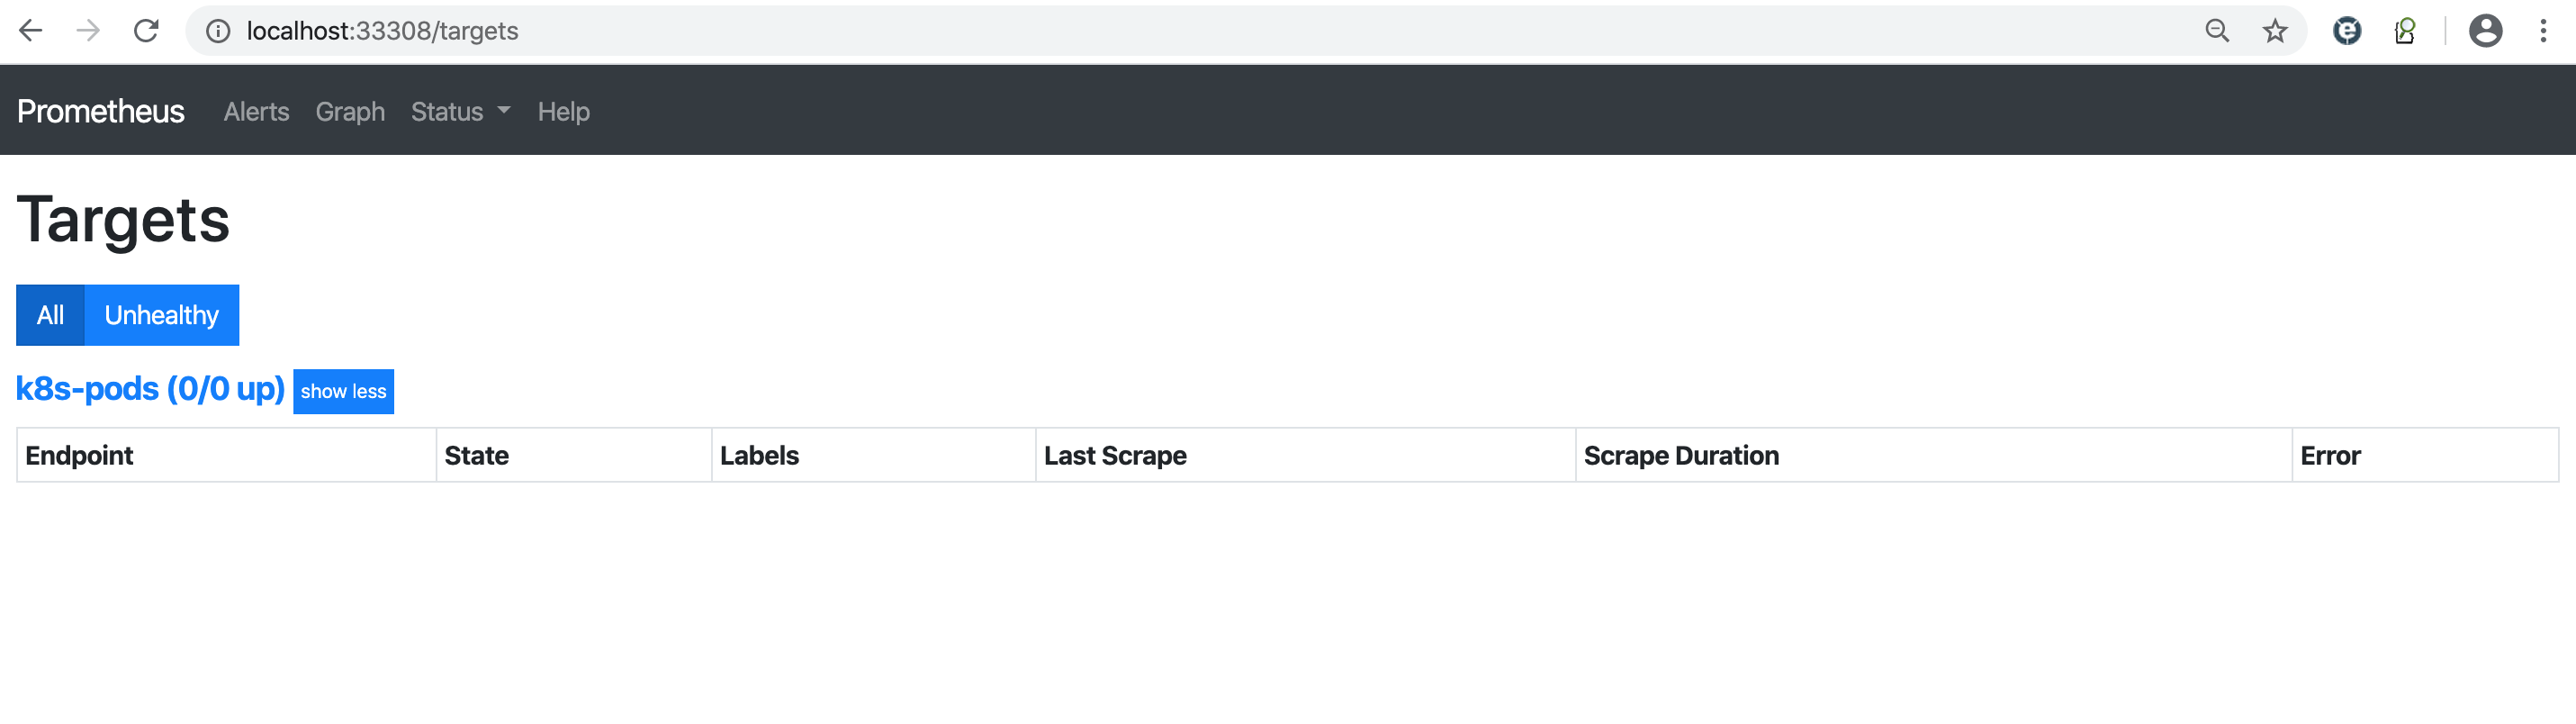
服务发现的信息似乎还有一些问题,后续再进行确认
配置文件
上述配置文件同样存放在Easypack中,URL地址链接为:
- https://github.com/liumiaocn/easypack/tree/master/monitor/prometheus/kubernetes/pod
最后
以上就是知性大白最近收集整理的关于Prometheus:监控与告警:18: 监控Kubernetes的Pod集成Api ServerKubernetes环境准备RBAC配置文件ConfigMap设定文件Deployment配置文件启动Prometheus服务结果确认确认连接信息配置文件的全部内容,更多相关Prometheus:监控与告警:18:内容请搜索靠谱客的其他文章。
本图文内容来源于网友提供,作为学习参考使用,或来自网络收集整理,版权属于原作者所有。


发表评论 取消回复