内容描述
a .在柱状图上显示文本
b.间断式显示柱状图
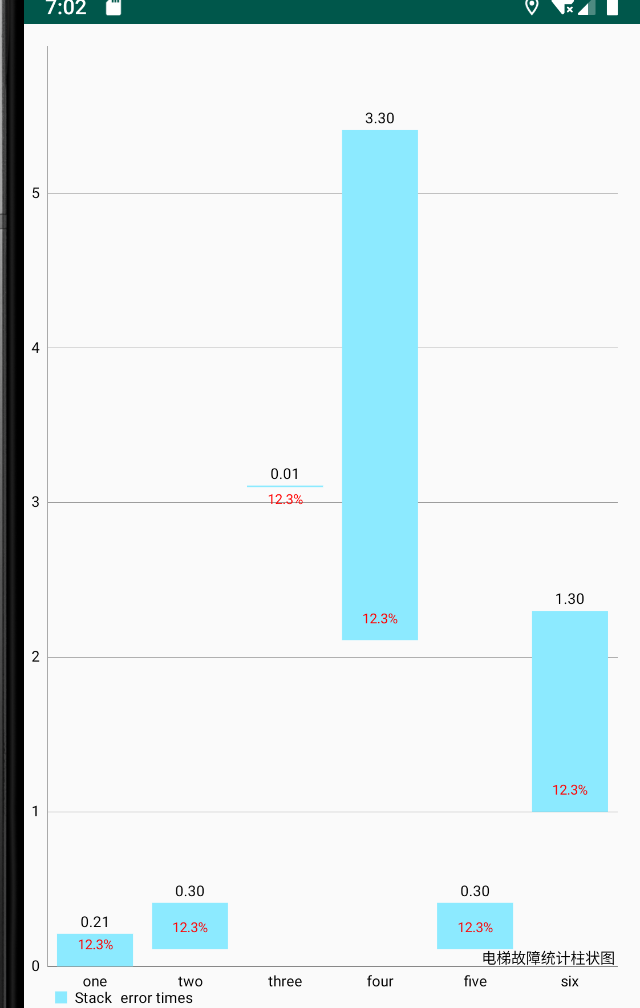
产品原型如下:
难点描述:
MPAndroidChart 并不支持将文字描述信息展示到柱状图(条形图)上;而且也不支持不从0开始的柱状节点展示。
期望目标:
代码实现
注意本代码的实现,只针对柱状图(BarChart)
绘制间断柱状图
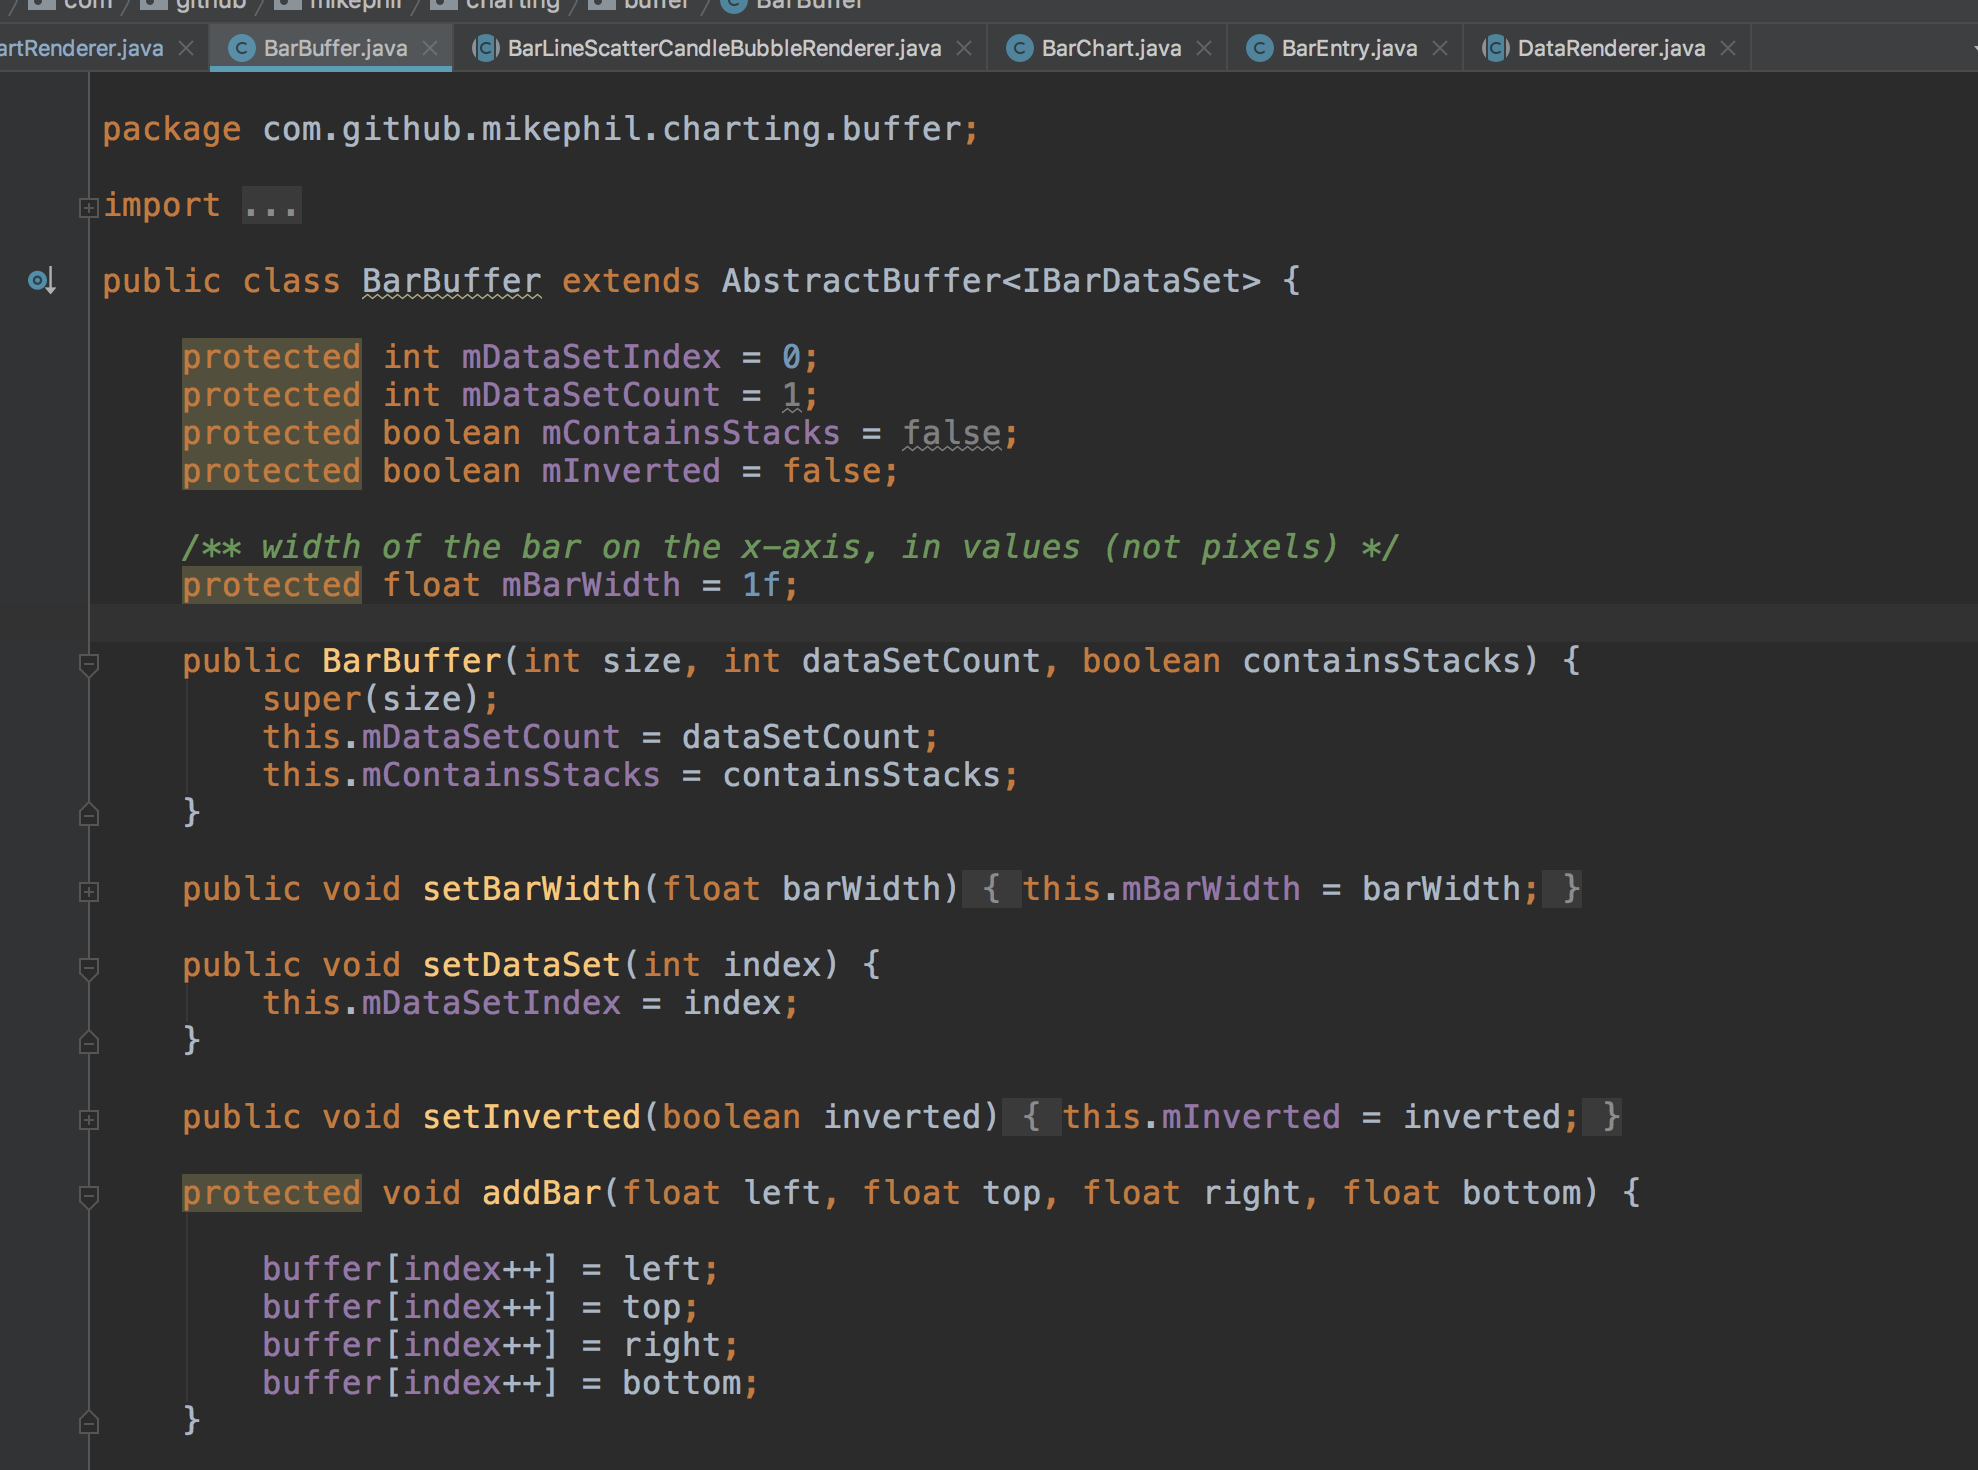
柱状图的区域描述是通过Barbuffer对象中的buffer数组中的四个元素描述四个坐标(left,top,right,bottom)。
在MPAndroidChart中,设置BarChartEntry的时候,每一个float值都对应者一个柱状图区域,也就是转化一个连续的buffer数组元素(如下图所示)。现在要想描述间断是柱状图,需要两个float值(start,detaY)。因此需要改变其对应的数组元素映射feed(IBarDataSet data)。
 @Override
    public void feed(IBarDataSet data) {

        float size = data.getEntryCount() * phaseX;
        float barWidthHalf = mBarWidth / 2f;

        for (int i = 0; i < size; i++) {

            BarEntry e = data.getEntryForIndex(i);

            if(e == null)
                continue;

            float x = e.getX();
            float y = e.getY();
            float[] vals = e.getYVals();

            if (!mContainsStacks || vals == null) {
            	...
            } else {

                float posY = 0f;
                float negY = -e.getNegativeSum();
                float yStart = 0f;
                if(e.isPresentOneData()){
                    checkData(vals);
                }

                // fill the stack
                for (int k = 0; k < vals.length; k++) {

                    float value = vals[k];

                    if (value == 0.0f && (posY == 0.0f || negY == 0.0f)) {
                        // Take care of the situation of a 0.0 value, which overlaps a non-zero bar
                        y = value;
                        yStart = y;
                    } else if (value >= 0.0f) {
                        y = posY;
                        yStart = posY + value;
                        posY = yStart;
                    } else {
                        y = negY;
                        yStart = negY + Math.abs(value);
                        negY += Math.abs(value);
                    }

                    float left = x - barWidthHalf;
                    float right = x + barWidthHalf;
                    float bottom, top;

                    if (mInverted) {
                        bottom = y >= yStart ? y : yStart;
                        top = y <= yStart ? y : yStart;
                    } else {
                        top = y >= yStart ? y : yStart;
                        bottom = y <= yStart ? y : yStart;
                    }

                    // multiply the height of the rect with the phase
                    top *= phaseY;
                    bottom *= phaseY;
					//两个float元素对应一个 bar区域
                    if(k==0&&e.isPresentOneData()){

                    }else{
                        addBar(left, top, right, bottom);
                    }
                }
            }
        }

        reset();
    }
绘制文字描述信息
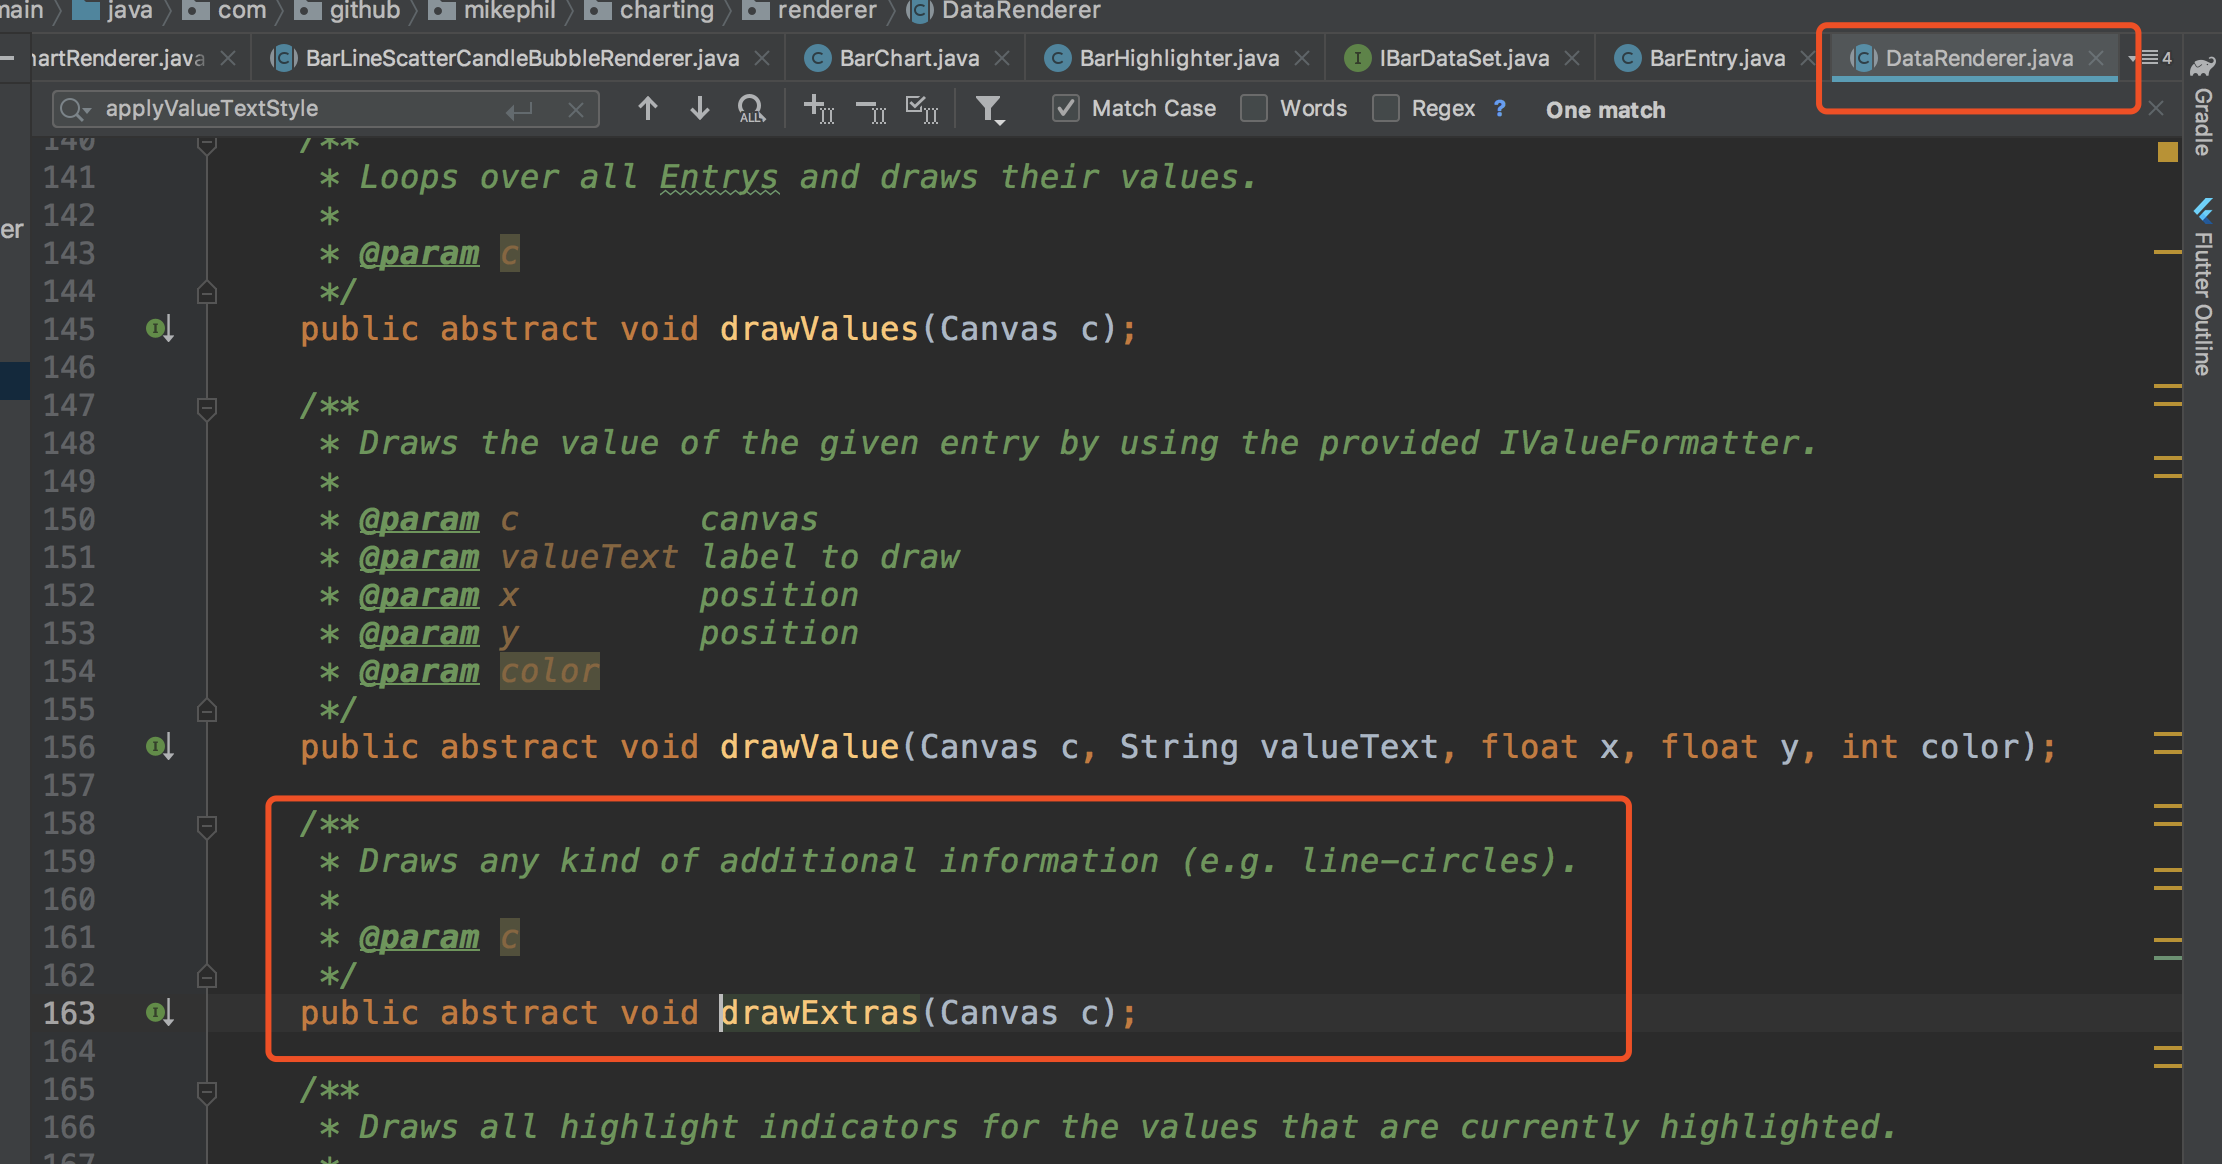
优秀的MPAndroidChart设计的很友好。在DataRenderer接口中预留了一个drawExtras(Canvas c)接口,可以让开发者自定义内容。 而在柱状图上显示文本,就是在该方法中实现业务逻辑。
参考这现有的DrawValue方法,写一个描述信息的功能
 @Override
    public void drawExtras(Canvas c) {
        // if values are drawn
        List<IBarDataSet> dataSets = mChart.getBarData().getDataSets();

        final float valueOffsetPlus = Utils.convertDpToPixel(4.5f);
        float posOffset = 0f;

        for (int i = 0; i < mChart.getBarData().getDataSetCount(); i++) {

            IBarDataSet dataSet = dataSets.get(i);

            if (!dataSet.isDrawDesEnabled())
                continue;

            // apply the text-styling defined by the DataSet
            applyDesTextStyle(dataSet);

            // calculate the correct offset depending on the draw position of
            // the value
            float valueTextHeight = Utils.calcTextHeight(mDesPaint, "8");
            posOffset = valueTextHeight + valueOffsetPlus;


            // get the buffer
            BarBuffer buffer = mBarBuffers[i];

            MPPointF iconsOffset = MPPointF.getInstance(dataSet.getIconsOffset());
            iconsOffset.x = Utils.convertDpToPixel(iconsOffset.x);
            iconsOffset.y = Utils.convertDpToPixel(iconsOffset.y);


            int bufferIndex = 0;
            int index = 0;

            while (index < dataSet.getEntryCount() * mAnimator.getPhaseX()) {

                BarEntry entry = dataSet.getEntryForIndex(index);

                float[] vals = entry.getYVals();
                float x = (buffer.buffer[bufferIndex] + buffer.buffer[bufferIndex + 2]) / 2f;

                int color = dataSet.getDesTextColor(index);

                if (!mViewPortHandler.isInBoundsRight(x))
                    break;

                if (!mViewPortHandler.isInBoundsY(buffer.buffer[bufferIndex + 3])
                        || !mViewPortHandler.isInBoundsLeft(x))
                    continue;
                //核心代码 如果开始描述文字的功能,则渲染文字
                if (dataSet.isDrawDesEnabled()) {
                    //检查空间
                    if(buffer.buffer[bufferIndex+3]-buffer.buffer[bufferIndex+1]>4+posOffset){
                        drawDes(c, entry.getDes(), x, buffer.buffer[bufferIndex + 3] - posOffset,
                                color);
                    }else {
                        drawDes(c, entry.getDes(), x, buffer.buffer[bufferIndex + 3] +
                                        posOffset,
                                color);
                    }

                }

                // draw stack values
                bufferIndex = vals == null ? bufferIndex + 4 : bufferIndex + 4 * (entry.isPresentOneData()?1:vals.length);
                index++;
            }

            MPPointF.recycleInstance(iconsOffset);
        }
    }
处理触摸事件
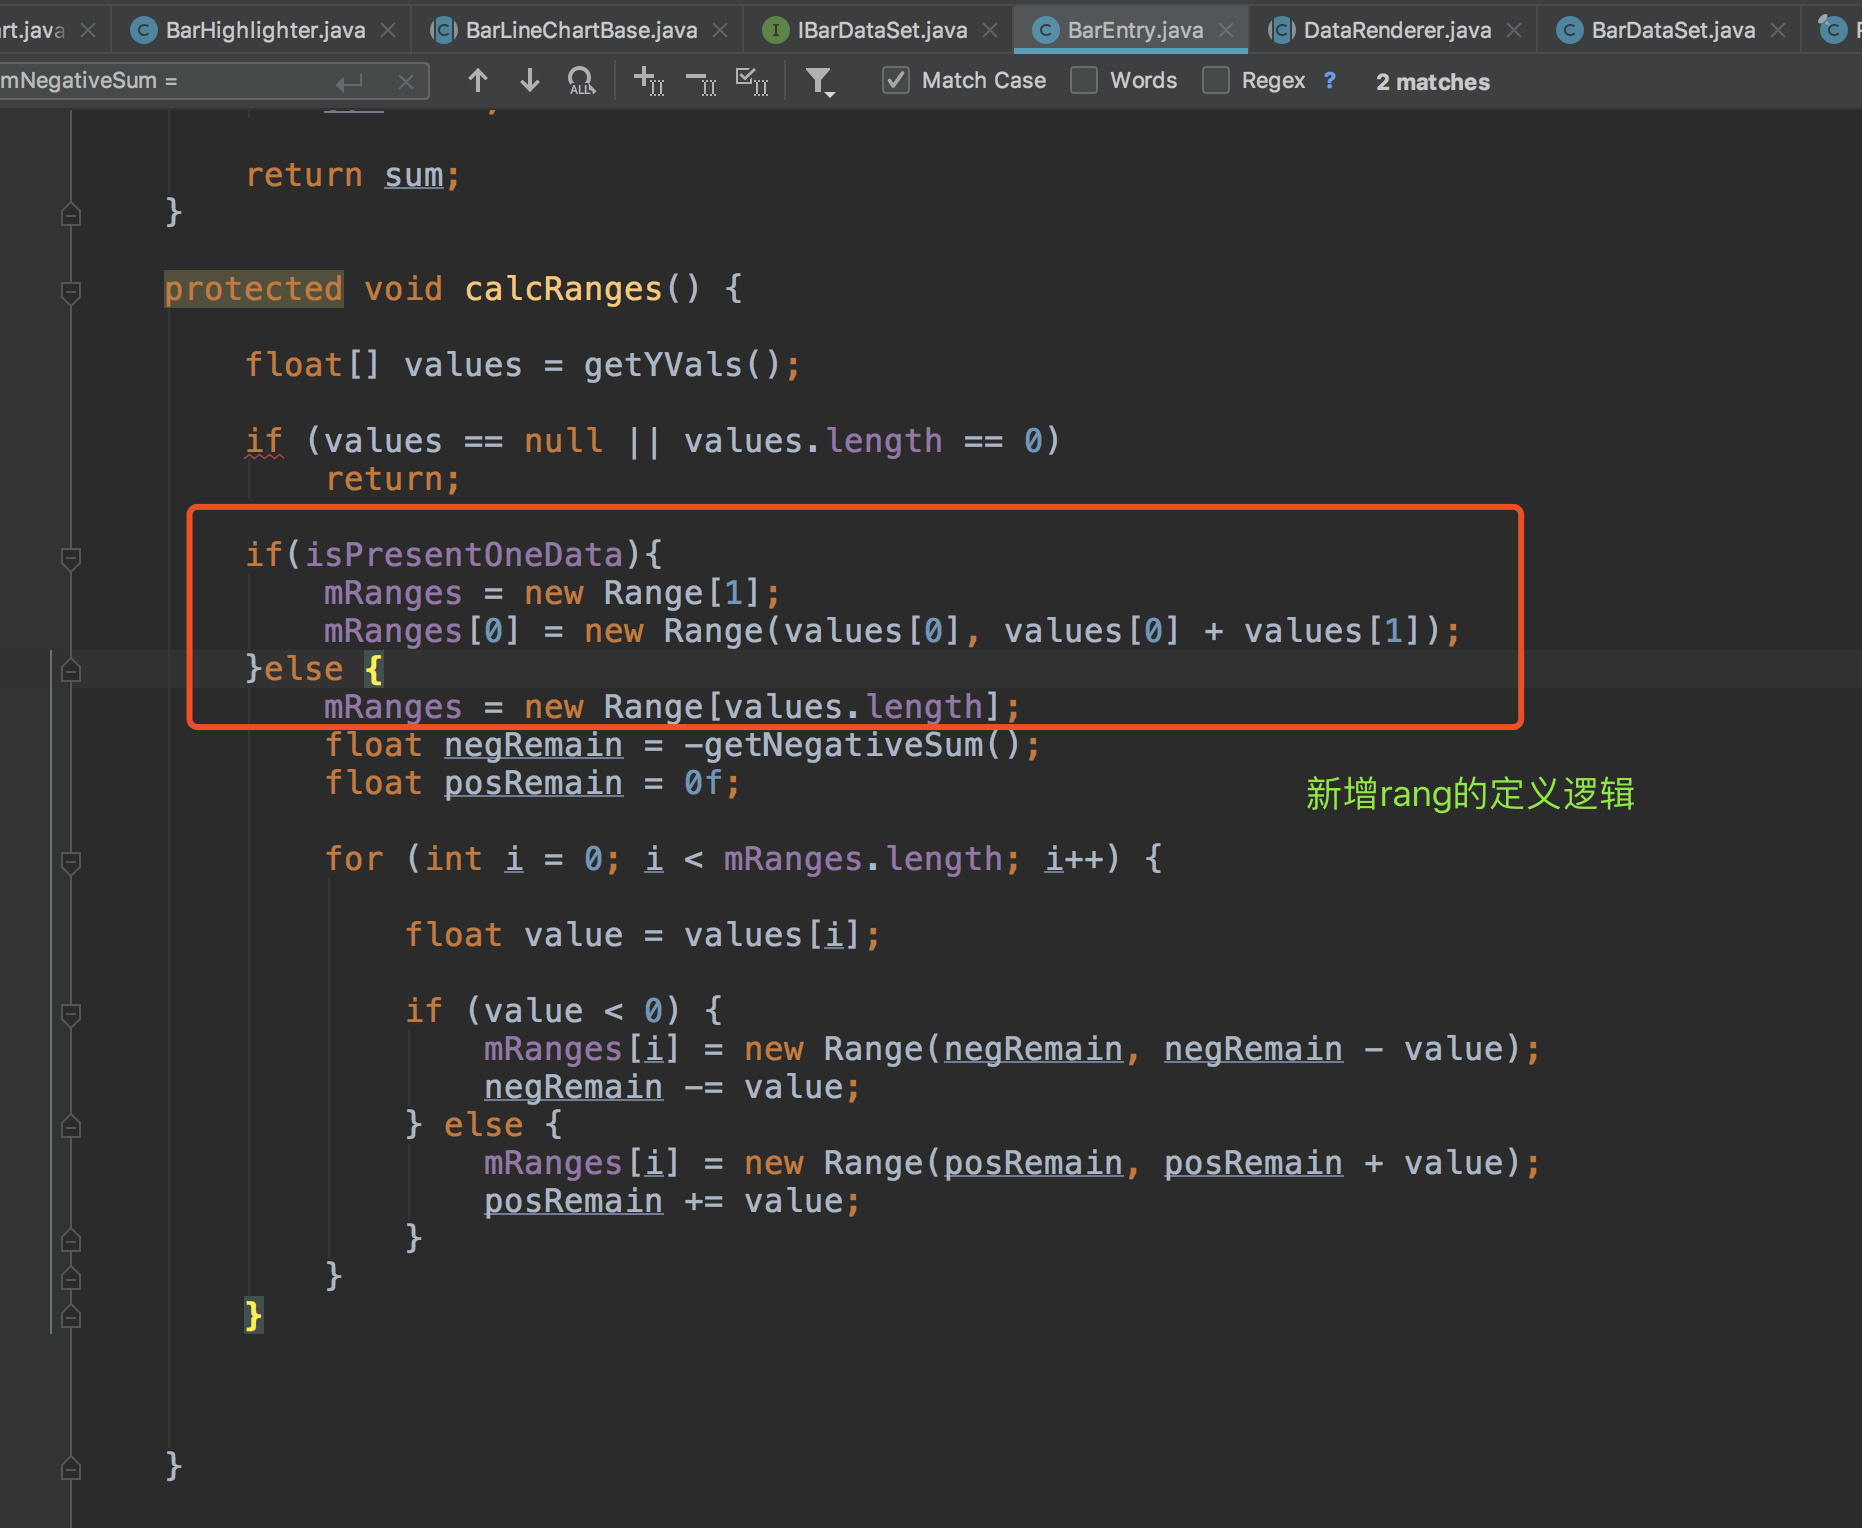
在MPAndroidChart中,onTouch事件最终会作用到Range对象中。而且在定义BarChartEntry时,如果传入了Float[]数组,那么每个元素都会转化为一个Range对象。但是但进行间断是表示数据时,则需要两个float来描述一个range对象。具体修改如下所示:
使用
//a.设置BarEntry的步骤
ArrayList<BarEntry> barEntries = new ArrayList<>();
        //1.链式调用
        //1.1 注意,在new float[]{ 0, 0.21111f }数组中,第一个元素代表柱状图的起始位置;
        //第二个元素代码柱状图的高度值
        barEntries.add(new BarEntry(1, new float[]{ 0, 0.21111f })
        //2.设置是否是float[2] 展示一个数据
                .setPresentOneData(true)
      	//3. 设置文本描述信息
                .setmDes("12.3%"));
        barEntries.add(new BarEntry(2,new float[]{0.11111f,0.3f})
                .setPresentOneData(true)
                .setmDes("12.3%"));
       	...
       	...
        barEntries.add(new BarEntry(6, new float[]{1,1.3f})
                .setPresentOneData(true)
                .setmDes("12.3%"));
//b.设置BarDataSet的步骤
        BarDataSet barDataSet = new BarDataSet(barEntries, "error times").setDrawDesEnable(true);
        //设置描述字体的颜色
        barDataSet.setmDesColor(Color.RED);
代码传送门
最后
以上就是忧伤滑板最近收集整理的关于MPAndroidchart自定义样式二在柱状图上显示文本和间断式显示柱状图的全部内容,更多相关MPAndroidchart自定义样式二在柱状图上显示文本和间断式显示柱状图内容请搜索靠谱客的其他文章。


发表评论 取消回复