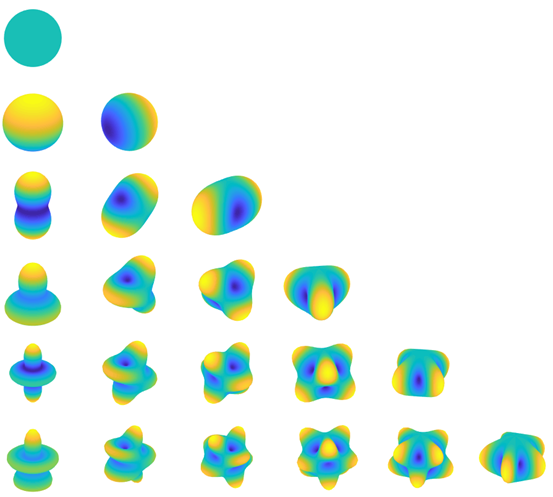
先上效果图。从上到下依次为n=0:5, 从左到右依次为m=0:5, n代表阶,m代表级。

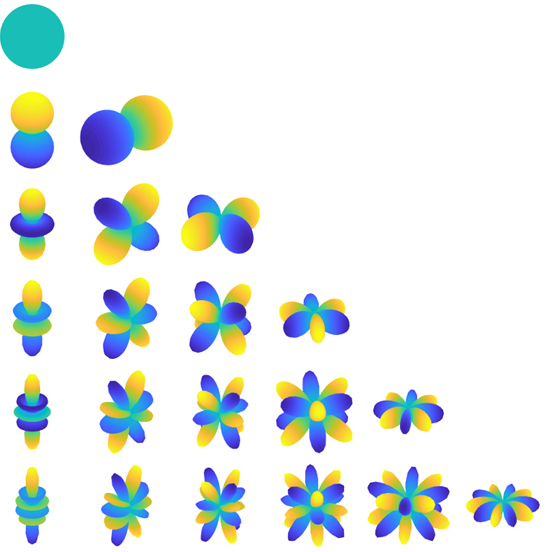
上图的颜色代表的就是球谐函数的取值(后续我会把解析公式放上来),但是半径却是加工过的(具体参考下面的代码)。如果把半径设为球谐函数的绝对值,如下图所示

不再过多解释,下面给出matlab制图代码
% 绘制球谐函数图像
% degree, Ynm的n, 阶
% order,  Ynm的m, 级
% method, 绘图的R
%% 示例 - 绘制球谐函数表
% maxD = 3; % 最高阶数
% for n = 0:maxD
%     for m = 0:n
%         subplot(maxD+1,maxD+1,n*(maxD+1)+m+1)
%         plot_sph_harm(n,m,2);
%     end
% end
function plot_sph_harm(degree,order,method)
    %% 坐标
    theta = 0:pi/30:pi;                   % polar angle
    phi = 0:pi/30:2*pi;                   % azimuth angle
    [phi,theta] = meshgrid(phi,theta);    % define the grid

    %% 计算球谐函数
    Ln = legendre(degree,cos(theta(:,1)),'norm');     % 一行对应一个order
    yy = repmat(Ln(order+1,:)',[1,size(theta,2)]); % Ln(i+1,:)对应order=i
    Ynm = yy.*cos(order*phi);                % 球谐函数, 相当于绘图的color

    %% R的选择
    if nargin < 3, method = 1; end
    switch method
        case 1
            R = ones(size(phi));      % 绘制在单位球上
        case 2
            R = abs(Ynm) + 0.2;       % 与color一致
        case 3
            R = Ynm*0.4 + 1;          % 看上去像单位球发生了形变
        case 4
            % 来自Help文档'Animating a Surface'
            R = 5 + 0.5*Ynm/max(max(abs(Ynm)));
            % radius = 5; amplitude = 0.5;
        otherwise
            error('[ERROR] -- 没有该方案,请检查 methodn')
    end

    %% 转化为直角坐标
    Rxy = R.*sin(theta);    % convert to Cartesian coordinates
    x = Rxy.*cos(phi);
    y = Rxy.*sin(phi);
    z = R.*cos(theta);

    %% 绘图方案1 (注:将坐标调稠密一些更好看)
    surf(x,y,z,Ynm,'edgecolor','none','facecolor','interp');
    axis equal off     % set axis equal and remove axis
    colormap parula;
    material shiny;
    camzoom(1.5)        % zoom into scene
    %% 绘图方案2 (注:将坐标调稀疏一些更好看)
%     surf(x,y,z,Ynm);
%     light               % add a light
%     lighting gouraud    % preferred lighting for a curved surface
%     axis equal off      % set axis equal and remove axis
%     view(40,30)         % set viewpoint
%     camzoom(1.5)        % zoom into scene

end
最后
以上就是贤惠心情最近收集整理的关于任意阶球谐函数可视化的全部内容,更多相关任意阶球谐函数可视化内容请搜索靠谱客的其他文章。
本图文内容来源于网友提供,作为学习参考使用,或来自网络收集整理,版权属于原作者所有。


发表评论 取消回复