参考https://www.jianshu.com/p/1c716e81fb54
利用ggplot2绘制折线图(均值+误差棒)
代码如下(有网格线和背景版)
library(ggplot2)
library(Rmisc)
library(cowplot)
P1 <- ggplot(a1, aes(x=Days, y=Value, colour=Pear)) +
  geom_errorbar(aes(ymin=Value-se, ymax=Value+se), width=.1) +
  geom_line() +
  geom_point()+
  theme_bw()

P2 <- ggplot(a2, aes(x=Days, y=Value, colour=Pear)) +
  geom_errorbar(aes(ymin=Value-se, ymax=Value+se), width=.1) +
  geom_line() +
  geom_point()+
  theme_bw()

P3 <- ggplot(a3, aes(x=Days, y=Value, colour=Pear)) +
  geom_errorbar(aes(ymin=Value-se, ymax=Value+se), width=.1) +
  geom_line() +
  geom_point()+
  theme_bw()

P4 <- ggplot(a4, aes(x=Days, y=Value, colour=Pear)) +
  geom_errorbar(aes(ymin=Value-se, ymax=Value+se), width=.1) +
  geom_line() +
  geom_point()+
  theme_bw()
plot_grid(P1,P2,P3, P4,nrow = 1, align = c("v", "h"))

P4 <- P1+
  coord_cartesian(ylim = c(0, 20))+
  labs(x= 'Days after storage (d)', y = 'SSC/%')+
  facet_grid(.~Pear)+
  theme_bw()

P5 <- P2+
  coord_cartesian(ylim = c(0, 20))+
  labs(x= 'Days after storage (d)', y = 'Fructose (mg/L)')+
  facet_grid(.~Pear)+
  theme_bw()

P6 <- P3+
  coord_cartesian(ylim = c(0, 20))+
  labs(x= 'Days after storage (d)', y = 'Glucose (mg/L)')+
  facet_grid(.~Pear)+
  theme_bw()

P7 <- P4+
  coord_cartesian(ylim = c(0, 20))+
  labs(x= 'Days after storage (d)', y = 'Sucrose (mg/L)')+
  facet_grid(.~Pear)+
  theme_bw()

plot_grid(P4,P5,P6,P7, ncol = 1, labels = LETTERS[1:3], align = c("v", "h"))
在这里插入代码片
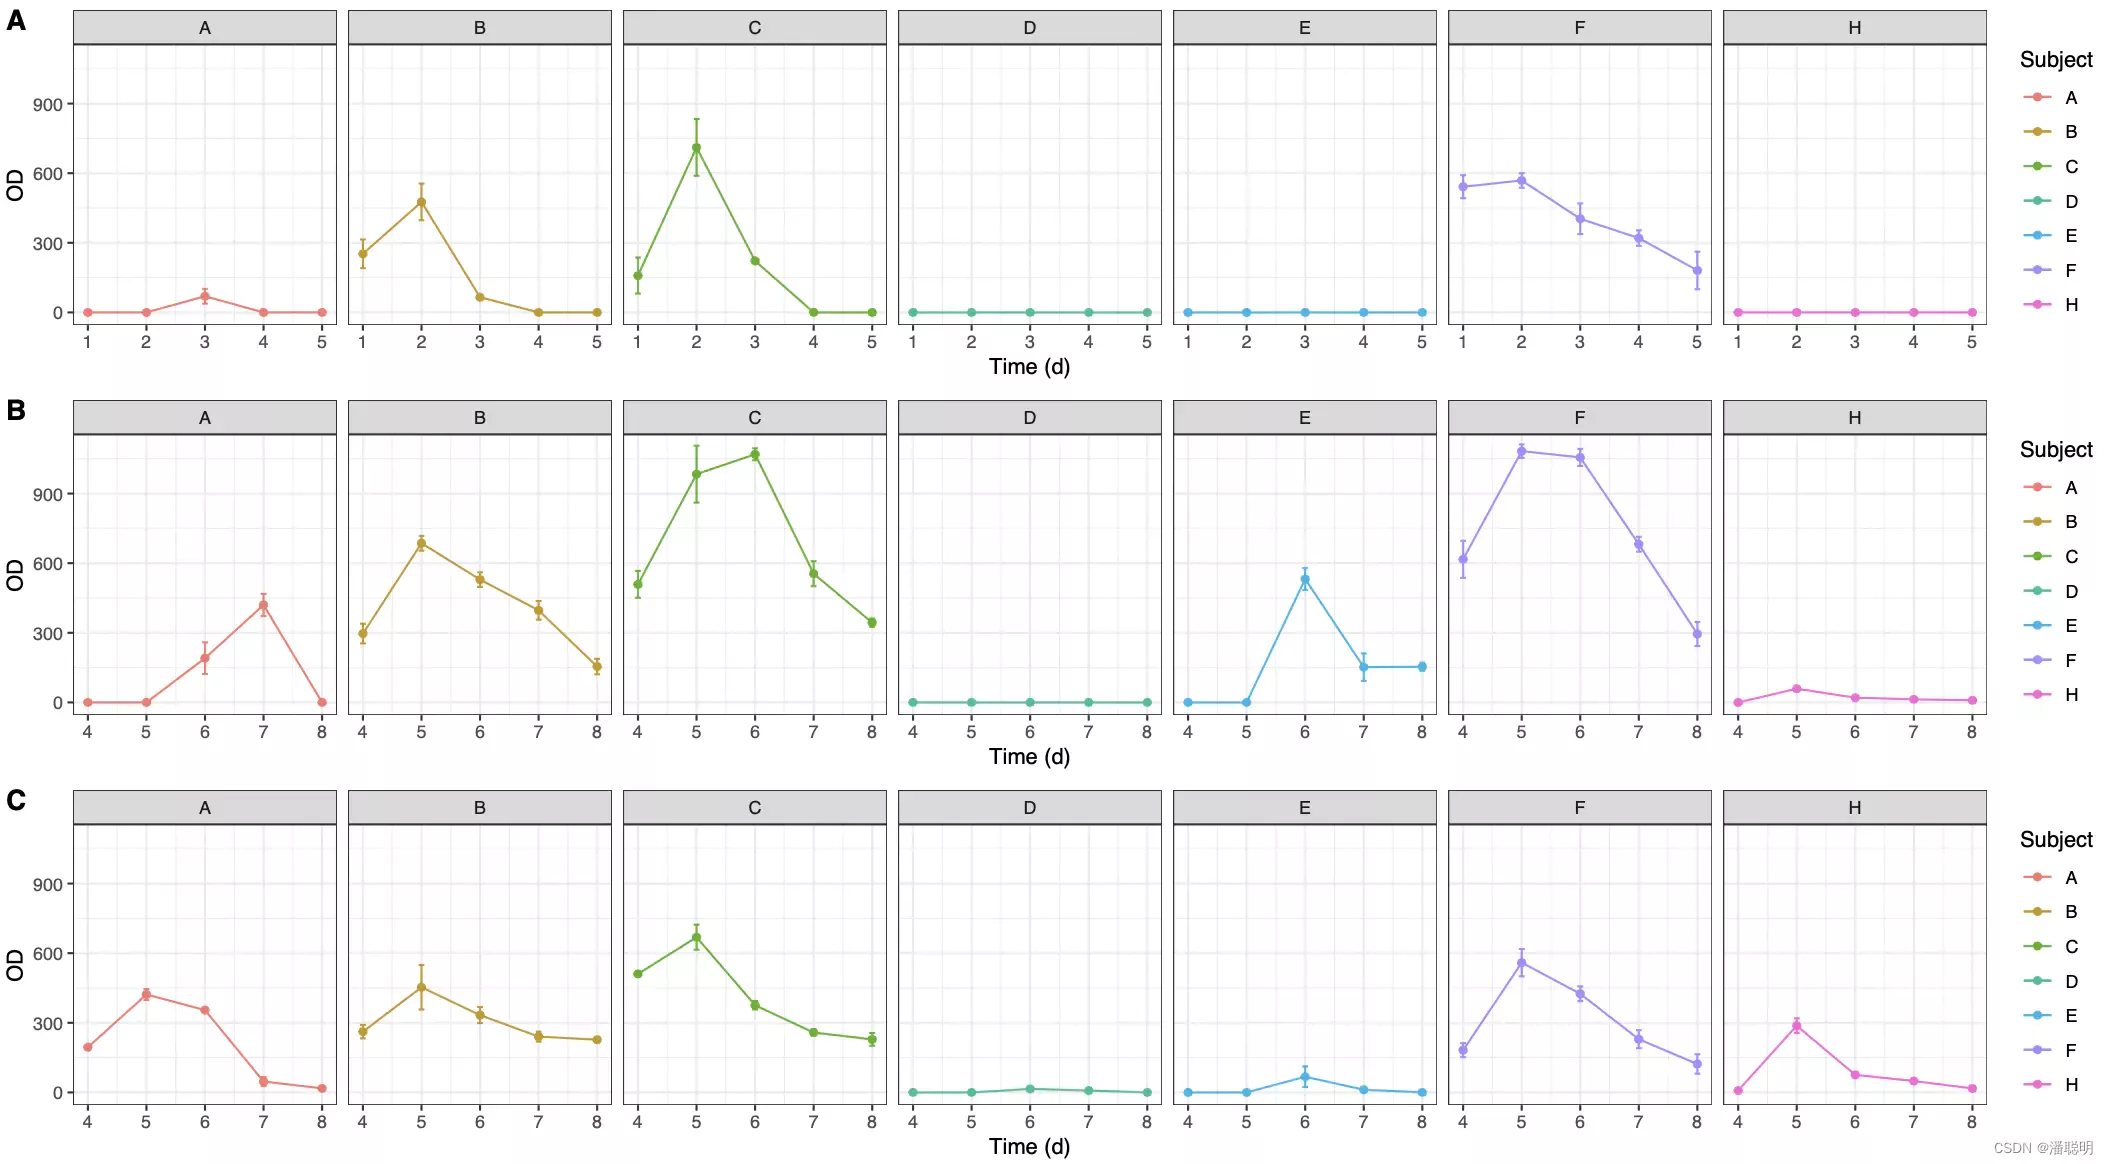
结果图如下,感觉挺好看,比matlab画出来真实多了

无网格线和背景版
library(ggplot2)
library(Rmisc)
library(cowplot)
P1 <- ggplot(a1, aes(x=Days, y=Value, colour=Pear)) +
  geom_errorbar(aes(ymin=Value-se, ymax=Value+se), width=.1) +
  geom_line() +
  geom_point()+
  theme_bw()

P2 <- ggplot(a2, aes(x=Days, y=Value, colour=Pear)) +
  geom_errorbar(aes(ymin=Value-se, ymax=Value+se), width=.1) +
  geom_line() +
  geom_point()+
  theme_bw()

P3 <- ggplot(a3, aes(x=Days, y=Value, colour=Pear)) +
  geom_errorbar(aes(ymin=Value-se, ymax=Value+se), width=.1) +
  geom_line() +
  geom_point()+
  theme_bw()

P4 <- ggplot(a4, aes(x=Days, y=Value, colour=Pear)) +
  geom_errorbar(aes(ymin=Value-se, ymax=Value+se), width=.1) +
  geom_line() +
  geom_point()+
  theme_bw()
plot_grid(P1,P2,P3, P4,nrow = 1, align = c("v", "h"))

P5 <- P1+
  coord_cartesian(ylim = c(7.5, 14.8))+
  labs(x= 'Days after storage (d)', y = 'SSC/%')+
  facet_grid(.~Pear)+
  theme_bw()+ theme(panel.grid=element_blank())

P6 <- P2+
  coord_cartesian(ylim = c(2, 16))+
  labs(x= 'Days after storage (d)', y = 'Fructose (mg/L)')+
  facet_grid(.~Pear)+
  theme_bw()+ theme(panel.grid=element_blank())

P7 <- P3+
  coord_cartesian(ylim = c(2, 14))+
  labs(x= 'Days after storage (d)', y = 'Glucose (mg/L)')+
  facet_grid(.~Pear)+
  theme_bw()+ theme(panel.grid=element_blank())

P8 <- P4+
  coord_cartesian(ylim = c(0, 0.45))+
  labs(x= 'Days after storage (d)', y = 'Sucrose (mg/L)')+
  facet_grid(.~Pear)+
  theme_bw()+ theme(panel.grid=element_blank())

plot_grid(P5,P6,P7,P8, ncol = 1, align = c("v", "h"))在这里插入代码片
x轴为log10, y轴标签为斜体版
> P1 <- ggplot(a1, aes(x=Frequency, y=changshu, colour=Variety)) +scale_x_log10()+geom_line() +geom_point()+theme_bw()
> P2 <- ggplot(a2, aes(x=Frequency, y=sunhao, colour=Variety)) +scale_x_log10()+geom_line() +geom_point()+theme_bw()
> P3 <- ggplot(a3, aes(x=Frequency, y=pulpchangshu, colour=Variety)) +scale_x_log10()+geom_line() +geom_point()+theme_bw()
> P4 <- ggplot(a4, aes(x=Frequency, y=pulpsunhao, colour=Variety)) +scale_x_log10()+geom_line() +geom_point()+theme_bw()
> plot_grid(P1,P2,P3, P4,nrow = 1, align = c("v", "h"))
> P5 <- P1+coord_cartesian(ylim = c(20, 70))+labs(x= 'Frequency (MHz)', y = 'ε′',font=3)+ facet_grid(.~Variety)+ theme_bw()+ theme(panel.grid=element_blank())
> P6 <- P2+coord_cartesian(ylim = c(2, 25))+labs(x= 'Frequency (MHz)', y = 'ε"',font=3)+ facet_grid(.~Variety)+ theme_bw()+ theme(panel.grid=element_blank())
> P7 <- P3+coord_cartesian(ylim = c(60, 90))+labs(x= 'Frequency (MHz)', y = 'ε′',font=3)+ facet_grid(.~Variety)+ theme_bw()+ theme(panel.grid=element_blank())
> P8 <- P4+coord_cartesian(ylim = c(0, 210))+labs(x= 'Frequency (MHz)', y = 'ε"',font=3)+ facet_grid(.~Variety)+ theme_bw()+ theme(panel.grid=element_blank())
> plot_grid(P5,P6,P7,P8, ncol = 1,labels = LETTERS[1:4], align = c("v", "h"))
导出为PDF格式的比较清晰,且图片不会被压缩变形。可以先生成PDF,PDF大小为A4,orientation为Portrait,利用Photoshop打开,导出为PNG格式,再插入到word中,图片不会失真。
最后
以上就是高贵白开水最近收集整理的关于ggplot2画组图的全部内容,更多相关ggplot2画组图内容请搜索靠谱客的其他文章。
本图文内容来源于网友提供,作为学习参考使用,或来自网络收集整理,版权属于原作者所有。


发表评论 取消回复