文章目录
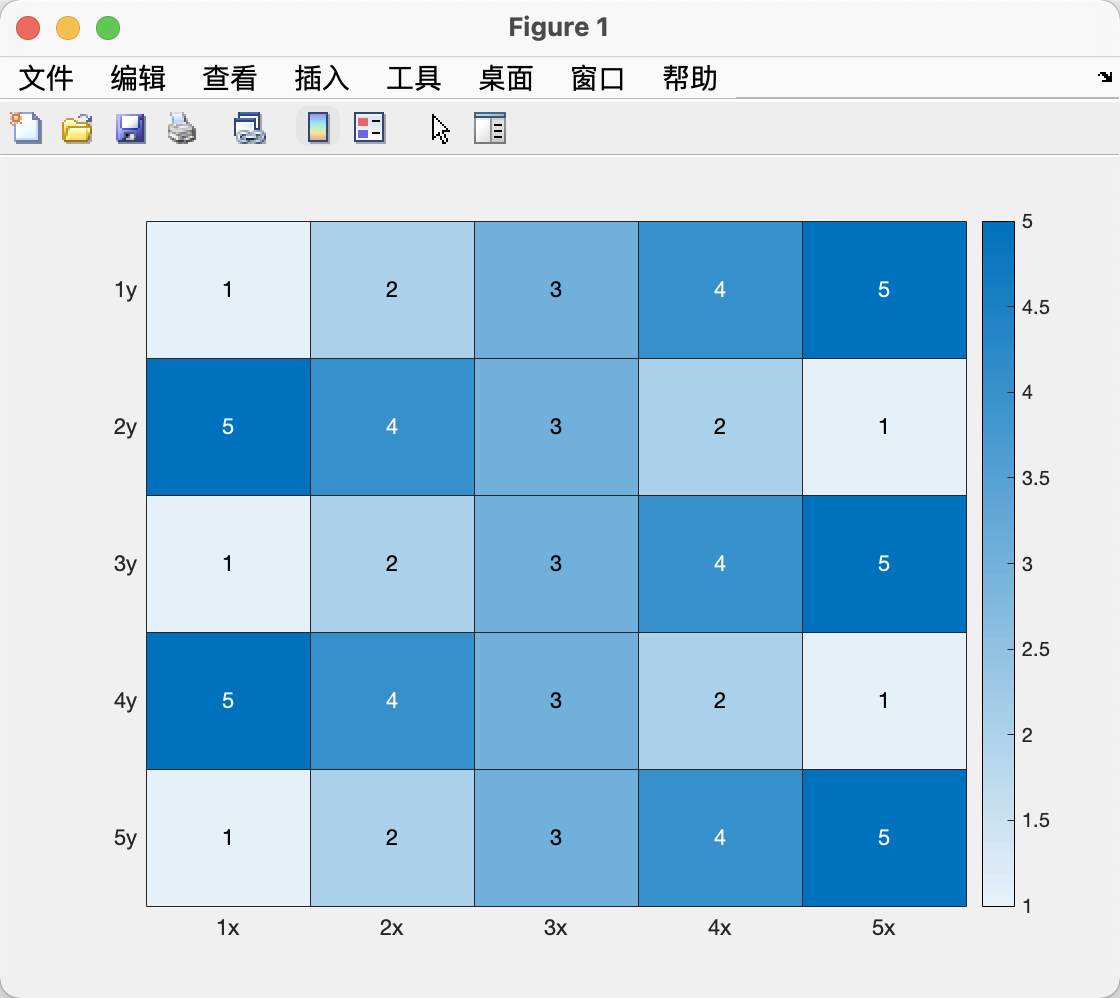
cdata = [1 2 3 4 5; 5 4 3 2 1; 1 2 3 4 5; 5 4 3 2 1; 1 2 3 4 5];
xvalues = {'1x', '2x', '3x', '4x', '5x'};
yvalues = {'1y', '2y', '3y', '4y', '5y'};
h = heatmap(xvalues, yvalues, cdata);
clc;clear;close all;
% 定义点(x,y,z)
x			= randn(50,1);
xmax 	= max(x);
xmin 	= min(x);
y			= randn(50,1);
ymax 	= max(y);
ymin 	= min(y);
z = exp(sin(x.^2)) + exp(cos(y.^2));
N = 500; % 每个维度的数据点数
% 网格化x,y二维空间
[X,Y] = meshgrid(linspace(xmin,xmax,N),linspace(ymin,ymax,N));
% 采用插值法扩展数据,可用方法有'linear'(default)|'nearest'|'natural'|'cubic'|'v4'|
Z = griddata(x,y,z,X,Y,'v4');

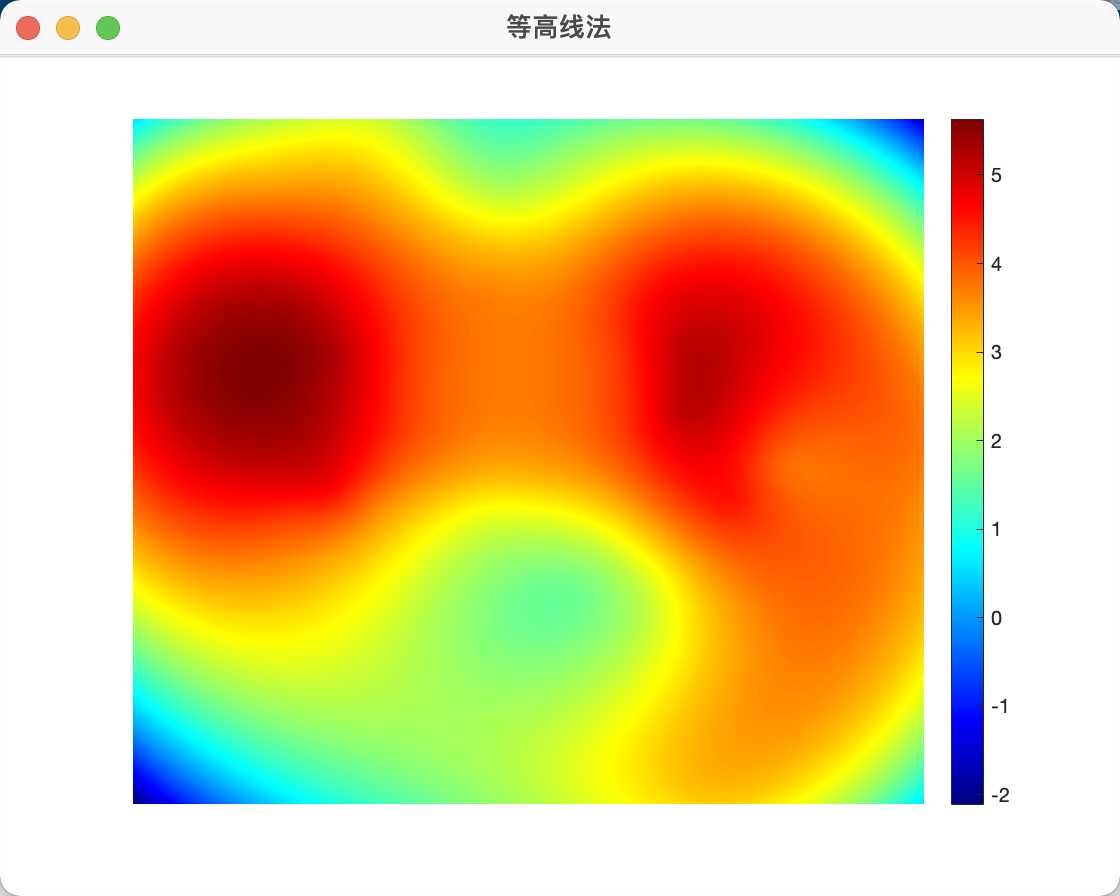
%% 等高线法
figure('NumberTitle','off','Name','等高线法','Color','w','MenuBar','none','ToolBar','none');
contourf(X,Y,Z,N, 'LineColor','none');
colormap('jet');
colorbar;
axis off;

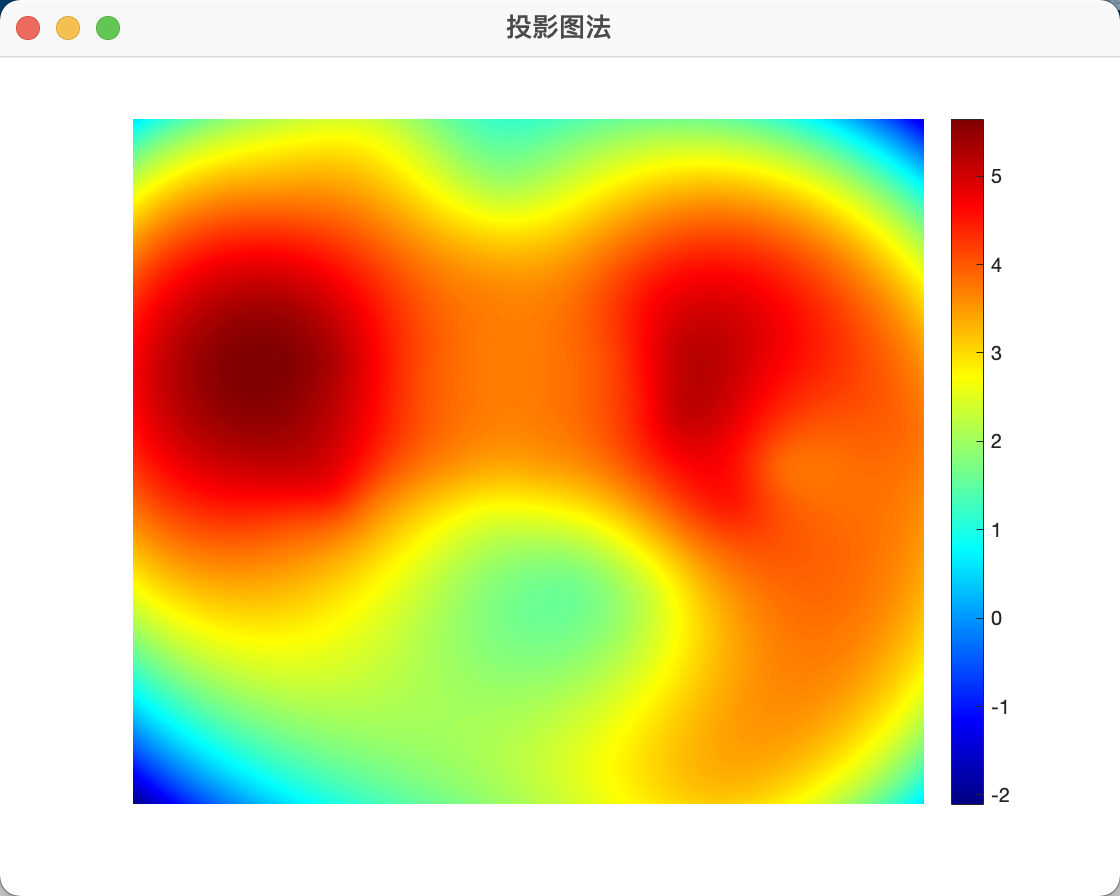
%% 投影图法
figure('NumberTitle','off','Name','投影图法','Color','w','MenuBar','none','ToolBar','none');
surf(X,Y,Z,'LineStyle','none');
xlim([min(X(:)) max(X(:))]);
ylim([min(Y(:)) max(Y(:))]);
axis off;
colormap('jet');
colorbar;
shading interp;
view(0,90);

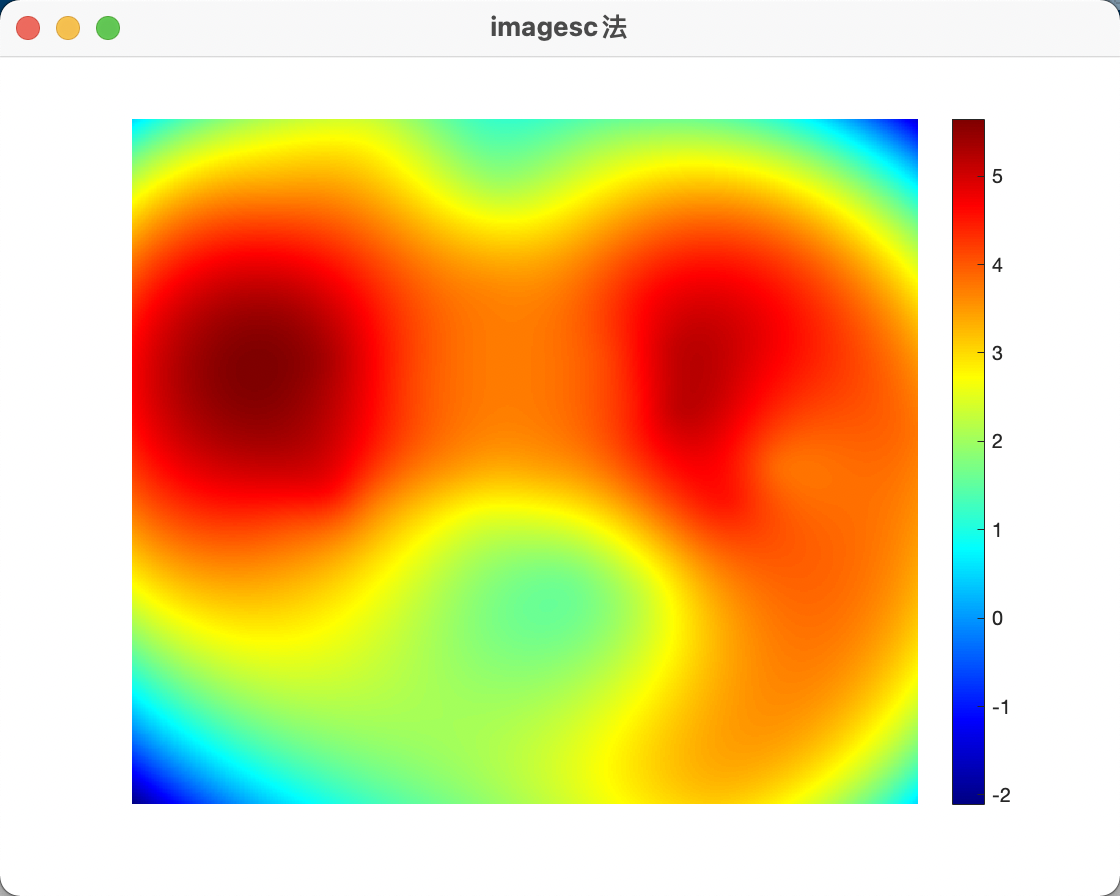
%% imagesc法
figure('NumberTitle','off','Name','imagesc法','Color','w','MenuBar','none','ToolBar','none');
% 因为图像坐标和笛卡尔坐标起始位置不一样,需要上下翻转
imagesc(flipud(Z));
colormap('jet');
colorbar;
axis off;

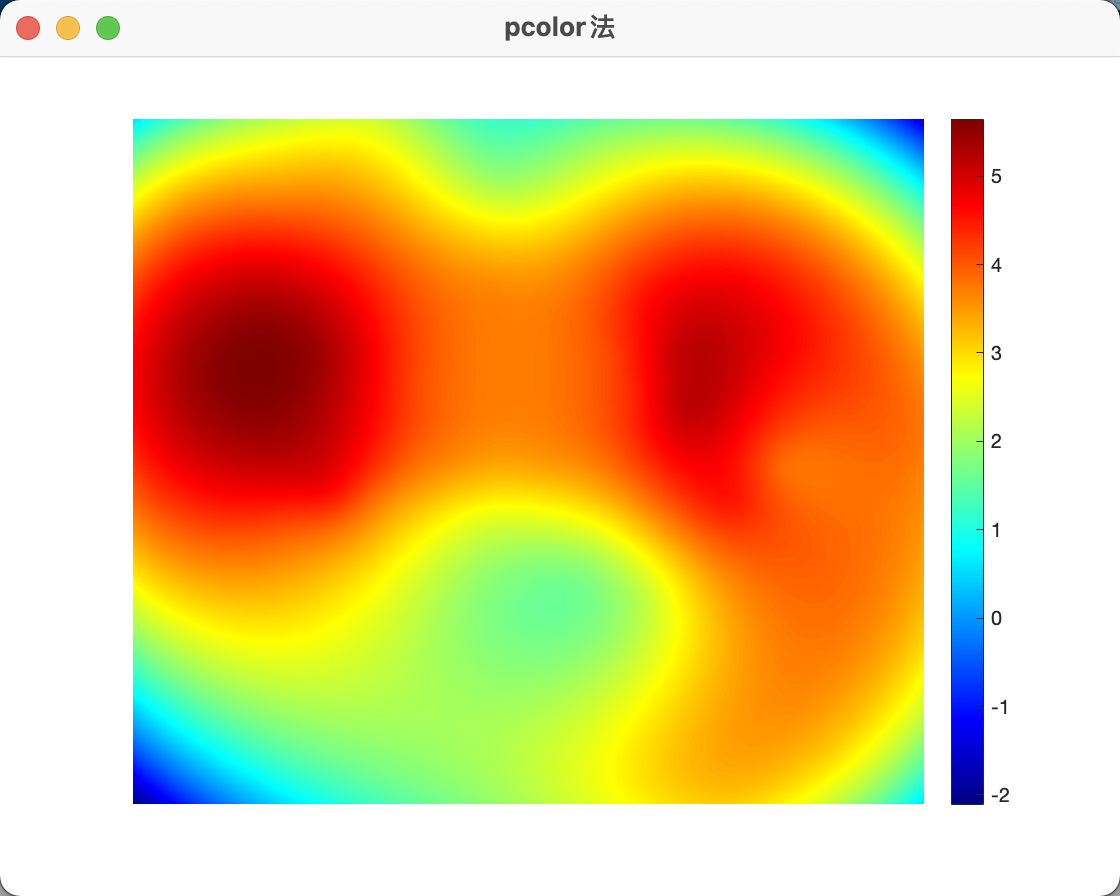
%% pcolor法
figure('NumberTitle','off','Name','pcolor法','Color','w','MenuBar','none','ToolBar','none');
pcolor(X,Y,Z);
colormap('jet');
colorbar;
shading interp;
axis off;
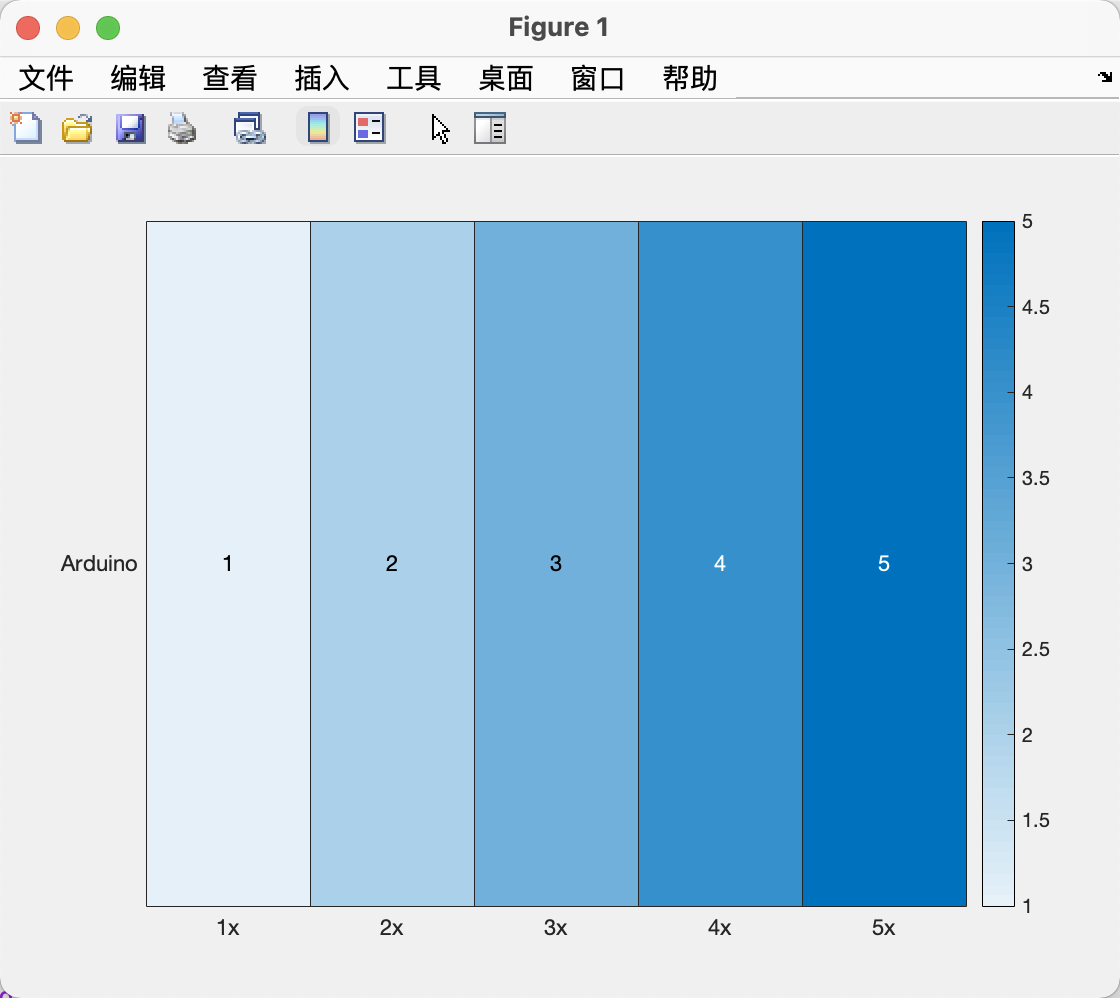
cdata = [1 2 3 4 5];
xvalues = {'1x', '2x', '3x', '4x', '5x'};
yvalues = {'Arduino'};
h = heatmap(xvalues, yvalues, cdata);
Ref:
- 创建热图- MATLAB heatmap - MathWorks 中国
- 看完这篇,还有你不会画的热力图吗?
- matlab热力图
最后
以上就是落寞大神最近收集整理的关于【Matlab】绘制热力图和三维热力图的全部内容,更多相关【Matlab】绘制热力图和三维热力图内容请搜索靠谱客的其他文章。
本图文内容来源于网友提供,作为学习参考使用,或来自网络收集整理,版权属于原作者所有。


发表评论 取消回复