matlab经常要使用函数进行绘图,举个栗子,要绘制下面的函数应该怎么绘制呢?
f ( x ) = s i n ( x ) ∗ ( 1 − x 2 ) f(x)=sin(x)*(1-x^2) f(x)=sin(x)∗(1−x2)
总结有以下三种方法:
1.for循环
这是最最原始的方法了,不推荐
clear
t=linspace(0,20,501);
fi=zeros(1,501);
for ii=1:length(t)
	f1(ii)=sin(t(ii))*(1-t(ii)^2);
end
plot(t,f1,'-')
2.直接计算
matlab有强大的矩阵运算能力,使得问题非常的方便~但是需要把运算符号加上点号 ⋅ cdot ⋅, ∗ * ∗改成.*,把^ 改成.^。
clear
t=linspace(0,20,501);
f1=sin(t).*(1-t.^2);
plot(t,f1,'-')
3.使用subs函数
另外还可以使用subs函数,可以提前规定一个函数,利用subs函数进行赋值。
tic
clear
syms x
f=sin(x)*(1-x^2);
t=linspace(0,20,501);
f1=subs(f,x,t);
plot(t,f1,'-')
toc
对比
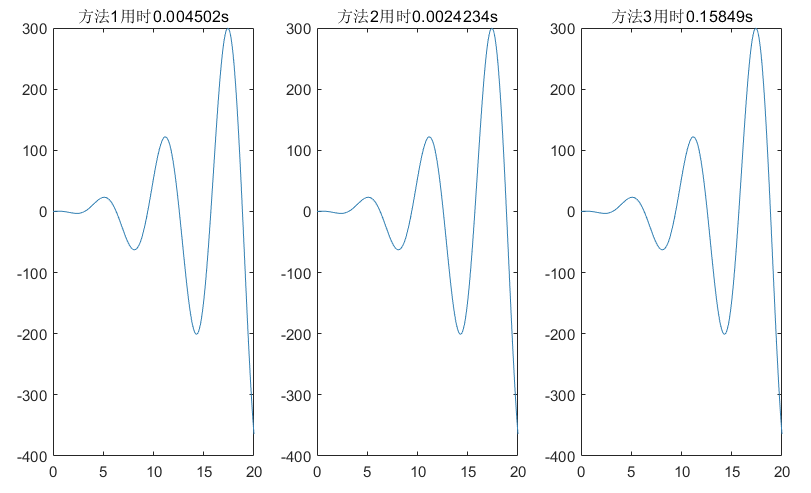
对三种方法进行了运行时间的测试:
方法2最优(直接计算),方法1次之,方法3最慢。

附上测试的代码
clear
t=linspace(0,20,501);
% 第一种方法
tic;
fi=zeros(1,501);
for ii=1:length(t)
	f1(ii)=sin(t(ii))*(1-t(ii)^2);
end
t1=toc;
% 第二种方法
tic;
f2=sin(t).*(1-t.^2);
t2=toc;
% 第三种方法
tic;
syms x
f=sin(x)*(1-x^2);
f3=subs(f,x,t);
t3=toc;
%plot(t,f1,'-')
subplot(1,3,1)
plot(t,f1)
title(['方法1用时',num2str(t1),'s'])
subplot(1,3,2)
plot(t,f2)
title(['方法2用时',num2str(t2),'s'])
subplot(1,3,3)
plot(t,f3)
title(['方法3用时',num2str(t3),'s'])
最后
以上就是糊涂嚓茶最近收集整理的关于matlab绘图的三种方法:已知函数表达式的全部内容,更多相关matlab绘图内容请搜索靠谱客的其他文章。


![Matlab如何多个波形示波器,[转载]simulink在一个图形中画出多个示波器曲线的方法...](https://www.shuijiaxian.com/files_image/reation/bcimg1.png)


发表评论 取消回复