SpringGraph是Adobe的Flex 2.0的开源组件,它可以显示一套有相互联系的节点关系。该组件允许用户拖动和/或交互的个别节点。数据可以是XML或ActionScript对象。
本文使用xml数据来做演示.
网上搜下可以搜到几个非常不错的实例..SpringGraph 的文档还是比较少的.
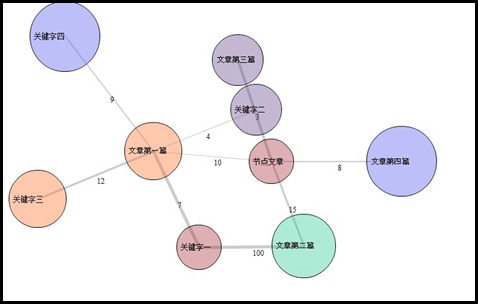
先来看下本文做出来的效果图.

图形是自定义的,这里你可以使用任意图形来连接节点.
首先引入组件这个不用说,将SpringGraph.swc 组件引入到工程.
添加头部信息: xmlns:flex="http://www.adobe.com/2006/fc"
<flex:SpringGraph id="springgraph" bottom="0" top="0" right="0" left="0" backgroundColor="#ffffff"
motionThreshold="1.5" repulsionFactor="0.60" dataProvider="{graph}" itemRenderer="AtomView">
</flex:SpringGraph>几个属性的介绍:
motionThreshold--布局计算停止的时间,有意义的值的范围是从0.001到2.0左右。低的数字意味着布局需要更长的时间定下来。高数量意味着布局将更快停止,这个值适中即可.
repulsionFactor--原子之间的关系间距,默认是0.75
dataProvider--不用说,就是你的数据来源.
itemRenderer--定义一个项目渲染UIComponent类,这个类可以绘制每个节点的样式以及形状大小.
lineColor --线的颜色.
autoFit--自动调整,保证该图形不跑出界面
这几个属性是我所用到的.可能用自己的语言组织出来不是很明白.大家试试就可以了。
之后需要一个符合格式的xml
var strXML:String = "<molecule convention="MDLMol" id="dataSmall" title="NICOTINE">" +
  "<graph>" +
    "<Node id="1"   prop="节点文章"   color="0xaf3a42" />" +
    "<Node id="1.1" prop="文章第一篇" color="0xfa7730"  />" +
    "<Node id="1.2" prop="文章第二篇" color="0x33CC99"/>" +
    "<Node id="1.3" prop="文章第三篇" color="0x6b4c8f" />" +
    "<Node id="1.4" prop="文章第四篇" color="0x585fee" />" +
    "<Node id="1.1.1" prop="关键字一" color="0xaf3a42" />" +
    "<Node id="1.1.2" prop="关键字二" color="0x6b4c8f"  />" +
    "<Node id="1.1.3" prop="关键字三" color="0xfa7730"  />" +
    "<Node id="1.1.4" prop="关键字四" color="0x585fee" />" +

    "<Edge fromID="1" toID="1.1" order="1" number="10"/>" +
    "<Edge fromID="1" toID="1.2" order="3" number="15"/>" +
    "<Edge fromID="1" toID="1.3" order="4" number="3"/>" +
    "<Edge fromID="1" toID="1.4" order="2" number="8"/>" +
    "<Edge fromID="1.1" toID="1.1.1" order="5" number="7"/>" +
    "<Edge fromID="1.1" toID="1.1.2" order="1" number="4"/>" +
    "<Edge fromID="1.1" toID="1.1.3" order="3" number="12"/>" +
    "<Edge fromID="1.1" toID="1.1.4" order="2" number="9"/>" +
    "<Edge fromID="1.2" toID="1.1.1" order="5" number="100"/>" +
    "
</graph>
</molecule>";
注意关键的属性 fromID 和toID
Node节点就是原子,Edge是他们之间的关系. prop 是名称 ,color就是圆的颜色了,order是线的粗细,number 的线上显示的文字.
Mian.mxml代码
<flex:SpringGraph id="springgraph" bottom="0" top="0" right="0" left="0" backgroundColor="#ffffff"motionThreshold="1.5" repulsionFactor="0.60" dataProvider="{graph}" autoFit="true" itemRenderer="AtomView"><fx:Script>[Bindable]public var graph: Graph = new Graph();//strXML就是上文写的到那段xmlprivate function gotData(strXml:String): void {//ShowLoding();graph.empty();// 获得xml数据var x:XML = new XML(strXml);loadCML(x, graph);}// This namespace is used in some, but not all, CML filespublic static var cmlns:Namespace = new Namespace("x-schema:cml_schema_ie_02.xml");private static function loadCML(cml: XML, g: Graph): void {var gid: String = cml.@id;var item: Item;for each (var node: XML in cml..Node) {item = new Item(gid + node.@id);item.data = node;g.add(item);}for each (node in cml..cmlns::Node) {item = new Item(gid + node.@id);item.data = node;g.add(item);}for each (var bond: XML in cml..Edge) {loadBond(bond, g, gid);}for each (bond in cml..cmlns::Edge) {loadBond(bond, g, gid);}}private static function loadBond(bond: XML, g: Graph, gid: String): void {var fromID: String;var toID: String;var orderString: String;var infoString:String;var colorString:String;try {fromID = bond.@fromID;toID = bond.@toID;orderString = bond.@order;infoString = bond.@number;colorString = bond.@color;} catch (e: Error) {}var fromItem: Item = g.find(gid + fromID);var toItem: Item = g.find(gid + toID);if((fromItem != null) && (toItem != null)) {var order: int = int(orderString.toString());var data: Object = {settings: {alpha: 0.2 , color: colorString, tooltip: "测试数据",info:infoString, thickness: order}};g.link(fromItem, toItem, data);}}</fx:Script>
itemRenderer="AtomView"
AtomView 是一个mxml组件 用来呈现图形化UI
AtomView.mxml代码:
<Circle id="circle" doubleClick="createPopUp(data.data.@pid)"/><mx:Label id="lab" doubleClick="createPopUp(data.data.@pid)"/><mx:Style source="index.css"/>scaleX="{Main.getInstance().scaleFactor}"scaleY="{Main.getInstance().scaleFactor}" --><mx:Script><


![[ Office 365 开发系列 ] Graph Service](https://www.shuijiaxian.com/files_image/reation/bcimg7.png)


发表评论 取消回复