# ldeallowpassfilter.py
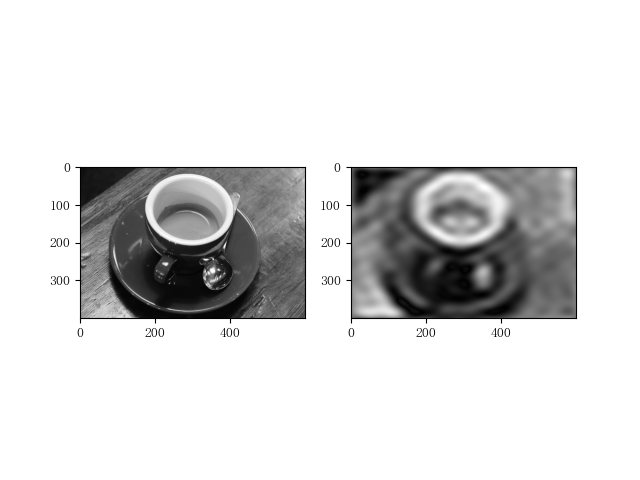
# 理想低通滤波器
# 导入相关库
from skimage import data, color
import numpy as np
import matplotlib.pyplot as plt
"""
中文显示工具函数
"""
def set_ch():
from pylab import mpl
mpl.rcParams['font.sans-serif'] = ['FangSong']
mpl.rcParams['axes.unicode_minus'] = False
set_ch()
D = 10
# 读入图像
new_img = data.coffee()
new_img = color.rgb2gray(new_img)
# numpy中的傅里叶变换
f1 = np.fft.fft2(new_img)
f1_shift = np.fft.fftshift(f1)
# 使用np.fft.fftshift()函数实现平移,让直流分量输出图像的重心
# 实现理想低通滤波器
rows, cols = new_img.shape
crow, ccol = int(rows/2), int(cols/2) # 计算频谱中心
mask = np.zeros((rows, cols), np.uint8) # 生成rows行cols列的矩阵,数据格式为uint8
for i in range(rows):
for j in range(cols):
if np.sqrt(i*i+j*j) <= D:
# 将距离频谱中心小于D的部分低通信息设置为1,属于低通滤波
mask[crow-D:crow+D, ccol-D:ccol+D] = 1
f1_shift = f1_shift*mask
# 傅里叶逆变换
f_ishift = np.fft.ifftshift(f1_shift)
img_back = np.fft.ifft2(f_ishift)
img_back = np.abs(img_back)
img_back = (img_back-np.amin(img_back))/(np.amax(img_back)-np.amin(img_back))
# plt.figure(figsize=(15, 8))
plt.figure()
plt.subplot(121), plt.imshow(new_img, cmap='gray')
plt.subplot(122), plt.imshow(img_back, cmap='gray')
plt.show()
最后
以上就是深情小鸽子最近收集整理的关于数字图像-理想低通滤波器的全部内容,更多相关数字图像-理想低通滤波器内容请搜索靠谱客的其他文章。
本图文内容来源于网友提供,作为学习参考使用,或来自网络收集整理,版权属于原作者所有。


![[数字图像处理]频域滤波(2)--高通滤波器,带阻滤波器与陷波滤波器](https://www.shuijiaxian.com/files_image/reation/bcimg11.png)


发表评论 取消回复