1.matlab判断一个元素是否在矩阵中
ismember(a,A)
2 MATLAB 怎么判断矩阵中是否存在某一行等于一个行向量.
newUniqueAllPoint = UniqueAllPoint(:,1:2);
counterArray = zeros(max(size(UniqueAllPoint)),1);
% for i
= 1:max(size(UniqueAllPoint))
for i
= 1:max(size(UniqueAllPoint))
% for i
= 1:100
i
elem = UniqueAllPoint(i,1:2);
sa =size(newUniqueAllPoint,1);
p = elem; %将需要判定的行赋值给p
pz= ones(sa,1)*p-newUniqueAllPoint;
position = find(all(pz == [0,0],2));
counterArray(i) = length(position);
end
find(counterArray ~=0 & counterArray ~=1)
3.大矩阵 n2维,行向量为 12,判断行向量在大矩阵里面的计数
hang = [a,b];
position = find(all(pz == hang ,2));
4 grid on 指定坐标宽度
set(gca,'YTick',0:0.5:8);
5对图里面某一个数据点进行标注
figure(1);
word = char('2');
px = 2; py = 2;
plot(px,py,'r.','MarkerSize',10)
text(px,py,word);
6 legend 内加入变量
figure
for i = 1:CombinationNum
plot(totalStd(:,i));
hold on
legend_str{i} = ['flavor' num2str(i)];
end
legend(legend_str)
7.多条线,循环对奇偶奇数的线使用不同的线性
figure(100)
for i = 1:1:CombinationNum
if(mod(i,2))
plot(totalStd(:,i),"--");
hold on
else
plot(totalStd(:,i),":");
hold on
end
legend_str{i} = ['index' num2str(i)];
end
plot(totalStd(:,i+1),'k-');
legend_str{i+1} = ['experimental line'];
legend(legend_str)
xlabel("combination index");
ylabel("std");
title(" std
");
hold off;
8.在图片上画线,并提取直线上的像素值
clc;clear all;
load point_VcCfRecon_full_1800_20_14to16.mat
load point_VcCfRecon_full_4800_20_10toend
load point_VcCfRecon_full_3600_20_14to16
image1800 = point_VcCfRecon_full_1800_20_14to16;
image3600 = point_VcCfRecon_full_3600_20_14to16;
image4800 = point_VcCfRecon_full_4800_20_10toend;
%% 获取线段两点间的那些数据点坐标
n = 2;
figure(1);
imshow(image4800);
[x1,y1] = ginput(n);
k = (y1(1) - y1(2))/(x1(1) - x1(2));
b = y1(1) - k * x1(1);
stepSize = 1;
x = x1(1):stepSize:x1(2);
y = k .* x + b;
%% 插值,获取数据点坐标对应的CT值
CT_xy4800 = Inter(y,x,image4800);
%matlab的x-y和图像定义里面的xy是相反的
CT_xy3600 = Inter(y,x,image3600);
CT_xy1800 = Inter(y,x,image1800);
figure(2);
hold on;
plot(CT_xy4800,'g-');
plot(CT_xy3600,'k--');
plot(CT_xy1800,'b-.');
set(gca,'YTick',-100:50:1300);
grid on;
ylabel("CT");
title("profile");
legend("CT_xy4800","CT_xy3600","CT_xy1800");
hold off;
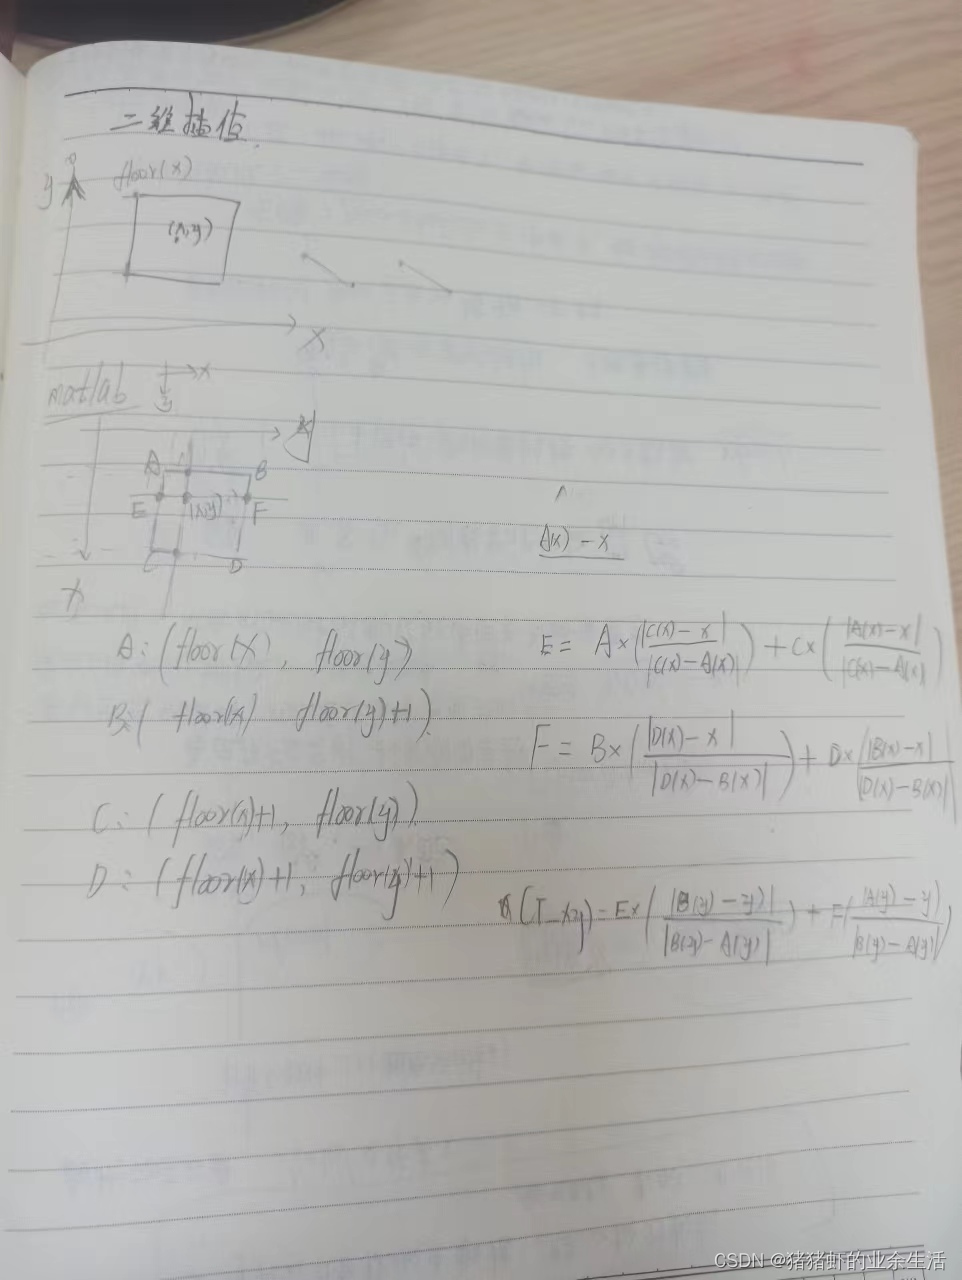
function CT_xy = Inter(Allx,Ally,img)
for i = 1:size(Allx,2)
x = Allx(i);
y = Ally(i);
newX = floor(x);
newY = floor(y);
A = [newX ,newY];
B = [newX ,newY +1];
C = [newX + 1 ,newY];
D = [newX + 1 ,newY +1];
E = img(A(1),A(2)) * abs(C(1) - x) + img(C(1),C(2)) * abs(A(1) - x);
F = img(B(1),B(2)) * (abs(D(1) - x)) + img(D(1),D(2)) * (abs(B(1) - x));
CT_xy(i) = E * (abs(B(2) - y)) + F * (abs(A(2) - y));
end
end
9.动态修改变量名并保存
filename = ['Best_',num2str(CHANNEL_INDEX),'_Cn',num2str(MaxIterateTimes)];
eval(['Best_',num2str(CHANNEL_INDEX),'_Cn',num2str(MaxIterateTimes),' = Cn']);
save(filename,['Cn', num2str(k)]);
10 修改figure默认背景色,修改之后如何恢复
set(0,'defaultfigurecolor','w')
reset(groot);
最后
以上就是清爽山水最近收集整理的关于matlab一些常用的技巧函数的全部内容,更多相关matlab一些常用内容请搜索靠谱客的其他文章。
本图文内容来源于网友提供,作为学习参考使用,或来自网络收集整理,版权属于原作者所有。


发表评论 取消回复