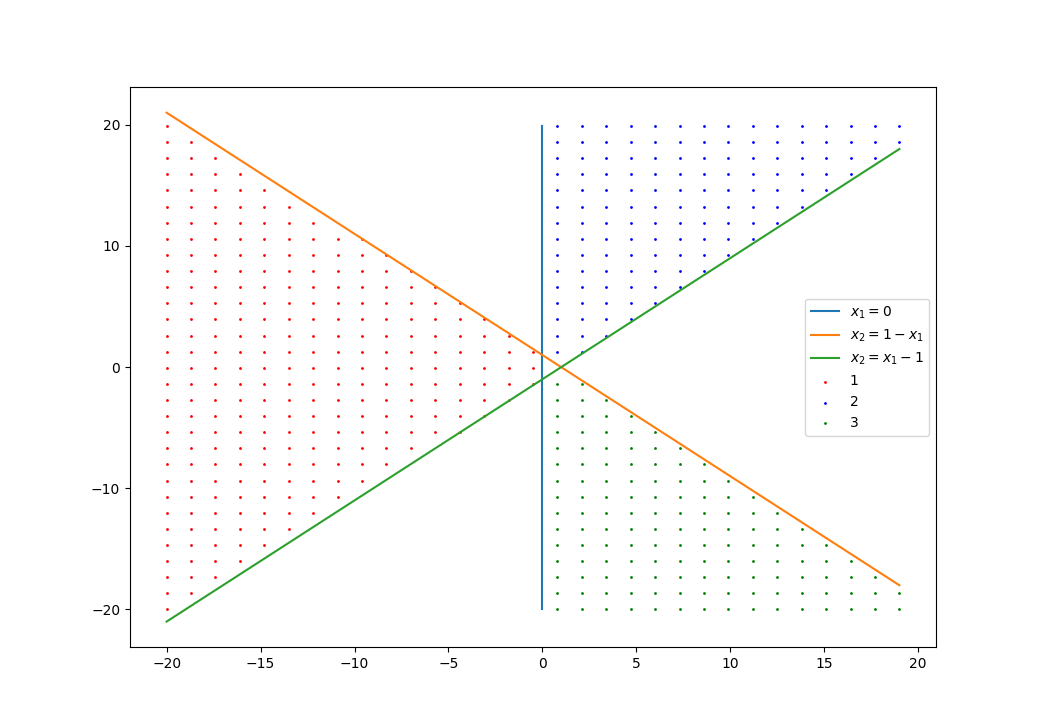
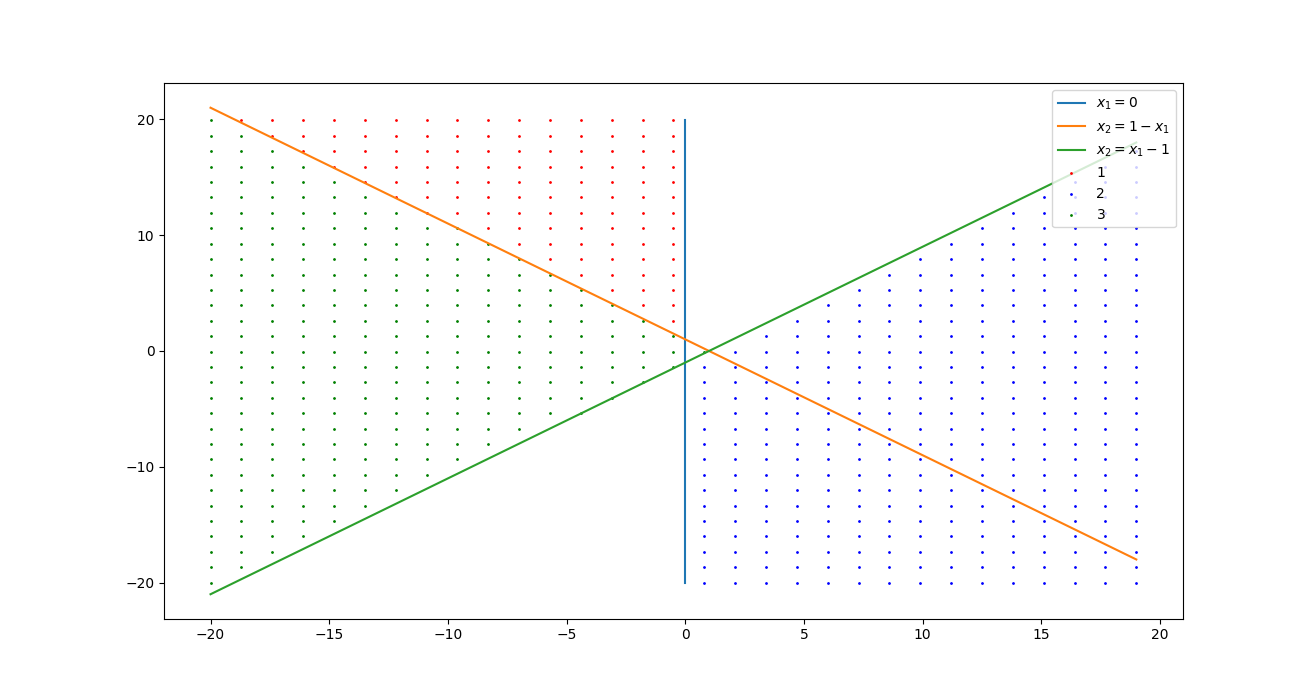
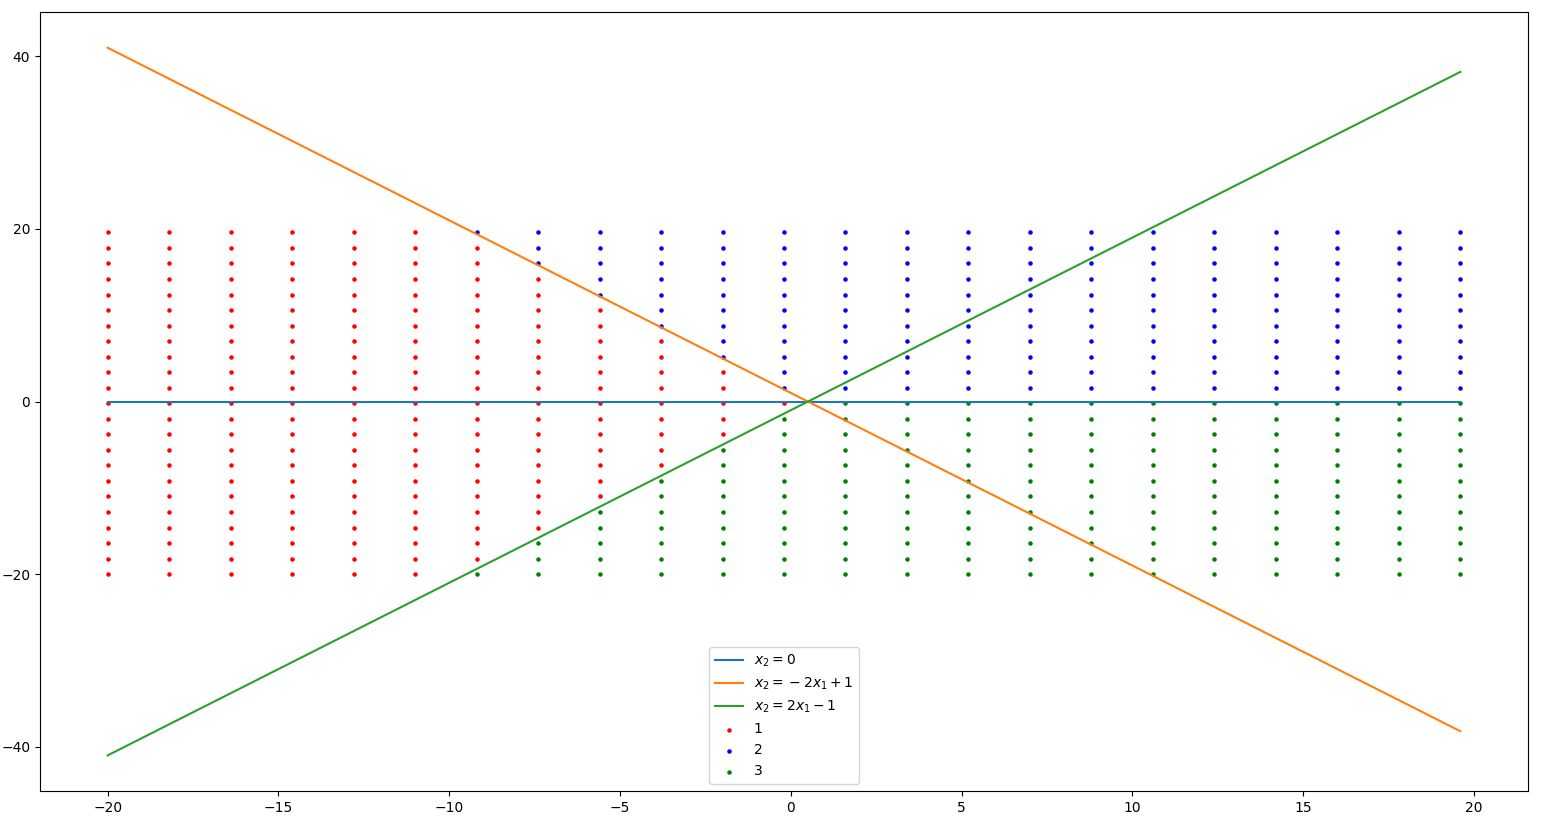
三种多类情况,判别界面和每一个模式类别的区域代码
写的作业,顺手放上来
# 多类情况1
import numpy as np
import matplotlib.pyplot as plt
d1 = lambda x, y : -x
f1 = lambda x: x-x
def d2(x1, x2):
return x1 + x2 - 1
f2 = lambda x : 1 - x
def d3(x1, x2):
return x1 - x2 - 1
f3 = lambda x : x - 1
x1 = np.arange(-20, 20, 1.3)
x2 = np.arange(-20, 20, 1.33)
X1, X2 = np.meshgrid(x1, x2)
plt.figure()
show1 = (d1(X1, X2) > 0) & (d2(X1, X2) < 0) & (d3(X1, X2) < 0)
show1_x = X1[show1]
show1_y = X2[show1]
plt.scatter(show1_x, show1_y, c="r", label="1", s=1)
plt.plot(f1(x2), x2, label="$x_1=0$")
show2 = (d2(X1, X2) > 0) & (d1(X1, X2) < 0) & (d3(X1, X2) < 0)
show2_x = X1[show2]
show2_y = X2[show2]
plt.scatter(show2_x, show2_y, c="b", label="2", s=1)
plt.plot(x1, f2(x1), label="$x_2 = 1-x_1$")
show3 = (d3(X1, X2) > 0) & (d1(X1, X2) < 0) & (d2(X1, X2) < 0)
show3_x = X1[show3]
show3_y = X2[show3]
plt.scatter(show3_x, show3_y, c="g", label="3", s=1)
plt.plot(x1, f3(x1), label="$x_2=x_1-1$")
plt.legend()
plt.show()
# ------------------------------------------
# 多类情况2
import numpy as np
import matplotlib.pyplot as plt
d1 = lambda x, y : -x
f1 = lambda x: x-x
def d2(x1, x2):
return x1 + x2 - 1
f2 = lambda x : 1 - x
def d3(x1, x2):
return x1 - x2 - 1
f3 = lambda x : x - 1
d12 = d1
d13 = d2
d23 = d3
d21 = lambda x, y:-d12(x,y)
d31 = lambda x, y:-d13(x,y)
d32 = lambda x, y:-d23(x,y)
x1 = np.arange(-20, 20, 1.3)
x2 = np.arange(-20, 20, 1.33)
X1, X2 = np.meshgrid(x1, x2)
plt.figure()
show1 = (d12(X1, X2) > 0) & (d13(X1, X2) > 0)
show1_x = X1[show1]
show1_y = X2[show1]
plt.scatter(show1_x, show1_y, c="r", label="1", s=1)
plt.plot(f1(x2), x2, label="$x_1=0$")
show2 = (d23(X1, X2) > 0) & (d21(X1, X2) > 0)
show2_x = X1[show2]
show2_y = X2[show2]
plt.scatter(show2_x, show2_y, c="b", label="2", s=1)
plt.plot(x1, f2(x1), label="$x_2 = 1-x_1$")
show3 = (d31(X1, X2) > 0) & (d32(X1, X2) > 0)
show3_x = X1[show3]
show3_y = X2[show3]
plt.scatter(show3_x, show3_y, c="g", label="3", s=1)
plt.plot(x1, f3(x1), label="$x_2=x_1-1$")
plt.legend()
plt.show()
# --------------------------------------
# 多类情况3
import numpy as np
import matplotlib.pyplot as plt
d1 = lambda x, y : -x
f1 = lambda x: x-x
def d2(x1, x2):
return x1 + x2 - 1
f2 = lambda x : 1 - 2*x
def d3(x1, x2):
return x1 - x2 - 1
f3 = lambda x : 2*x - 1
x1 = np.arange(-20, 20, 1.8)
x2 = np.arange(-20, 20, 1.8)
X1, X2 = np.meshgrid(x1, x2)
plt.figure()
show1 = (d1(X1, X2) > d2(X1, X2)) & (d1(X1, X2) > d3(X1, X2))
show1_x = X1[show1]
show1_y = X2[show1]
plt.scatter(show1_x, show1_y, c="r", label="1", s=5)
plt.plot(x1, f1(x1), label="$x_2=0$")
show2 = (d2(X1, X2) > d1(X1, X2)) & (d2(X1, X2) > d3(X1, X2))
show2_x = X1[show2]
show2_y = X2[show2]
plt.scatter(show2_x, show2_y, c="b", label="2", s=5)
plt.plot(x1, f2(x1), label="$x_2 = -2x_1+1$")
show3 = (d3(X1, X2) > d1(X1, X2)) & (d3(X1, X2) > d2(X1, X2))
show3_x = X1[show3]
show3_y = X2[show3]
plt.scatter(show3_x, show3_y, c="g", label="3", s=5)
plt.plot(x1, f3(x1), label="$x_2=2x_1-1$")
plt.legend()
plt.show()


最后
以上就是开朗大米最近收集整理的关于[每日一氵]三种多类情况,判别界面和每一个模式类别的区域代码的全部内容,更多相关[每日一氵]三种多类情况,判别界面和每一个模式类别内容请搜索靠谱客的其他文章。
本图文内容来源于网友提供,作为学习参考使用,或来自网络收集整理,版权属于原作者所有。


![[每日一氵]三种多类情况,判别界面和每一个模式类别的区域代码](https://www.shuijiaxian.com/files_image/reation/bcimg13.png)


发表评论 取消回复