v Pyiz
在ns-3中集合到Visualizer。只要在程序中加入:
CommandLine cmd;
cmd.Parse (argc,argv);
并且在运行是加入参数-vis。它不需要trace文件
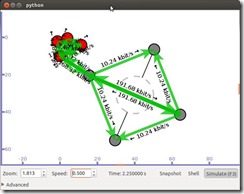
运行第三个示例./waf --run third --vis
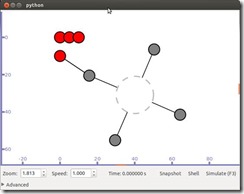
红色为无线网络,绿色为通信状态。
v NetAnim
NetAnim是基于Qt4的离线动画演示工具。,主要是利用XML格式的trace文件,仿真后NetAnim读取该文件显示网络拓扑和节点数据分组等动画过程。Ns-3中的ns3::AnimationInterface类负责生存XML跟踪文件。在仿真开始前,AnimationInterface注册为tx和rx(发送数据和接受数据)事件的追踪hook,当发送和接受数据分组是,在AnimationInterface能感知到正在流动的数据流的2个端点,然后添加该信息到XML格式的追踪文件。
使用NetAnim时分两步:
第一步、生成XML记录文件。
① 确保程序的wscipt文件包含netanim模块,src/netanim/examples/wsctipt是关于wscript文件的例子。
② 包含头文件:#include”ns3/netanim-module.h”
③ 添加语句
AnimationInterface::SetConstantPosition (p2pNodes.Get (1), 10, 30); //位置
AnimationInterface::SetNodeDescription (wifiApNode, "AP"); // Optional名字
AnimationInterface::SetNodeColor (csmaNodes, 0, 0, 255); // Optional节点颜色
AnimationInterface::SetBoundary (0, 0, 35, 35); // Optional范围
AnimationInterface anim ("wireless-animation.xml"); // Mandatory名字
anim.EnablePacketMetadata (true); // Optional
anim.EnableIpv4RouteTracking ("routingtable-wireless.xml", Seconds (0), Seconds (5), Seconds (0.25)); //Optional
具体例子可以看自带的/ns-allinone-3.19/ns-3.19/src/netanim/examples/wireless-animation.cc
第二步、使用NetAnim装载XML记录文件
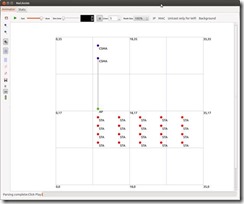
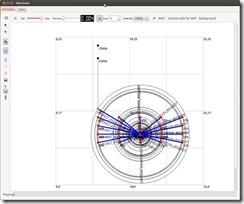
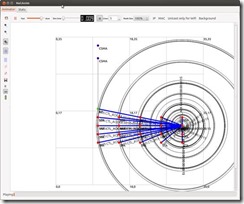
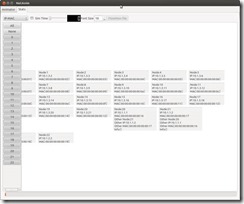
在终端./NetAnim,然后左上角File open按钮,选择XML文件,单击播放按钮开始动画。
具体截图如下:
XML文件有:
a. <anim> XML根元素
b. <topology>画布坐标X、Y的最大和最小值
c. <node>描述每个节点的ID、x、y坐标位置及颜色
d. <link>描述节点间的链路
e. <packet>描述包在无线网络中传输。
f. <rx>节点收到的数据包
g. <wpacket>无线数据分组
v Tcpump
tcpdump [ -AdDeflLnNOpqRStuUvxX ] [ -c count ]
[ -C file_size ] [ -F file ]
[ -i interface ] [ -m module ] [ -M secret ]
[ -r file ] [ -s snaplen ] [ -T type ] [ -w file ]
[ -W filecount ]
[ -E spi@ipaddr algo:secret,... ]
[ -y datalinktype ] [ -Z user ]
[ expression ]
-A 以ASCII码方式显示每一个数据包(不会显示数据包中链路层头部信息). 在抓取包含网页数据的数据包时, 可方便查看数据(nt: 即Handy for capturing web pages).
-c count
tcpdump将在接受到count个数据包后退出.
-C file-size (nt: 此选项用于配合-w file 选项使用)
该选项使得tcpdump 在把原始数据包直接保存到文件中之前, 检查此文件大小是否超过file-size. 如果超过了, 将关闭此文件,另创一个文件继续用于原始数据包的记录. 新创建的文件名与-w 选项指定的文件名一致, 但文件名后多了一个数字.该数字会从1开始随着新创建文件的增多而增加. file-size的单位是百万字节(nt: 这里指1,000,000个字节,并非1,048,576个字节, 后者是以1024字节为1k, 1024k字节为1M计算所得, 即1M=1024 * 1024 = 1,048,576)
-d 以容易阅读的形式,在标准输出上打印出编排过的包匹配码, 随后tcpdump停止.(nt | rt: human readable, 容易阅读的,通常是指以ascii码来打印一些信息. compiled, 编排过的. packet-matching code, 包匹配码,含义未知, 需补充)
-dd 以C语言的形式打印出包匹配码.
-ddd 以十进制数的形式打印出包匹配码(会在包匹配码之前有一个附加的'count'前缀).
-D 打印系统中所有tcpdump可以在其上进行抓包的网络接口. 每一个接口会打印出数字编号, 相应的接口名字, 以及可能的一个网络接口描述. 其中网络接口名字和数字编号可以用在tcpdump 的-i flag 选项(nt: 把名字或数字代替flag), 来指定要在其上抓包的网络接口.
此选项在不支持接口列表命令的系统上很有用(nt: 比如, Windows 系统, 或缺乏 ifconfig -a 的UNIX系统); 接口的数字编号在windows 2000 或其后的系统中很有用, 因为这些系统上的接口名字比较复杂, 而不易使用.
如果tcpdump编译时所依赖的libpcap库太老,-D 选项不会被支持, 因为其中缺乏 pcap_findalldevs()函数.
-e 每行的打印输出中将包括数据包的数据链路层头部信息
-E spi@ipaddr algo:secret,...
可通过spi@ipaddr algo:secret 来解密IPsec ESP包(nt | rt:IPsec Encapsulating Security Payload,IPsec 封装安全负载, IPsec可理解为, 一整套对ip数据包的加密协议, ESP 为整个IP 数据包或其中上层协议部分被加密后的数据,前者的工作模式称为隧道模式; 后者的工作模式称为传输模式 . 工作原理, 另需补充).
需要注意的是, 在终端启动tcpdump 时, 可以为IPv4 ESP packets 设置密钥(secret).
可用于加密的算法包括des-cbc, 3des-cbc, blowfish-cbc, rc3-cbc, cast128-cbc, 或者没有(none).默认的是des-cbc(nt: des, Data Encryption Standard, 数据加密标准, 加密算法未知, 另需补充).secret 为用于ESP 的密钥, 使用ASCII 字符串方式表达. 如果以 0x 开头, 该密钥将以16进制方式读入.
该选项中ESP 的定义遵循RFC2406, 而不是 RFC1827. 并且, 此选项只是用来调试的, 不推荐以真实密钥(secret)来使用该选项, 因为这样不安全: 在命令行中输入的secret 可以被其他人通过ps 等命令查看到.
除了以上的语法格式(nt: 指spi@ipaddr algo:secret), 还可以在后面添加一个语法输入文件名字供tcpdump 使用(nt:即把spi@ipaddr algo:secret,... 中...换成一个语法文件名). 此文件在接受到第一个ESP 包时会打开此文件, 所以最好此时把赋予tcpdump 的一些特权取消(nt: 可理解为, 这样防范之后, 当该文件为恶意编写时,不至于造成过大损害).
-f 显示外部的IPv4 地址时(nt: foreign IPv4 addresses, 可理解为, 非本机ip地址), 采用数字方式而不是名字.(此选项是用来对付Sun公司的NIS服务器的缺陷(nt: NIS, 网络信息服务, tcpdump 显示外部地址的名字时会用到她提供的名称服务): 此NIS服务器在查询非本地地址名字时,常常会陷入无尽的查询循环).
由于对外部(foreign)IPv4地址的测试需要用到本地网络接口(nt: tcpdump 抓包时用到的接口)及其IPv4 地址和网络掩码. 如果此地址或网络掩码不可用, 或者此接口根本就没有设置相应网络地址和网络掩码(nt: linux 下的 'any' 网络接口就不需要设置地址和掩码, 不过此'any'接口可以收到系统中所有接口的数据包), 该选项不能正常工作.
-F file
使用file 文件作为过滤条件表达式的输入, 此时命令行上的输入将被忽略.
-i interface
指定tcpdump 需要监听的接口. 如果没有指定, tcpdump 会从系统接口列表中搜寻编号最小的已配置好的接口(不包括 loopback 接口).一但找到第一个符合条件的接口, 搜寻马上结束.
在采用2.2版本或之后版本内核的Linux 操作系统上, 'any' 这个虚拟网络接口可被用来接收所有网络接口上的数据包(nt: 这会包括目的是该网络接口的, 也包括目的不是该网络接口的). 需要注意的是如果真实网络接口不能工作在'混杂'模式(promiscuous)下,则无法在'any'这个虚拟的网络接口上抓取其数据包.
如果 -D 标志被指定, tcpdump会打印系统中的接口编号,而该编号就可用于此处的interface 参数.
-l 对标准输出进行行缓冲(nt: 使标准输出设备遇到一个换行符就马上把这行的内容打印出来).在需要同时观察抓包打印以及保存抓包记录的时候很有用. 比如, 可通过以下命令组合来达到此目的:
``tcpdump -l | tee dat'' 或者 ``tcpdump -l > dat & tail -f dat''.(nt: 前者使用tee来把tcpdump 的输出同时放到文件dat和标准输出中, 而后者通过重定向操作'>', 把tcpdump的输出放到dat 文件中, 同时通过tail把dat文件中的内容放到标准输出中)
-L 列出指定网络接口所支持的数据链路层的类型后退出.(nt: 指定接口通过-i 来指定)
-m module
通过module 指定的file 装载SMI MIB 模块(nt: SMI,Structure of Management Information, 管理信息结构MIB, Management Information Base, 管理信息库. 可理解为, 这两者用于SNMP(Simple Network Management Protoco)协议数据包的抓取. 具体SNMP 的工作原理未知, 另需补充).
此选项可多次使用, 从而为tcpdump 装载不同的MIB 模块.
-M secret 如果TCP 数据包(TCP segments)有TCP-MD5选项(在RFC 2385有相关描述), 则为其摘要的验证指定一个公共的密钥secret.
-n 不对地址(比如, 主机地址, 端口号)进行数字表示到名字表示的转换.
-N 不打印出host 的域名部分. 比如, 如果设置了此选现, tcpdump 将会打印'nic' 而不是 'nic.ddn.mil'.
-O 不启用进行包匹配时所用的优化代码. 当怀疑某些bug是由优化代码引起的, 此选项将很有用.
-p 一般情况下, 把网络接口设置为非'混杂'模式. 但必须注意 , 在特殊情况下此网络接口还是会以'混杂'模式来工作; 从而, '-p' 的设与不设, 不能当做以下选现的代名词:'ether host {local-hw-add}' 或 'ether broadcast'(nt: 前者表示只匹配以太网地址为host 的包, 后者表示匹配以太网地址为广播地址的数据包).
-q 快速(也许用'安静'更好?)打印输出. 即打印很少的协议相关信息, 从而输出行都比较简短.
-R 设定tcpdump 对 ESP/AH 数据包的解析按照 RFC1825而不是RFC1829(nt: AH, 认证头, ESP, 安全负载封装, 这两者会用在IP包的安全传输机制中). 如果此选项被设置, tcpdump 将不会打印出'禁止中继'域(nt: relay prevention field). 另外,由于ESP/AH规范中没有规定ESP/AH数据包必须拥有协议版本号域,所以tcpdump不能从收到的ESP/AH数据包中推导出协议版本号.
-r file
从文件file 中读取包数据. 如果file 字段为 '-' 符号, 则tcpdump 会从标准输入中读取包数据.
-S 打印TCP 数据包的顺序号时, 使用绝对的顺序号, 而不是相对的顺序号.(nt: 相对顺序号可理解为, 相对第一个TCP 包顺序号的差距,比如, 接受方收到第一个数据包的绝对顺序号为232323, 对于后来接收到的第2个,第3个数据包, tcpdump会打印其序列号为1, 2分别表示与第一个数据包的差距为1 和 2. 而如果此时-S 选项被设置, 对于后来接收到的第2个, 第3个数据包会打印出其绝对顺序号:232324, 232325).
-s snaplen
设置tcpdump的数据包抓取长度为snaplen, 如果不设置默认将会是68字节(而支持网络接口分接头(nt: NIT, 上文已有描述,可搜索'网络接口分接头'关键字找到那里)的SunOS系列操作系统中默认的也是最小值是96).68字节对于IP, ICMP(nt: Internet Control Message Protocol,因特网控制报文协议), TCP 以及 UDP 协议的报文已足够, 但对于名称服务(nt: 可理解为dns, nis等服务), NFS服务相关的数据包会产生包截短. 如果产生包截短这种情况, tcpdump的相应打印输出行中会出现''[|proto]''的标志(proto 实际会显示为被截短的数据包的相关协议层次). 需要注意的是, 采用长的抓取长度(nt: snaplen比较大), 会增加包的处理时间, 并且会减少tcpdump 可缓存的数据包的数量, 从而会导致数据包的丢失. 所以, 在能抓取我们想要的包的前提下, 抓取长度越小越好.把snaplen 设置为0 意味着让tcpdump自动选择合适的长度来抓取数据包.
-T type
强制tcpdump按type指定的协议所描述的包结构来分析收到的数据包. 目前已知的type 可取的协议为:
aodv (Ad-hoc On-demand Distance Vector protocol, 按需距离向量路由协议, 在Ad hoc(点对点模式)网络中使用),
cnfp (Cisco NetFlow protocol), rpc(Remote Procedure Call), rtp (Real-Time Applications protocol),
rtcp (Real-Time Applications con-trol protocol), snmp (Simple Network Management Protocol),
tftp (Trivial File Transfer Protocol, 碎文件协议), vat (Visual Audio Tool, 可用于在internet 上进行电
视电话会议的应用层协议), 以及wb (distributed White Board, 可用于网络会议的应用层协议).
-t 在每行输出中不打印时间戳
-tt 不对每行输出的时间进行格式处理(nt: 这种格式一眼可能看不出其含义, 如时间戳打印成1261798315)
-ttt tcpdump 输出时, 每两行打印之间会延迟一个段时间(以毫秒为单位)
-tttt 在每行打印的时间戳之前添加日期的打印
-u 打印出未加密的NFS 句柄(nt: handle可理解为NFS 中使用的文件句柄, 这将包括文件夹和文件夹中的文件)
-U 使得当tcpdump在使用-w 选项时, 其文件写入与包的保存同步.(nt: 即, 当每个数据包被保存时, 它将及时被写入文件中,而不是等文件的输出缓冲已满时才真正写入此文件)
-U 标志在老版本的libcap库(nt: tcpdump 所依赖的报文捕获库)上不起作用, 因为其中缺乏pcap_cump_flush()函数.
-v 当分析和打印的时候, 产生详细的输出. 比如, 包的生存时间, 标识, 总长度以及IP包的一些选项. 这也会打开一些附加的包完整性检测, 比如对IP或ICMP包头部的校验和.
-vv 产生比-v更详细的输出. 比如, NFS回应包中的附加域将会被打印, SMB数据包也会被完全解码.
-vvv 产生比-vv更详细的输出. 比如, telent 时所使用的SB, SE 选项将会被打印, 如果telnet同时使用的是图形界面,
其相应的图形选项将会以16进制的方式打印出来(nt: telnet 的SB,SE选项含义未知, 另需补充).
-w 把包数据直接写入文件而不进行分析和打印输出. 这些包数据可在随后通过-r 选项来重新读入并进行分析和打印.
-W filecount
此选项与-C 选项配合使用, 这将限制可打开的文件数目, 并且当文件数据超过这里设置的限制时, 依次循环替代之前的文件, 这相当于一个拥有filecount 个文件的文件缓冲池. 同时, 该选项会使得每个文件名的开头会出现足够多并用来占位的0, 这可以方便这些文件被正确的排序.
-x 当分析和打印时, tcpdump 会打印每个包的头部数据, 同时会以16进制打印出每个包的数据(但不包括连接层的头部).总共打印的数据大小不会超过整个数据包的大小与snaplen 中的最小值. 必须要注意的是, 如果高层协议数据没有snaplen 这么长,并且数据链路层(比如, Ethernet层)有填充数据, 则这些填充数据也会被打印.(nt: so for link layers that pad, 未能衔接理解和翻译, 需补充 )
-xx tcpdump 会打印每个包的头部数据, 同时会以16进制打印出每个包的数据, 其中包括数据链路层的头部.
-X 当分析和打印时, tcpdump 会打印每个包的头部数据, 同时会以16进制和ASCII码形式打印出每个包的数据(但不包括连接层的头部).这对于分析一些新协议的数据包很方便.
-XX 当分析和打印时, tcpdump 会打印每个包的头部数据, 同时会以16进制和ASCII码形式打印出每个包的数据, 其中包括数据链路层的头部.这对于分析一些新协议的数据包很方便.
-y datalinktype
设置tcpdump 只捕获数据链路层协议类型是datalinktype的数据包
-Z user
使tcpdump 放弃自己的超级权限(如果以root用户启动tcpdump, tcpdump将会有超级用户权限), 并把当前tcpdump的用户ID设置为user, 组ID设置为user首要所属组的ID(nt: tcpdump 此处可理解为tcpdump 运行之后对应的进程)
此选项也可在编译的时候被设置为默认打开.(nt: 此时user 的取值未知, 需补充)
v Wireshark
这个是图形界面,容易操作
v 统计模块status
在ns-3 Manual 11.7节中细讲
框架核心和2中基本的数据收集器:计数器、最小/最大/平均/总观察员,纯文本输出为omnetpp格式,数据库输出使用sqlite3.
例子在examples/stats/wifi-example-sim.cc中找到。
/* -*- Mode:C++; c-file-style:"gnu"; indent-tabs-mode:nil; -*- */
/*
* This program is free software; you can redistribute it and/or modify
* it under the terms of the GNU General Public License version 2 as
* published by the Free Software Foundation;
*
* This program is distributed in the hope that it will be useful,
* but WITHOUT ANY WARRANTY; without even the implied warranty of
* MERCHANTABILITY or FITNESS FOR A PARTICULAR PURPOSE. See the
* GNU General Public License for more details.
*
* You should have received a copy of the GNU General Public License
* along with this program; if not, write to the Free Software
* Foundation, Inc., 59 Temple Place, Suite 330, Boston, MA 02111-1307 USA
*
* Authors: Joe Kopena <tjkopena@cs.drexel.edu>
*
* This program conducts a simple experiment: It places two nodes at a
* parameterized distance apart. One node generates packets and the
* other node receives. The stat framework collects data on packet
* loss. Outside of this program, a control script uses that data to
* produce graphs presenting performance at the varying distances.
* This isn't a typical simulation but is a common "experiment"
* performed in real life and serves as an accessible exemplar for the
* stat framework. It also gives some intuition on the behavior and
* basic reasonability of the NS-3 WiFi models.
*
* Applications used by this program are in test02-apps.h and
* test02-apps.cc, which should be in the same place as this file.
*
*/
#include <ctime>
#include <sstream>
#include "ns3/core-module.h"
#include "ns3/network-module.h"
#include "ns3/mobility-module.h"
#include "ns3/wifi-module.h"
#include "ns3/internet-module.h"
#include "ns3/stats-module.h"
#include "wifi-example-apps.h"
using namespace ns3;
using namespace std;
NS_LOG_COMPONENT_DEFINE ("WiFiDistanceExperiment");
void TxCallback (Ptr<CounterCalculator<uint32_t> > datac,
std::string path, Ptr<const Packet> packet) {
NS_LOG_INFO ("Sent frame counted in " <<
datac->GetKey ());
datac->Update ();
// end TxCallback
}
//----------------------------------------------------------------------
//-- main
//----------------------------------------------
int main (int argc, char *argv[]) {
double distance = 50.0;
string format ("omnet");
string experiment ("wifi-distance-test");
string strategy ("wifi-default");
string input;
string runID;
{
stringstream sstr;
sstr << "run-" << time (NULL);
runID = sstr.str ();
}
// Set up command line parameters used to control the experiment.
CommandLine cmd;
cmd.AddValue ("distance", "Distance apart to place nodes (in meters).",
distance);
cmd.AddValue ("format", "Format to use for data output.",
format);
cmd.AddValue ("experiment", "Identifier for experiment.",
experiment);
cmd.AddValue ("strategy", "Identifier for strategy.",
strategy);
cmd.AddValue ("run", "Identifier for run.",
runID);
cmd.Parse (argc, argv);
if (format != "omnet" && format != "db") {
NS_LOG_ERROR ("Unknown output format '" << format << "'");
return -1;
}
#ifndef STATS_HAS_SQLITE3
if (format == "db") {
NS_LOG_ERROR ("sqlite support not compiled in.");
return -1;
}
#endif
{
stringstream sstr ("");
sstr << distance;
input = sstr.str ();
}
//------------------------------------------------------------
//-- Create nodes and network stacks创建节点和网络栈
//--------------------------------------------
NS_LOG_INFO ("Creating nodes.");
NodeContainer nodes;
nodes.Create (2);
NS_LOG_INFO ("Installing WiFi and Internet stack.");
WifiHelper wifi = WifiHelper::Default ();
NqosWifiMacHelper wifiMac = NqosWifiMacHelper::Default ();
wifiMac.SetType ("ns3::AdhocWifiMac");
YansWifiPhyHelper wifiPhy = YansWifiPhyHelper::Default ();
YansWifiChannelHelper wifiChannel = YansWifiChannelHelper::Default ();
wifiPhy.SetChannel (wifiChannel.Create ());
NetDeviceContainer nodeDevices = wifi.Install (wifiPhy, wifiMac, nodes);
InternetStackHelper internet;
internet.Install (nodes);
Ipv4AddressHelper ipAddrs;
ipAddrs.SetBase ("192.168.0.0", "255.255.255.0");
ipAddrs.Assign (nodeDevices);
//------------------------------------------------------------
//-- Setup physical layout使用ns3::MobilityHelper定位节点。在默认情况下,节点有静态流动性并且不能移动,所以给定距离定位有集中方法可以做到这一点,这里利用ns3::ListPositionAllocator
//--------------------------------------------
NS_LOG_INFO ("Installing static mobility; distance " << distance << " .");
MobilityHelper mobility;
Ptr<ListPositionAllocator> positionAlloc =
CreateObject<ListPositionAllocator>();
positionAlloc->Add (Vector (0.0, 0.0, 0.0));
positionAlloc->Add (Vector (0.0, distance, 0.0));
mobility.SetPositionAllocator (positionAlloc);
mobility.Install (nodes);
//------------------------------------------------------------
//-- Create a custom traffic source and sink安装流量发生器和流量接收器。
//--------------------------------------------
NS_LOG_INFO ("Create traffic source & sink.");
Ptr<Node> appSource = NodeList::GetNode (0);
Ptr<Sender> sender = CreateObject<Sender>();
appSource->AddApplication (sender);
sender->SetStartTime (Seconds (1));
Ptr<Node> appSink = NodeList::GetNode (1);
Ptr<Receiver> receiver = CreateObject<Receiver>();
appSink->AddApplication (receiver);
receiver->SetStartTime (Seconds (0));
Config::Set ("/NodeList/*/ApplicationList/*/$Sender/Destination",
Ipv4AddressValue ("192.168.0.2"));
//------------------------------------------------------------
//-- Setup stats and data collection统计数据,有四个标签:实验、战略、输入和运行
//--------------------------------------------
// Create a DataCollector object to hold information about this run.
DataCollector data;
data.DescribeRun (experiment,
strategy,
input,
runID);
// Add any information we wish to record about this run.
data.AddMetadata ("author", "tjkopena");
//计算结果是由ns3::DataCalculator对象创建的,它们附在报告或采样代码中,然后随着ns3::DataCollector注册,它们將查询其输出。一个简单的观察方式是使用现有的追踪源。这里一个计数器是直接链接到Wi-Fi MAC层目标节点的一个跟踪信号。
// Create a counter to track how many frames are generated. Updates
// are triggered by the trace signal generated by the WiFi MAC model
// object. Here we connect the counter to the signal via the simple
// TxCallback() glue function defined above.
Ptr<CounterCalculator<uint32_t> > totalTx =
CreateObject<CounterCalculator<uint32_t> >();
totalTx->SetKey ("wifi-tx-frames");
totalTx->SetContext ("node[0]");
Config::Connect ("/NodeList/0/DeviceList/*/$ns3::WifiNetDevice/Mac/MacTx",
MakeBoundCallback (&TxCallback, totalTx));
data.AddDataCalculator (totalTx);
//简单的创建计数器,记录接收到的帧数
// This is similar, but creates a counter to track how many frames
// are received. Instead of our own glue function, this uses a
// method of an adapter class to connect a counter directly to the
// trace signal generated by the WiFi MAC.
Ptr<PacketCounterCalculator> totalRx =
CreateObject<PacketCounterCalculator>();
totalRx->SetKey ("wifi-rx-frames");
totalRx->SetContext ("node[1]");
Config::Connect ("/NodeList/1/DeviceList/*/$ns3::WifiNetDevice/Mac/MacRx",
MakeCallback (&PacketCounterCalculator::PacketUpdate,
totalRx));
data.AddDataCalculator (totalRx);
//发送类产生的包数
// This counter tracks how many packets---as opposed to frames---are
// generated. This is connected directly to a trace signal provided
// by our Sender class.
Ptr<PacketCounterCalculator> appTx =
CreateObject<PacketCounterCalculator>();
appTx->SetKey ("sender-tx-packets");
appTx->SetContext ("node[0]");
Config::Connect ("/NodeList/0/ApplicationList/*/$Sender/Tx",
MakeCallback (&PacketCounterCalculator::PacketUpdate,
appTx));
data.AddDataCalculator (appTx);
//接收的包数
// Here a counter for received packets is directly manipulated by
// one of the custom objects in our simulation, the Receiver
// Application. The Receiver object is given a pointer to the
// counter and calls its Update() method whenever a packet arrives.
Ptr<CounterCalculator<> > appRx =
CreateObject<CounterCalculator<> >();
appRx->SetKey ("receiver-rx-packets");
appRx->SetContext ("node[1]");
receiver->SetCounter (appRx);
data.AddDataCalculator (appRx);
/**
* Just to show this is here...
Ptr<MinMaxAvgTotalCalculator<uint32_t> > test =
CreateObject<MinMaxAvgTotalCalculator<uint32_t> >();
test->SetKey("test-dc");
data.AddDataCalculator(test);
test->Update(4);
test->Update(8);
test->Update(24);
test->Update(12);
**/
//记录各种场景
// This DataCalculator connects directly to the transmit trace
// provided by our Sender Application. It records some basic
// statistics about the sizes of the packets received (min, max,
// avg, total # bytes), although in this scenaro they're fixed.
Ptr<PacketSizeMinMaxAvgTotalCalculator> appTxPkts =
CreateObject<PacketSizeMinMaxAvgTotalCalculator>();
appTxPkts->SetKey ("tx-pkt-size");
appTxPkts->SetContext ("node[0]");
Config::Connect ("/NodeList/0/ApplicationList/*/$Sender/Tx",
MakeCallback
(&PacketSizeMinMaxAvgTotalCalculator::PacketUpdate,
appTxPkts));
data.AddDataCalculator (appTxPkts);
//记录最小、最大、平均迁移延迟
// Here we directly manipulate another DataCollector tracking min,
// max, total, and average propagation delays. Check out the Sender
// and Receiver classes to see how packets are tagged with
// timestamps to do this.
Ptr<TimeMinMaxAvgTotalCalculator> delayStat =
CreateObject<TimeMinMaxAvgTotalCalculator>();
delayStat->SetKey ("delay");
delayStat->SetContext (".");
receiver->SetDelayTracker (delayStat);
data.AddDataCalculator (delayStat);
//------------------------------------------------------------
//-- Run the simulation
//--------------------------------------------
NS_LOG_INFO ("Run Simulation.");
Simulator::Run ();
//------------------------------------------------------------
//-- Generate statistics output.
//--------------------------------------------
// Pick an output writer based in the requested format.
Ptr<DataOutputInterface> output = 0;
if (format == "omnet") {
NS_LOG_INFO ("Creating omnet formatted data output.");
output = CreateObject<OmnetDataOutput>();
} else if (format == "db") {
#ifdef STATS_HAS_SQLITE3
NS_LOG_INFO ("Creating sqlite formatted data output.");
output = CreateObject<SqliteDataOutput>();
#endif
} else {
NS_LOG_ERROR ("Unknown output format " << format);
}
// Finally, have that writer interrogate the DataCollector and save
// the results.
if (output != 0)
output->Output (data);
// Free any memory here at the end of this example.
Simulator::Destroy ();
// end main
}
在examples/stats/wifi-example-db.sh脚本中运行用例,执行模拟,通过设置一定距离收集数据到sqlite3数据库。整个运行要十几秒。
#!/bin/sh
DISTANCES="25 50 75 100 125 145 147 150 152 155 157 160 162 165 167 170 172 175 177 180"
TRIALS="1 2 3 4 5"
echo WiFi Experiment Example
pCheck=`which sqlite3`
if [ -z "$pCheck" ]
then
echo "ERROR: This script requires sqlite3 (wifi-example-sim does not)."
exit 255
fi
pCheck=`which gnuplot`
if [ -z "$pCheck" ]
then
echo "ERROR: This script requires gnuplot (wifi-example-sim does not)."
exit 255
fi
pCheck=`which sed`
if [ -z "$pCheck" ]
then
echo "ERROR: This script requires sed (wifi-example-sim does not)."
exit 255
fi
export LD_LIBRARY_PATH=$LD_LIBRARY_PATH:bin/
if [ -e ../../data.db ]
then
echo "Kill data.db? (y/n)"
read ANS
if [ "$ANS" = "yes" -o "$ANS" = "y" ]
then
echo Deleting database
rm ../../data.db
fi
fi
for trial in $TRIALS
do
for distance in $DISTANCES
do
echo Trial $trial, distance $distance
../../waf --run "wifi-example-sim --format=db --distance=$distance --run=run-$distance-$trial"
done
done
#
#Another SQL command which just collects raw numbers of frames receved.
#
#CMD="select Experiments.input,avg(Singletons.value)
# from Singletons,Experiments
# where Singletons.run = Experiments.run AND
# Singletons.name='wifi-rx-frames'
# group by Experiments.input
# order by abs(Experiments.input) ASC;"
mv ../../data.db .
CMD="select exp.input,avg(100-((rx.value*100)/tx.value))
from Singletons rx, Singletons tx, Experiments exp
where rx.run = tx.run AND
rx.run = exp.run AND
rx.variable='receiver-rx-packets' AND
tx.variable='sender-tx-packets'
group by exp.input
order by abs(exp.input) ASC;"
sqlite3 -noheader data.db "$CMD" > wifi-default.data
sed -i.bak "s/|/ /" wifi-default.data
rm wifi-default.data.bak
gnuplot wifi-example.gnuplot
echo "Done; data in wifi-default.data, plot in wifi-default.eps"
运行结果:
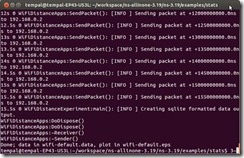
运行后可以看出多了一些分析数据文件

v Gnuplot绘图工具
具体类的继承:
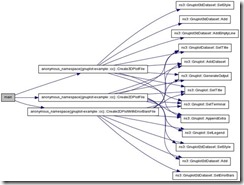
在ns-allinone-3.19/ns-3.19/src/stats/examples/gnuplot-example.cc中有示例。
/* -*- Mode:C++; c-file-style:"gnu"; indent-tabs-mode:nil; -*- */
/*
* Copyright (c) 2011 University of Washington
*
* This program is free software; you can redistribute it and/or modify
* it under the terms of the GNU General Public License version 2 as
* published by the Free Software Foundation;
*
* This program is distributed in the hope that it will be useful,
* but WITHOUT ANY WARRANTY; without even the implied warranty of
* MERCHANTABILITY or FITNESS FOR A PARTICULAR PURPOSE. See the
* GNU General Public License for more details.
*
* You should have received a copy of the GNU General Public License
* along with this program; if not, write to the Free Software
* Foundation, Inc., 59 Temple Place, Suite 330, Boston, MA 02111-1307 USA
*
* Author: Mitch Watrous (watrous@u.washington.edu)
*/
#include <fstream>
#include "ns3/gnuplot.h"
using namespace ns3;
namespace {
//===========================================================================
// Function: Create2DPlotFile
//
//
// This function creates a 2-D plot file.
//===========================================================================
void Create2DPlotFile ()
{
std::string fileNameWithNoExtension = "plot-2d";
std::string graphicsFileName = fileNameWithNoExtension + ".png";
std::string plotFileName = fileNameWithNoExtension + ".plt";
std::string plotTitle = "2-D Plot";
std::string dataTitle = "2-D Data";
// Instantiate the plot and set its title.
Gnuplot plot (graphicsFileName);
plot.SetTitle (plotTitle);
// Make the graphics file, which the plot file will create when it
// is used with Gnuplot, be a PNG file.
plot.SetTerminal ("png");
// Set the labels for each axis.
plot.SetLegend ("X Values", "Y Values");
// Set the range for the x axis.
plot.AppendExtra ("set xrange [-6:+6]");
// Instantiate the dataset, set its title, and make the points be
// plotted along with connecting lines.
Gnuplot2dDataset dataset;
dataset.SetTitle (dataTitle);
dataset.SetStyle (Gnuplot2dDataset::LINES_POINTS);
double x;
double y;
// Create the 2-D dataset.
for (x = -5.0; x <= +5.0; x += 1.0)
{
// Calculate the 2-D curve
//
// 2
// y = x .
//
y = x * x;
// Add this point.
dataset.Add (x, y);
}
// Add the dataset to the plot.
plot.AddDataset (dataset);
// Open the plot file.
std::ofstream plotFile (plotFileName.c_str());
// Write the plot file.
plot.GenerateOutput (plotFile);
// Close the plot file.
plotFile.close ();
}
//===========================================================================
// Function: Create2DPlotWithErrorBarsFile
//
//
// This function creates a 2-D plot with error bars file.
//===========================================================================
void Create2DPlotWithErrorBarsFile ()
{
std::string fileNameWithNoExtension = "plot-2d-with-error-bars";
std::string graphicsFileName = fileNameWithNoExtension + ".png";
std::string plotFileName = fileNameWithNoExtension + ".plt";
std::string plotTitle = "2-D Plot With Error Bars";
std::string dataTitle = "2-D Data With Error Bars";
// Instantiate the plot and set its title.
Gnuplot plot (graphicsFileName);
plot.SetTitle (plotTitle);
// Make the graphics file, which the plot file will create when it
// is used with Gnuplot, be a PNG file.
plot.SetTerminal ("png");
// Set the labels for each axis.
plot.SetLegend ("X Values", "Y Values");
// Set the range for the x axis.
plot.AppendExtra ("set xrange [-6:+6]");
// Instantiate the dataset, set its title, and make the points be
// plotted with no connecting lines.
Gnuplot2dDataset dataset;
dataset.SetTitle (dataTitle);
dataset.SetStyle (Gnuplot2dDataset::POINTS);
// Make the dataset have error bars in both the x and y directions.
dataset.SetErrorBars (Gnuplot2dDataset::XY);
double x;
double xErrorDelta;
double y;
double yErrorDelta;
// Create the 2-D dataset.
for (x = -5.0; x <= +5.0; x += 1.0)
{
// Calculate the 2-D curve
//
// 2
// y = x .
//
y = x * x;
// Make the uncertainty in the x direction be constant and make
// the uncertainty in the y direction be a constant fraction of
// y's value.
xErrorDelta = 0.25;
yErrorDelta = 0.1 * y;
// Add this point with uncertainties in both the x and y
// direction.
dataset.Add (x, y, xErrorDelta, yErrorDelta);
}
// Add the dataset to the plot.
plot.AddDataset (dataset);
// Open the plot file.
std::ofstream plotFile (plotFileName.c_str());
// Write the plot file.
plot.GenerateOutput (plotFile);
// Close the plot file.
plotFile.close ();
}
//===========================================================================
// Function: Create3DPlotFile
//
//
// This function creates a 3-D plot file.
//===========================================================================
void Create3DPlotFile ()
{
std::string fileNameWithNoExtension = "plot-3d";
std::string graphicsFileName = fileNameWithNoExtension + ".png";
std::string plotFileName = fileNameWithNoExtension + ".plt";
std::string plotTitle = "3-D Plot";
std::string dataTitle = "3-D Data";
// Instantiate the plot and set its title.
Gnuplot plot (graphicsFileName);
plot.SetTitle (plotTitle);
// Make the graphics file, which the plot file will create when it
// is used with Gnuplot, be a PNG file.
plot.SetTerminal ("png");
// Rotate the plot 30 degrees around the x axis and then rotate the
// plot 120 degrees around the new z axis.
plot.AppendExtra ("set view 30, 120, 1.0, 1.0");
// Make the zero for the z-axis be in the x-axis and y-axis plane.
plot.AppendExtra ("set ticslevel 0");
// Set the labels for each axis.
plot.AppendExtra ("set xlabel "X Values"");
plot.AppendExtra ("set ylabel "Y Values"");
plot.AppendExtra ("set zlabel "Z Values"");
// Set the ranges for the x and y axis.
plot.AppendExtra ("set xrange [-5:+5]");
plot.AppendExtra ("set yrange [-5:+5]");
// Instantiate the dataset, set its title, and make the points be
// connected by lines.
Gnuplot3dDataset dataset;
dataset.SetTitle (dataTitle);
dataset.SetStyle ("with lines");
double x;
double y;
double z;
// Create the 3-D dataset.
for (x = -5.0; x <= +5.0; x += 1.0)
{
for (y = -5.0; y <= +5.0; y += 1.0)
{
// Calculate the 3-D surface
//
// 2 2
// z = x * y .
//
z = x * x * y * y;
// Add this point.
dataset.Add (x, y, z);
}
// The blank line is necessary at the end of each x value's data
// points for the 3-D surface grid to work.
dataset.AddEmptyLine ();
}
// Add the dataset to the plot.
plot.AddDataset (dataset);
// Open the plot file.
std::ofstream plotFile (plotFileName.c_str());
// Write the plot file.
plot.GenerateOutput (plotFile);
// Close the plot file.
plotFile.close ();
}
} // anonymous namespace
int main (int argc, char *argv[])
{
// Create a 2-D plot file.
Create2DPlotFile();
// Create a 2-D plot with error bars file.
Create2DPlotWithErrorBarsFile();
// Create a 3-D plot file.
Create3DPlotFile();
return 0;
}
运行之后的文件:

可以分析
gnuplot plot-2d.pl,生成图片


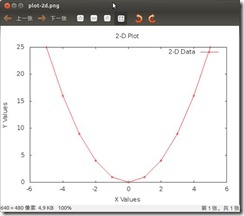
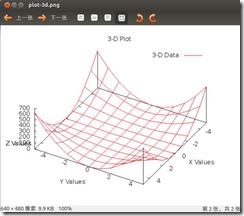
转载于:https://www.cnblogs.com/tempal/p/3798945.html
最后
以上就是阔达日记本最近收集整理的关于8、ns-3可视化工具的全部内容,更多相关8、ns-3可视化工具内容请搜索靠谱客的其他文章。


发表评论 取消回复