之前介绍的最新更新的,这是v0.1.0版本
install.packages("/lustre/user/taowlab/weir/tools/spotlight/SPOTlight-0.1.0.tar.gz",repo=NULL,type="source")
BiocManager::install("multtest")


library(Seurat)
library(dplyr)
#devtools::install_github('satijalab/seurat-data')
library(SeuratData)

## scRNAseq
# This file loads single cell experiment objects
cortex_sc <- readRDS("/lustre/user/taowlab/weir/tools/spotlight/allen_cortex_dwn.rds")
dim(cortex_sc)

cortex_sc <- Seurat::SCTransform(cortex_sc, verbose = FALSE)
cortex_sc <- Seurat::RunPCA(cortex_sc, verbose = FALSE)
cortex_sc <- Seurat::RunUMAP(cortex_sc, dims = 1:30, verbose = FALSE)
cortex_sc <- Seurat::FindNeighbors(cortex_sc, dims = 1:30, verbose = FALSE)
cortex_sc <- Seurat::FindClusters(cortex_sc, verbose = FALSE)

##spatial data
InstallData("stxBrain.SeuratData")
anterior <- LoadData("stxBrain.SeuratData", type = "anterior1")

anterior <- Seurat::SCTransform(anterior, assay = "Spatial", verbose = FALSE)
anterior <- Seurat::RunPCA(anterior, verbose = FALSE)
anterior <- Seurat::RunUMAP(anterior, dims = 1:30, verbose = FALSE)
anterior <- Seurat::FindNeighbors(anterior, dims = 1:30, verbose = FALSE)
anterior <- Seurat::FindClusters(anterior, verbose = FALSE)


## Data visualization

Seurat::DimPlot(cortex_sc, group.by = "subclass")
Seurat::SpatialDimPlot(anterior)
table(cortex_sc@meta.data$subclass)


Seurat::Idents(object = cortex_sc) <- cortex_sc@meta.data$subclass
table(cortex_sc@meta.data$subclass)
cluster_markers_all <- Seurat::FindAllMarkers(object = cortex_sc,
                                              assay = "SCT",
                                              slot = "data",
                                              verbose = TRUE,
                                              only.pos = TRUE,
                                              logfc.threshold = 1,
                                              min.pct = 0.9)
saveRDS(object = cluster_markers_all,
        file = "markers_sc.RDS")
head(cluster_markers_all)
## Run deconvolution

spotlight_ls <- spotlight_deconvolution(se_sc = cortex_sc,
                                        counts_spatial = anterior@assays$Spatial@counts,
                                        clust_vr = "subclass",# Variable in sc_seu containing the cell-type annotation
                                        cluster_markers = cluster_markers_all,
                                        cl_n = 50, # number of cells per cell type to use
                                        hvg = 3000, # Number of HVG to use
                                        ntop = NULL,
                                        transf = "uv",
                                        method = "nsNMF",
                                        min_cont = 0.09)
saveRDS(object = spotlight_ls,file = "spotlight_ls_anterior.RDS")
saveRDS(object = anterior,file = "anterior.RDS")
anterior=readRDS("anterior.RDS")
decon_mtrx <- spotlight_ls[[2]]
cell_types_all <- colnames(decon_mtrx)[which(colnames(decon_mtrx) != "res_ss")]

## Visualization
## Spatial scatterpie plot We can visualize the composition of all the spots on the tissue.
#1st add the spot composition to the metadata matrix:
anterior@meta.data <- cbind(anterior@meta.data, decon_mtrx)
#2nd Plot spot composition of all the cell types
SPOTlight::spatial_scatterpie(se_obj = anterior,
                              cell_types_all = cell_types_all,
                              img_path = "tissue_lowres_image.png",
                              pie_scale = 0.4)

#3rd show only spots containing cell types of interest
SPOTlight::spatial_scatterpie(se_obj = anterior,
                              cell_types_all = cell_types_all,
                              img_path = "tissue_lowres_image2.png",
                              cell_types_interest = "L6b",
                              pie_scale = 0.5)

SpatialFeaturePlot(anterior,
                 features = "L6b",
                 pt.size.factor = 1,
                 alpha = c(0, 1)) +
  ggplot2::scale_fill_gradientn(
      colours = heat.colors(10, rev = TRUE),
      limits = c(0, 1))

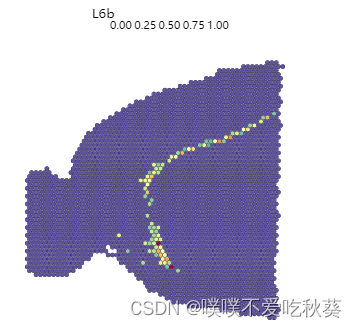
SpatialFeaturePlot(anterior,features = "L6b")

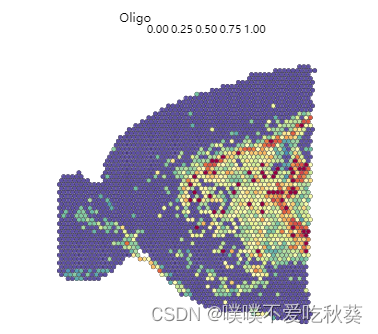
SpatialFeaturePlot(anterior,features = "Oligo")
SpatialFeaturePlot(anterior,features = "L2.3.IT")
SpatialFeaturePlot(anterior,features = "L5.IT")

#max look
decon_mtrx[1:5,]
prediction.cell.type=decon_mtrx
#dimnames(prediction.cell.type) <- list(rownames(prediction.cell.type), colnames(prediction.cell.type))
celltype= apply(prediction.cell.type[,-ncol(prediction.cell.type)], 1, function(t) colnames(prediction.cell.type)[which.max(t)])
celltype=factor(celltype,levels =unique(celltype))
celltype.data.frame=data.frame(celltype)
anterior@meta.data <- cbind(anterior@meta.data,celltype.data.frame)

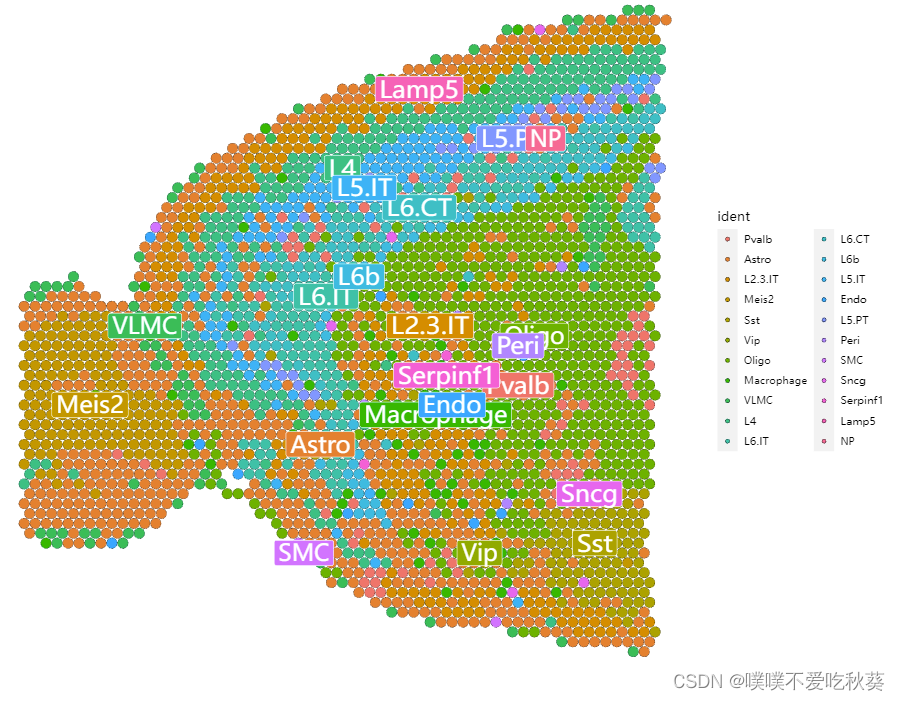
SpatialDimPlot(anterior)
table(anterior@meta.data$celltype)
head(anterior@meta.data)
DimPlot(anterior,reduction = "umap",group.by = "celltype")
color=c(colorRampPalette(brewer.pal(8,"Paired"))(8),colorRampPalette(brewer.pal(8,"Set2"))(8),colorRampPalette(brewer.pal(8,"Set3"))(6))
pdf("integration.celltype.pdf",height = 6,width = 6)
Idents(anterior)=anterior@meta.data$celltype
SpatialDimPlot(anterior,label=T)
dev.off()
如果取最大组分作为这个spot的代表,还是少了一类细胞,和seurat的结果比较还是有所不同,比如星形胶质和少突胶质细胞


最后
以上就是明亮鸵鸟最近收集整理的关于SPOTlightv0.1.0结合seurat对象的全部内容,更多相关SPOTlightv0内容请搜索靠谱客的其他文章。
本图文内容来源于网友提供,作为学习参考使用,或来自网络收集整理,版权属于原作者所有。


发表评论 取消回复