线性回归(Liner Regression)
目录
- 线性回归(Liner Regression)
- 使用矩阵来简化公式
- 计算代价函数
- 批量梯度下降
- 代价数据可视化
- 主函数
使用矩阵来简化公式
多变量的假设h表示为:
h
θ
(
x
)
=
θ
0
+
θ
1
x
1
+
θ
2
x
2
+
.
.
.
+
θ
n
x
n
h_theta(x) = theta_0 + theta_1x_1 + theta_2x_2 + ... +theta_nx_n
hθ(x)=θ0+θ1x1+θ2x2+...+θnxn
这个公式中有n + 1参数和变量,为了简化公式,我们引入x0 = 1,则公式可转化为:
h
θ
(
x
)
=
θ
0
x
0
+
θ
1
x
1
+
θ
2
x
2
+
.
.
.
+
θ
n
x
n
h_theta(x) = theta_0x_0 + theta_1x_1 + theta_2x_2 + ... +theta_nx_n
hθ(x)=θ0x0+θ1x1+θ2x2+...+θnxn
此时模型中的参数是一个n+1维的向量(即θ),任何一个训练的实例也都是一个n+1维的向量(即X),特征矩阵X的维度是m*(n+1),m是训练实例的个数。因此公式可进一步简化为:(T表示转置)
h
θ
(
x
)
=
θ
T
X
h_theta(x) = theta^text TX
hθ(x)=θTX
df = pd.read_csv('ex1data1.txt', header=None, names=['population', 'profit'])  # 读取数据并命名列名

def get_X(df):  # 读取特征
    ones = pd.DataFrame({'ones': np.ones(len(df))})  # ones是m行1列的数据框
    data = pd.concat([ones, df], axis=1)  # 在第0列增加一列ones,即x0为1
    return data.iloc[:, : -1]  # 返回的是ndarray(m * 2),数据为data除了最后一列的全部数据(最后一列为标签)

def get_y(df):  # 读取标签
    return np.array(df.iloc[:, -1])  # 取出最后一列
计算代价函数
J ( θ ) = 1 2 m ∑ i = 1 m ( h θ ( x ( i ) ) − y ( i ) ) 2 说明 : x ( i ) 指的是第 i 个训练的实例 , h θ ( x ) 的定义第一节所述 J(theta) = frac{1}{2m}sum_{i=1}^mleft(h_thetaleft(x^{(i)}right)-y^{(i)} right)^2,,,,,,,说明:x^{(i)}指的是第i个训练的实例,h_theta(x)的定义第一节所述 J(θ)=2m1i=1∑m(hθ(x(i))−y(i))2说明:x(i)指的是第i个训练的实例,hθ(x)的定义第一节所述
def lr_cost(theta, X, y):  # 计算代价函数
    """
    :param theta: 线性回归的参数θ
    :param X: 特征, m*n维矩阵, m样本数, n特征数
    :param y: 标签, m维向量
    :return: 代价函数值
    """
    m = X.shape[0]  # 样本数
    inner = X @ theta - y  # R(m * 1), X @ _theta等价于X.dot(_theta)
    square_sum = inner.T @ inner
    cost = square_sum / (2 * m)
    return cost
批量梯度下降
θ j = θ j − α ∂ ∂ θ j J ( θ ) begin{align} theta_j &= theta_j - alphafrac{partial}{partialtheta_j}J(theta) end{align} θj=θj−α∂θj∂J(θ)
注意:对于所有的j,需要同时更新θj
def gradient(theta, X, y):
    """
    计算梯度,即求J(θ)的偏导数
    :param theta: 线性回归的参数θ
    :param X: 特征, m*(n+1)维矩阵, m样本数, n特征数
    :param y: 标签, m维向量
    """
    m = X.shape[0]
    inner = X.T @ (X @ theta - y)  # (n+1)*1维
    return inner / m

def batch_gradient_decent(theta, X, y, epoch, alpha=0.01):
    """
    批量梯度下降。拟合线性回归,返回参数和代价
    :param theta: 线性回归的参数θ
    :param X: 特征, m*(n+1)维矩阵, m样本数, n特征数
    :param y: 标签, m维向量
    :param epoch: 迭代次数
    :param alpha: 学习率
    :return: 最终的参数θ和代价cost_data每次迭代的值
    """
    cost_data = [lr_cost(theta, X, y)]	# 初始的代价值
    theta_copy = theta.copy()  # 拷贝一份,不与原来的theta混淆
    for _ in range(epoch):
        grad = gradient(theta_copy, X, y)  # 计算梯度
        theta_copy = theta_copy - alpha * grad  # 更新参数
        cost_data.append(lr_cost(theta_copy, X, y))
    return theta_copy, cost_data
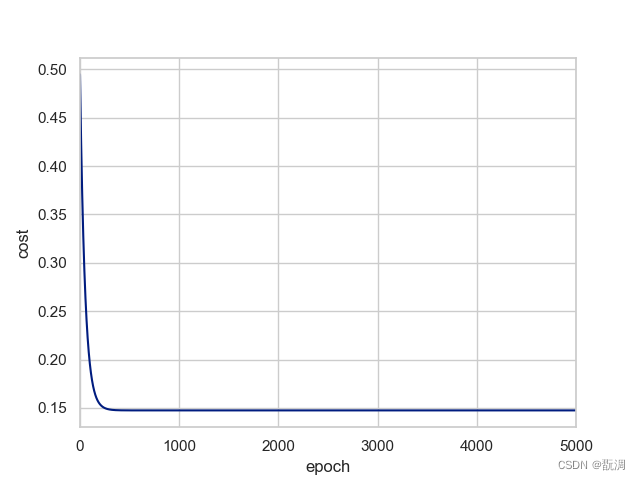
代价数据可视化
sns.tsplot(time=np.arange(len(cost_data)), data=cost_data)
plt.xlabel('epoch')
plt.ylabel('cost')
plt.show()
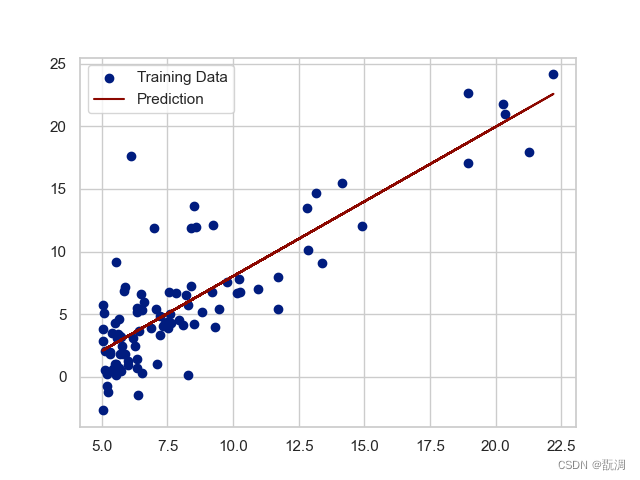
b = final_theta[0]  # 截距
k = final_theta[1]  # 斜率
plt.scatter(data['population'], data['profit'], label='Training Data')	# 散点数据
plt.plot(data['population'], k * data['population'] + b, 'r', label='Prediction')	# 训练后的拟合直线
plt.legend(loc=2)
plt.show()
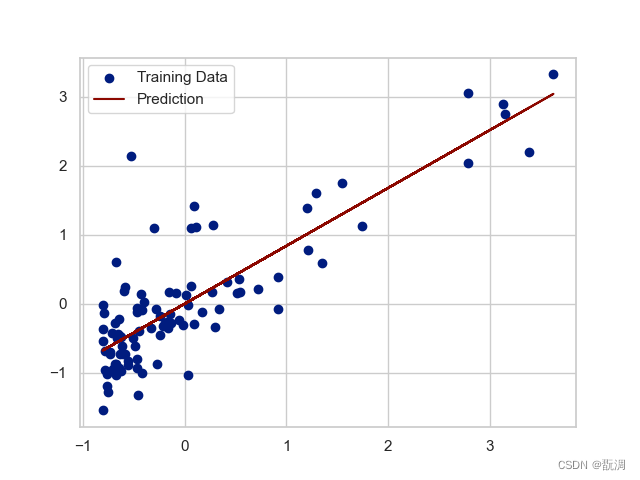
如果特征和标签的差别很大的话,我们可以对数据进行归一化处理
def normalize_feature(df):  # 归一化
    # apply函数是对dataframe的每一列进行操作
    return df.apply(lambda column: (column - column.mean()) / column.std())  # 对每一列进行处理
我们对上图进行归一化处理后得到如下图像:
主函数
if __name__ == '__main__':
    df = pd.read_csv('ex1data1.txt', header=None, names=['population', 'profit'])  # 读取数据并命名列名
    print(df.head())  # 查看前5行数据
    df.info()  # 查看数据信息
    df.describe()  # 查看数据统计信息

    '''看下原始数据'''
    sns.set(context='notebook', style='whitegrid', palette='dark')  # 设置绘图风格
    sns.lmplot('population', 'profit', df, height=6, fit_reg=False)  # 绘制散点图, fit_reg=False表示不拟合直线
    plt.show()

    data = df.copy()  # 复制一份数据
    data = normalize_feature(data)  # 归一化
    X = get_X(data)  # 获取特征
    print(X.shape)  # (97, 2)
    y = get_y(data)  # 获取标签
    print(y.shape)  # (97,)
    theta = np.zeros(X.shape[1])  # 初始化参数为0, X.shape[1] = 2, 表示特征数
    print(theta)  # [0. 0.]

    epoch = 5000  # 训练轮次
    final_theta, cost_data = batch_gradient_decent(theta, X, y, epoch)
    print(final_theta)  # 打印最终的参数
    print(cost_data)  # 打印每次的代价函数值
    print(lr_cost(final_theta, X, y))  # 打印最终的代价函数值

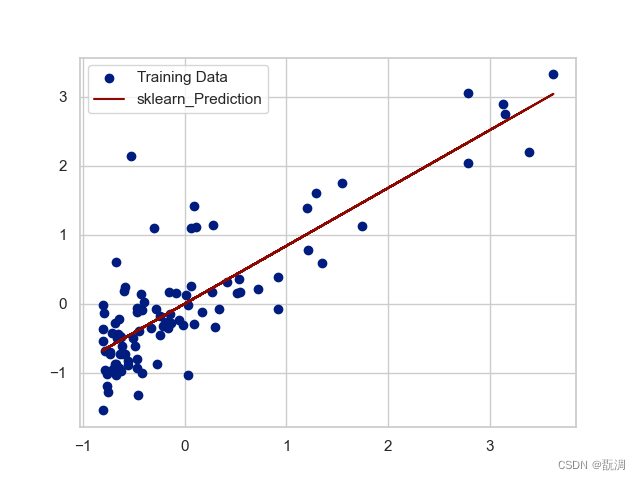
    '''和sklearn中的线性回归模型进行比较'''
    model = linear_model.LinearRegression()
    model.fit(X, y)

    x = np.array(X)[:, 1]  # 提取X的最后一列
    f = model.predict(X).flatten()  # flatten()将多维数组转换为一维数组

    plt.scatter(x, y, label='Training Data')
    plt.plot(x, f, 'r', label='sklearn_Prediction')
    plt.legend(loc=2)  # 图例位置
    plt.show()

    '''代价数据可视化'''
    sns.tsplot(time=np.arange(len(cost_data)), data=cost_data)
    plt.xlabel('epoch')
    plt.ylabel('cost')
    plt.show()

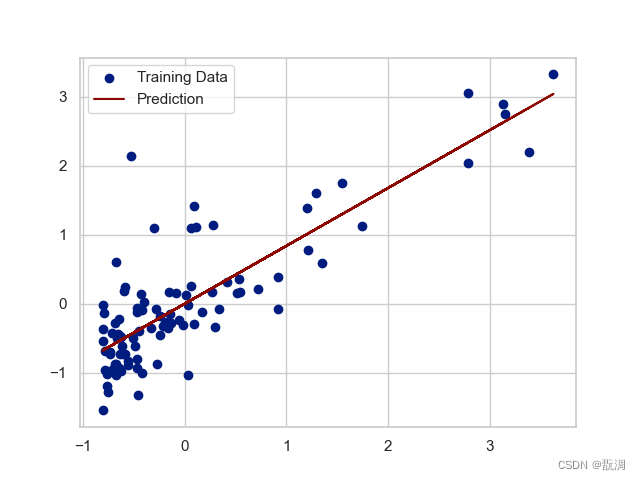
    b = final_theta[0]  # 截距
    k = final_theta[1]  # 斜率

    plt.scatter(data['population'], data['profit'], label='Training Data')
    plt.plot(data['population'], k * data['population'] + b, 'r', label='Prediction')
    plt.legend(loc=2)
    plt.show()
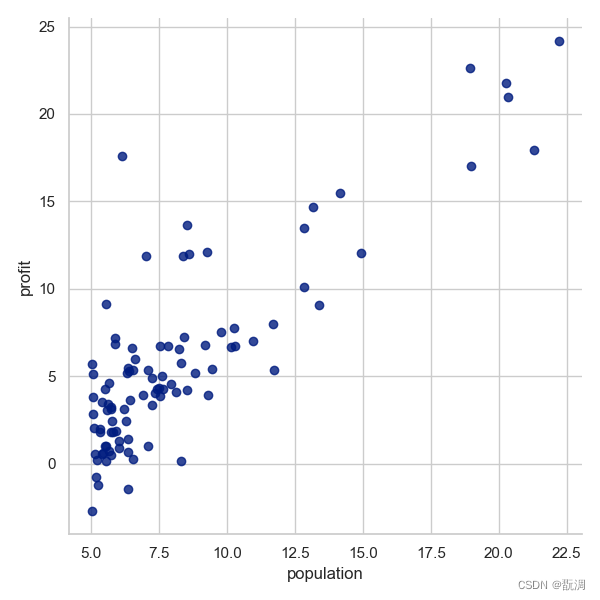
原始数据的散点图如下:
sklearn中的线性回归模型拟合效果如下:
我们自己训练5000批次的线性回归模型几乎和其一致:
参考链接: https://github.com/loveunk/machine-learning-excercise-notebook-python/blob/master/1.linear_regression/ex1.linear_regreesion.ipynb
最后
以上就是伶俐河马最近收集整理的关于机器学习——线性回归线性回归(Liner Regression)的全部内容,更多相关机器学习——线性回归线性回归(Liner内容请搜索靠谱客的其他文章。


发表评论 取消回复