解决绘图中乱码问题
plt.rcParams['font.sans-serif']=['Simhei']   # 解决中文乱码问题
plt.rcParams['axes.unicode_minus']=False   # 解决坐标轴刻度负号乱码
Pandas中的绘图类型
- Pandas通过标准约定来引用matplotlib API来实现更便捷的绘图方法。pandas的Series和DataFrame都自带绘图方法
import pandas as pd
import numpy as np
import matplotlib.pyplot as plt
plt.rc('figure', figsize=(8, 4))  # 设置图片大小,单位为英寸
线图line
Series作图
ts = pd.Series(np.random.randn(1000), index=pd.date_range('1/1/2018', periods=1000))
ts = ts.cumsum()
ts.head()
生成的Series如下:
2018-01-01   -0.218622
2018-01-02    0.800360
2018-01-03    1.032471
2018-01-04    0.770278
2018-01-05   -0.754439
Freq: D, dtype: float64
plt.figure(figsize=(8,4))
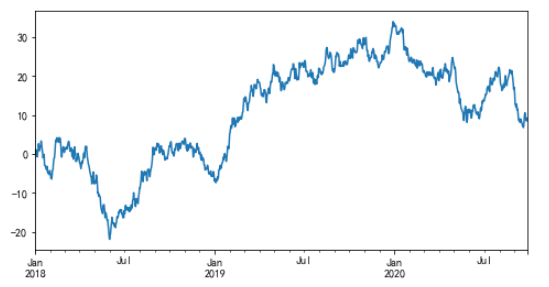
ts.plot();
- 图表的横坐标是双坐标
Series画图的参数说明
| 参数 | 说明 |
|---|---|
| kind | 可以使‘line’线图(默认);’bar’垂直柱状图; ’barh’水平柱状; 'hist’直方图; 'box’箱线图; 'kde’或者’desity’密度图; 'area’区域图; 'scatter’散点图;‘hexbin’六角形图; pie’饼图 |
| figsize | 元组形式表示图的大小,单位为英寸 |
| use_index | 是否用索引作x轴,默认为True |
| title | 标题 |
| grid | 是否显示网格,默认为None |
| legend | 是否显示图例,False/True/‘reverse’ |
| label | 用于图例的标签 |
| ax | Subplot对象,默认为当前对象 |
| style | 传给matlibplot的风格字符串,如’ko–’;list或dict的形式表示每列的style |
| alpha | 图表的填充不透明度(0-1之间) |
| xtick | X轴刻度值 |
| xlim | X轴界线,如[0,100] |
- s.plot(kind=‘line’) 等价于 s.plot.line()
- s.plot(kind=‘bar’) 等价于 s.plot.bar()
- s.plot(kind=‘hist’) 等价于 s.plot.hist()
- …
ts.plot.line() # 图形与上图一样
DataFrame 作图
df = pd.DataFrame(np.random.randn(100, 4).cumsum(0), columns=list('ABCD'), index=np.arange(0, 100, 1))
df.head()
生成的DaraFrame如下:
		A			B			C			D
0	0.408464	0.122632	1.285822	-0.074799
1	0.174366	-0.839241	0.791051	1.290122
2	-0.365918	-1.897591	-0.687835	0.081802
3	1.696604	-1.908418	-1.002529	-0.308029
4	2.693575	-2.039872	-1.726345	0.863233
df.plot();
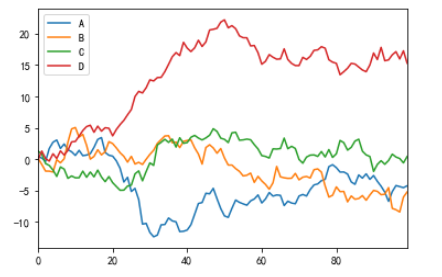
DataFrame画图及其参数说明
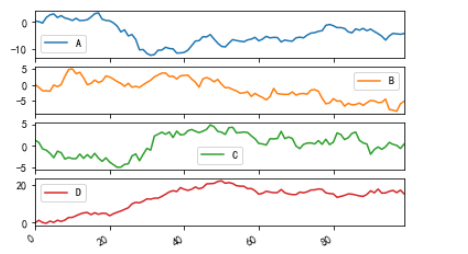
DataFrame还有一些用于对列进行灵活处理的选项,例如,要将所有列都绘制到一个subplot中还是创建各自的subplot。参数如下表:
| 参数 | 说明 |
|---|---|
| subplots | 将各个DataFrame列绘制到单独的subplot中 |
| sharex | 如果subplots=True,则共用同一个X轴,包括刻度和界限 |
| sharey | 类似于上 |
| figsize | 表示图像大小的元组 |
| title | 表示图像标题的字符串 |
| legend | 添加一个subplot图例(默认为True) |
| sort_columns | 以字母表顺序绘制各列,默认使用前列顺序 |
df.plot(subplots=True,
		# layout = (2,3),
		figsize = (12,6),
		# sharex = False
		);
直方图hist
np.random.seed(2017)
s = pd.Series(np.random.randn(1000))
s.plot(kind='hist',
	   figsize=(5,3),
	   ylim=[0,300],
	   bins = 20);
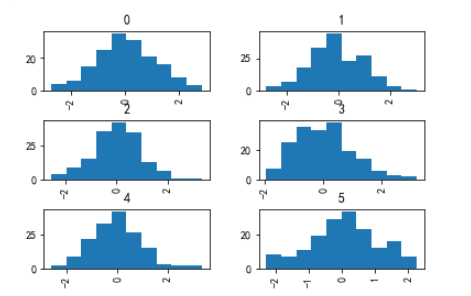
data = pd.Series(np.random.randn(1000))
data.hist(by = np.random.randint(0,6,1000),figsize = (6,4));
饼图pie
s = pd.Series(np.random.randint(70, size=5), index = ['CN', 'US', 'UK', 'IN', 'CA'])
plt.figure(figsize=(4, 4))  # 饼图是圆的!
s.plot(kind='pie',
	   label=' ',
	   title='% of revenue by Country',
	   legend=False,
       colors=['r', 'g', 'b', 'c', 'y'],
       fontsize=12,
       figsize=(4, 4),
       autopct='%.2f');
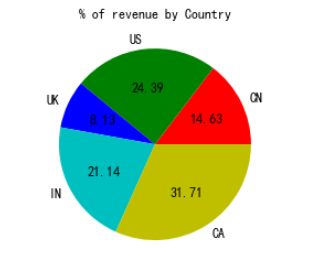
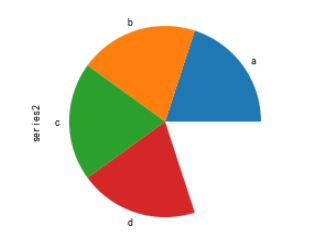
注: 如果传入的数据和小于1,则画出来是半圆
series = pd.Series([0.2] * 4, index=['a', 'b', 'c', 'd'], name='series2')
series.plot.pie(figsize=(4, 4));
条形图bar
Series做条形图
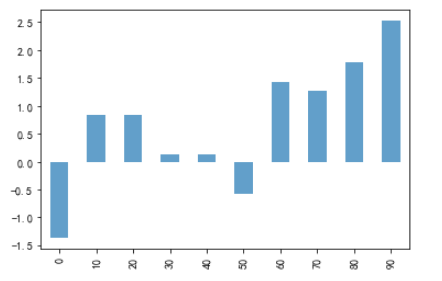
s = pd.Series(np.random.randn(10).cumsum(), index = range(0,100,10))
s = s * -1
s.plot(kind='bar', alpha=0.7)  # alpha表示图的透明度
plt.show()
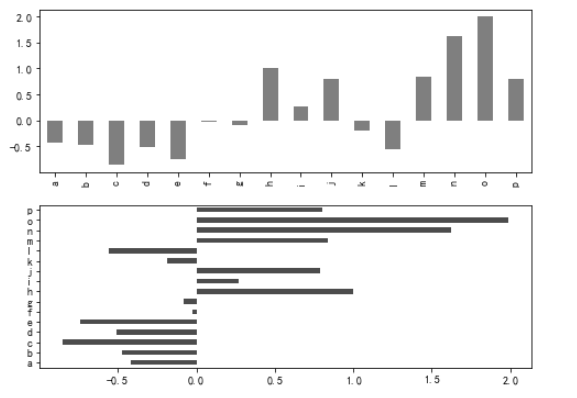
data = pd.Series(np.random.randn(16), index=list('abcdefghijklmnop'))

fig, axes = plt.subplots(2, 1, figsize=(8,6))
data.plot(kind='bar', ax=axes[0], color='k', alpha=0.5)
data.plot(kind='barh', ax=axes[1], color='k', alpha=0.7)
plt.show()
DataFrame做条形图
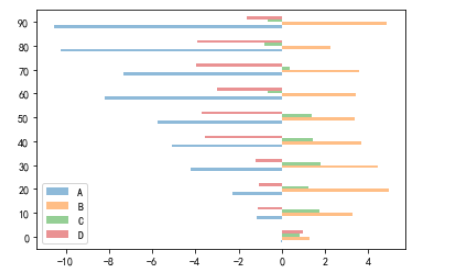
df = pd.DataFrame(np.random.randn(10, 4).cumsum(0), columns=list('ABCD'), index=np.arange(0, 100, 10))
df.plot(kind = 'barh',
		# title = "% of revenue by Country",
		# alpha = 0.5,
		stacked = True,
		# grid = True);
区域图area
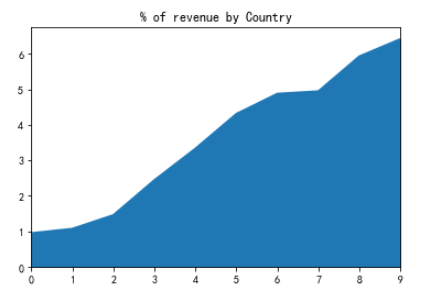
s = pd.Series(np.random.rand(10).cumsum())
s.plot(kind = "area",
		title = "% of revenue by Country",
		stack = True)
密度图kde
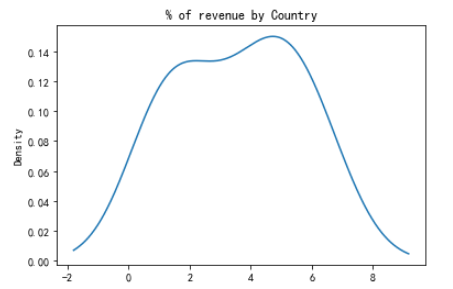
s.plot(kind = "kde",title = "% of revenue by Country");
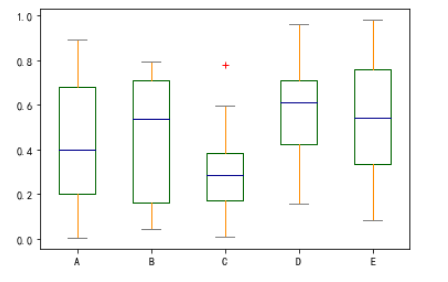
箱线图box
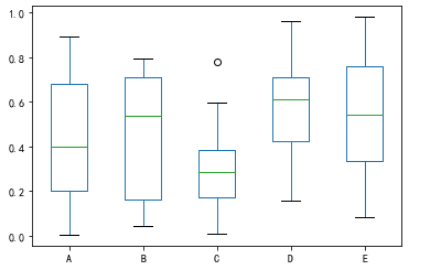
df = pd.DataFrame(np.random.rand(10,5),columns = ["A","B","C","D","E"])
df.plot(kind = "box");
color = dict(boxes='DarkGreen', whiskers='DarkOrange', medians='DarkBlue', caps='Gray')
df.plot(kind = "box",
		color=color,
		# vert = False,
		# positions = [1,4,5,6,8],
		sym='r+');
散点图scatter
df = pd.DataFrame(np.random.rand(50,4),columns = ['a','b','c','d'])
df.plot(kind = "scatter",
		x = 'a',
		y = 'b',
		s = df['c']*200);  # 点的大小
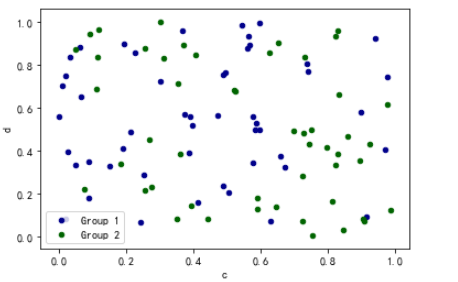
- ax : Subplot对象,默认为当前对象
ax = df.plot.scatter(x='a', y='b', color='DarkBlue', label='Group 1')
df.plot.scatter(x='c', y='d', color='DarkGreen', label='Group 2', ax=ax);
六角形hexbin
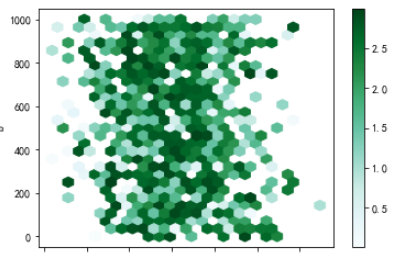
- 数据过于密集,无法单独绘制每一个点,那么Hexbin是一个不错的选择
df = pd.DataFrame(np.random.randn(1000, 2), columns=['a', 'b'])
df['b'] = df['b'] + np.arange(1000)
df.plot(kind = 'scatter',x = 'a',y = 'b')
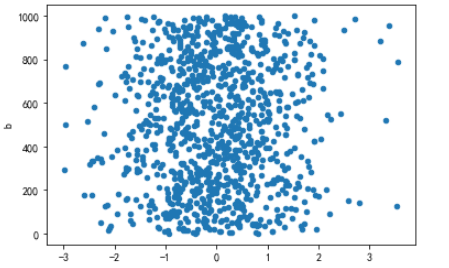
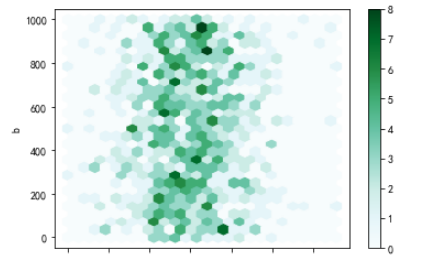
图片中的点过于密集而无法反应数据间的关系,此时将图形调整为hexbin
df.plot(kind = 'hexbin',
		x = 'a',
		y = 'b',
		gridsize = 25);
df = pd.DataFrame(np.random.randn(1000, 2), columns=['a', 'b'])
df['b'] = df['b'] + np.arange(1000)
df['z'] = np.random.uniform(0, 3, 1000)
df.plot.hexbin(x='a', y='b', C='z', reduce_C_function=np.max, gridsize=25); # 将C的只作为每一个hexagons颜色深浅的计算值,默认计算函数是count
双坐标图
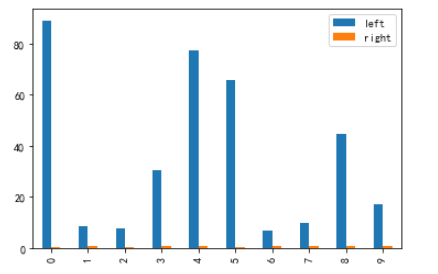
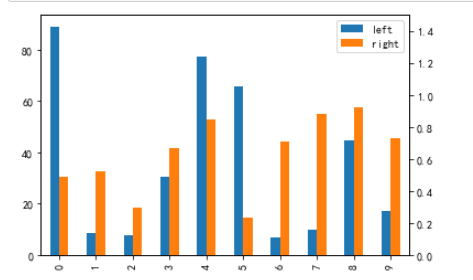
- 一般在图表中有两个系列及其以上的数据,并且他们的量纲不同或者数据差别很大时,AI同一纵坐标轴下无法很好地展现原本的面貌,这时就采用双坐标图来绘制。
df = pd.DataFrame(np.random.rand(10, 2), columns=["left", "right"])
df["left"] *= 100
df.plot(kind = 'bar')
第一种方法
ax = df.plot(kind = 'bar')
ax2 = ax.twinx()
for r in ax.patches[len(df):]:
	r.set_transform(ax2.transData)
ax2.set_ylim(0,1.5)
df = pd.DataFrame(np.random.randn(100, 4).cumsum(0), columns=list('ABCD'), index=np.arange(0, 100, 1))
第二种方法
df.A.plot()
df.B.plot(secondary_y=True, style='g');
第三种方法
df.plot(secondary_y=['A', 'B'],
#         mark_right=False,  # To turn off the automatic marking
#         legend=False
       );
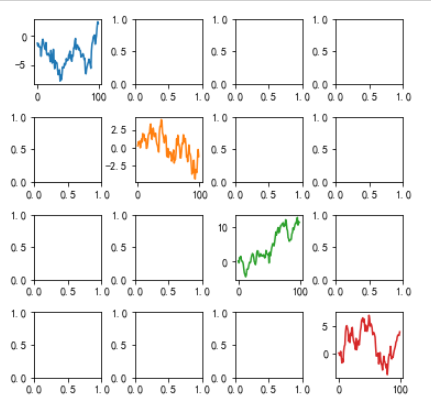
- 将图像答应在对角线上
fig, axes = plt.subplots(4, 4, figsize=(6, 6));

plt.subplots_adjust(wspace=0.5, hspace=0.5)
target1 = [axes[0][0], axes[1][1], axes[2][2], axes[3][3]]
df.plot(subplots=True, ax=target1, legend=False, sharex=False, sharey=False);
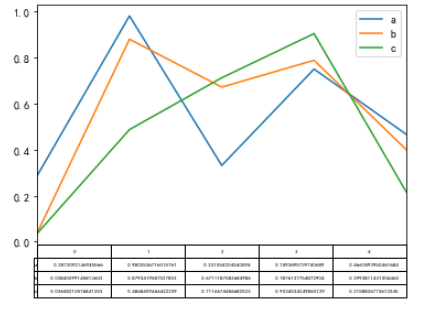
将数据表格打印在图上
fig, ax = plt.subplots(1, 1)
df = pd.DataFrame(np.random.rand(5, 3), columns=['a', 'b', 'c'])
ax.get_xaxis().set_visible(False)   # Hide Ticks
df.plot(table=True,
		# table = np.round(df.T,2),
		 ax=ax);
from pandas.plotting import table
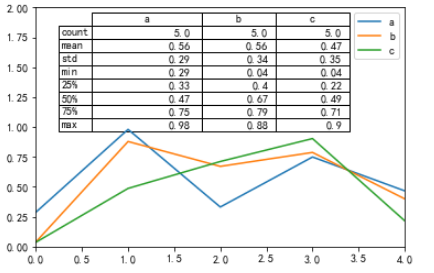
fig, ax = plt.subplots(1,1)
table(ax, np.round(df.describe(),2),
	  loc = 'upper center',
	  # loc = 'upper right',
	  colWidths = [0.3,0.2,0.2])
df.plot(ax = ax,ylim = (0,2),legend = 'best');
参看文档
Pandas数据可视化
最后
以上就是甜甜手套最近收集整理的关于数据可视化之pandas绘图解决绘图中乱码问题Pandas中的绘图类型参看文档的全部内容,更多相关数据可视化之pandas绘图解决绘图中乱码问题Pandas中内容请搜索靠谱客的其他文章。
本图文内容来源于网友提供,作为学习参考使用,或来自网络收集整理,版权属于原作者所有。

![[OpenCV学习日记-java]-引言引言](https://www.shuijiaxian.com/files_image/reation/bcimg14.png)


发表评论 取消回复