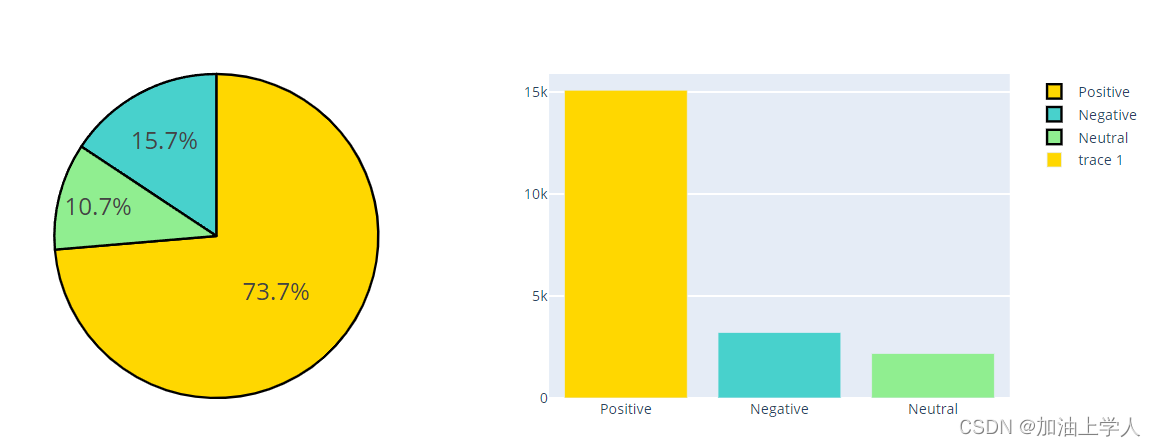
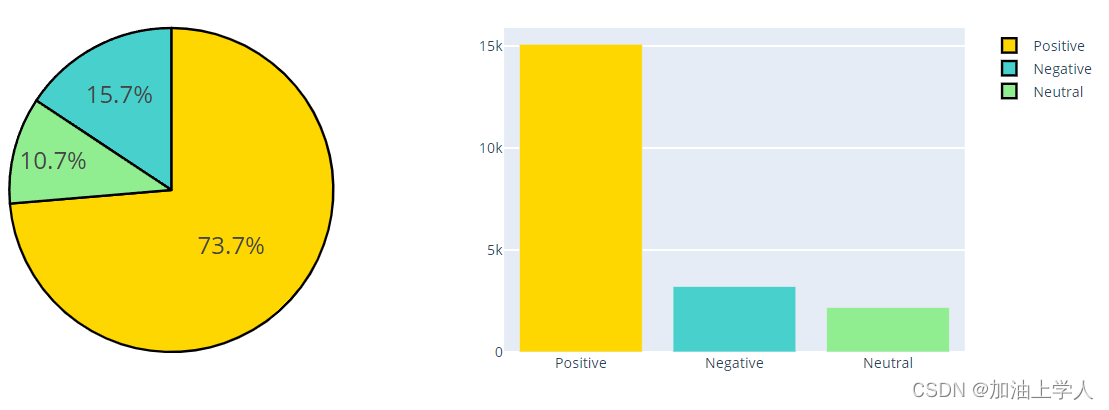
第一次使用plotly绘制图像,效果很惊艳,但是也有很多问题,比如标签时怎么生成的,分类是根据什么来的,看了一天的文档看得一脸懵逼…同时遇到了add_trace后出现trace标签的问题,给出原来的代码和改进后的代码,以供参考。
fig = make_subplots(rows=1, cols=2, specs=[[{"type": "pie"}, {"type": "bar"}]])
colors = ['gold', 'mediumturquoise', 'lightgreen']
# 绘制饼状图
fig.add_trace(go.Pie(labels=df.label_name.value_counts().index,
                             values=df.label.value_counts().values,name="pie"), row=1, col=1)

fig.update_traces(hoverinfo='label+percent', textfont_size=20,
                  marker=dict(colors=colors, line=dict(color='#000000', width=2)))
# 绘制柱状图
fig.add_trace(go.Bar(x=df.label_name.value_counts().index, y=df.label.value_counts().values,
                     marker_color=colors),row=1,col=2)
fig.show()
注意看右侧legend,会多出一个trace1,这个trace1是add_trace(go.Bar())带来的。

改后的代码:
fig = make_subplots(rows=1, cols=2, specs=[[{"type": "pie"}, {"type": "bar"}]])
colors = ['gold', 'mediumturquoise', 'lightgreen']
# 绘制饼状图
fig.add_trace(go.Pie(labels=df.label_name.value_counts().index,
                             values=df.label.value_counts().values,name="pie"), row=1, col=1)

fig.update_traces(hoverinfo='label+percent', textfont_size=20,
                  marker=dict(colors=colors, line=dict(color='#000000', width=2)))
# 绘制柱状图
fig.add_trace(go.Bar(x=df.label_name.value_counts().index, y=df.label.value_counts().values,
                     marker_color=colors),row=1,col=2)
# 选择第二个trace,并将其设置为不显示(官方文档看得脑壳疼啊)
fig.update_traces(selector=dict(type='bar'),showlegend=False)
fig.show()

这是官网给出的方法,可能是我没有看懂,麻烦看懂的也给解释一下:
fig.update_traces(hovertemplate=<VALUE>, selector=dict(type='bar'))
Anything contained in tag `<extra>` is displayed in the secondary box,
for example "<extra>{fullData.name}</extra>". To hide the secondary box
completely, use an empty tag `<extra></extra>`.
最后
以上就是美丽小蘑菇最近收集整理的关于plotly中trace标签去除的全部内容,更多相关plotly中trace标签去除内容请搜索靠谱客的其他文章。
本图文内容来源于网友提供,作为学习参考使用,或来自网络收集整理,版权属于原作者所有。


发表评论 取消回复