转载:https://blog.csdn.net/weixin_42749944/article/details/115026810
df = pd.read_excel(r'./file.xlsx')

fig, ax1 = plt.subplots()
width = 0.4
x1_list = []
x2_list = []

for i in range(len(df)):
    x1_list.append(i)
    x2_list.append(i + width)

b1 = ax1.bar(x1_list, df['a'],width=width,label='a',color = sns.xkcd_rgb["pale red"],tick_label = df.index)

ax2 = ax1.twinx()
b2 = ax2.bar(x2_list, df['b'],width=width,label='b',color = sns.xkcd_rgb["denim blue"],tick_label = df.index)

#ax1.set_title('',fontsize = 14)
ax1.set_xlabel('1',fontsize=12)
ax1.set_ylabel('a(m)',fontsize=12)
ax2.set_ylabel('b($km^{3}$)',fontsize=12)

#ax1.set_xticklabels(ax1.get_xticklabels(),rotation = 25)
ax1.set_xticklabels(['2010','2011','2012','2013','2014','2015','2016','2017','2018','2019','2020'],fontsize = 10)

ax1.yaxis.label.set_color(b1[0].get_facecolor())
ax2.yaxis.label.set_color(b2[0].get_facecolor())

ax1.tick_params(axis = 'y', colors = b1[0].get_facecolor())
ax2.tick_params(axis = 'y', colors = b2[0].get_facecolor())

plt.axhline(y=0, ls='--', c='k')

plt.legend(handles = [b1,b2])

# plt.savefig('fig.png', dpi=200,bbox_inches = 'tight')

plt.show()
双轴零点不在同一条水平线上:

但是我想要双轴起点相同,调整Y轴取值范围:
ax2.set_ylim(1, 2)

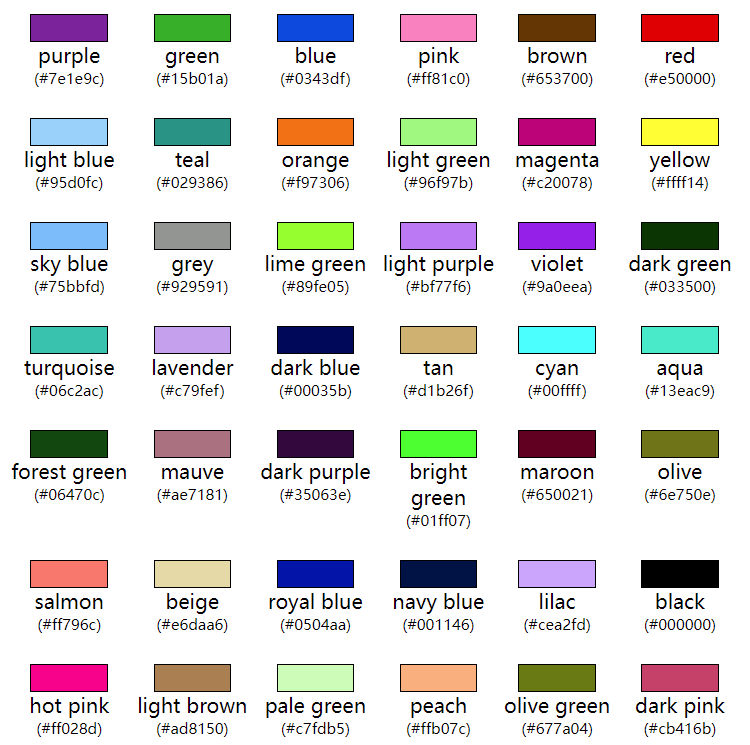
关于颜色设置:seaborn.xkcd_palette
https://xkcd.com/color/rgb/

最后
以上就是成就未来最近收集整理的关于python-绘制双轴柱状图的全部内容,更多相关python-绘制双轴柱状图内容请搜索靠谱客的其他文章。
本图文内容来源于网友提供,作为学习参考使用,或来自网络收集整理,版权属于原作者所有。


发表评论 取消回复