学习内容
scatter—hist联合图
import numpy as np
import matplotlib.pyplot as plt
import matplotlib.patches as mp

x = np.random.randn(200)
y = x + np.random.randn(200) * 0.5#产生正相关的随机数

margin_border = 0.1
width = 0.6
margin_between = 0.02
height = 0.2
#因为需要产生三幅图,使用到plt.axes([left,bottom,width,height])
#而三个数据均在0-1之间,所以这个是按比例放缩的一个数据

plt.style.use('ggplot')#填充效果
left_down = margin_border
bottom_down = margin_border
height_down = width
width_down = width#图中左下方的图像数据

left_up = margin_border
bottom_up = margin_border + width + margin_between
height_up = height
width_up = width#最上面图像数据

left_right = margin_border + width + margin_between
bottom_right = margin_border
height_right = width
width_right = height#最右面图像的数据

plt.figure()#产生正方形,8×8的数据

rect_up = [left_up,
           bottom_up, width_up,
           height_up]
rect_down = [left_down,
             bottom_down,
             width_down,
             height_down]
rect_right = [left_right,
              bottom_right, width_right,
              height_right]
axscatter_down = plt.axes(rect_down)
axhist_up = plt.axes(rect_up)
axhist_right = plt.axes(rect_right)
#上面通过列表写入数据,调用到plt.axes()函数中去
axhist_right.set_yticks([])
axhist_up.set_xticks([])#隐藏重叠轴线
axscatter_down.scatter(x, y)
bin_width = 0.25#hist需要bins设置,以下是设置bins(分搁块)
xymax = np.max([np.max(np.fabs(x)), np.max(np.fabs(y))])
lim = int(xymax / bin_width + 1) * bin_width#通过求出最大的bin宽,估算出整个长度
axhist_up.set_xlim(-lim, lim)
axhist_right.set_ylim(-lim, lim)#设置长度
bins = np.arange(-lim, lim + bin_width, bin_width)

axhist_up.hist(x, bins=bins)
axhist_right.hist(y, bins=bins,orientation='horizontal')
#水平作图,需要加上horizontal,表示垂直

plt.show()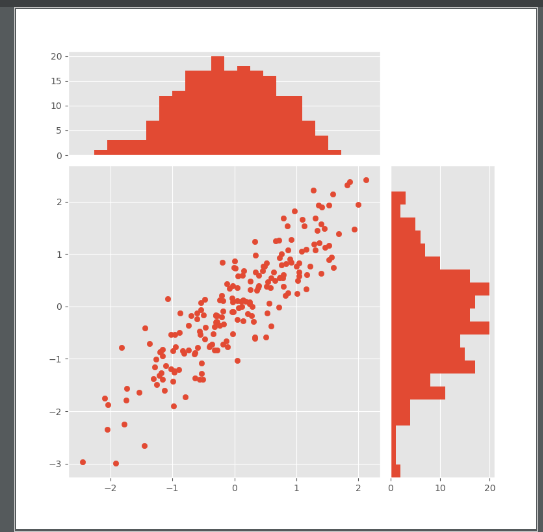
最后
以上就是健忘音响最近收集整理的关于python_matplotlib DAY_22(4)scatter-hist图画的全部内容,更多相关python_matplotlib内容请搜索靠谱客的其他文章。
本图文内容来源于网友提供,作为学习参考使用,或来自网络收集整理,版权属于原作者所有。


发表评论 取消回复