欢迎关注WX公众号:【程序员管小亮】
plt.subplot()函数用于直接指定划分方式和位置进行绘图。
M A T L A B MATLAB MATLAB和 p y p l o t pyplot pyplot有当前的图形( f i g u r e figure figure)和当前的轴( a x e s axes axes)的概念,所有的作图命令都是对当前的对象作用。可以通过 g c a ( ) gca() gca()获得当前的轴( a x e s axes axes),通过 g c f ( ) gcf() gcf()获得当前的图形( f i g u r e figure figure)。
# 使用plt.subplot来创建小图. plt.subplot(221)表示将整个图像窗口分为2行2列, 当前位置为1.
plt.subplot(221)
# plt.subplot(222)表示将整个图像窗口分为2行2列, 当前位置为2.
plt.subplot(222) # 第一行的右图
# plt.subplot(223)表示将整个图像窗口分为2行2列, 当前位置为3.
plt.subplot(223)
# plt.subplot(224)表示将整个图像窗口分为2行2列, 当前位置为4.
plt.subplot(224)
注意:其中各个参数也可以用逗号,分隔开。第一个参数代表子图的行数;第二个参数代表该行图像的列数; 第三个参数代表每行的第几个图像。
import numpy as np
import matplotlib.pyplot as plt
def f(t):
return np.exp(-t) * np.cos(2*np.pi*t)
t1 = np.arange(0.0, 5.0, 0.1)
t2 = np.arange(0.0, 5.0, 0.02)
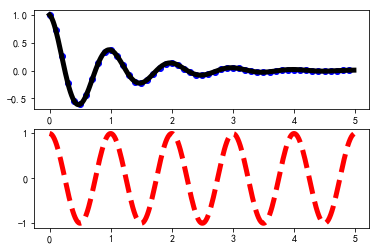
plt.figure(1)
plt.subplot(211)
plt.plot(t1, f(t1), 'bo', t2, f(t2), 'k')
plt.subplot(212)
plt.plot(t2, np.cos(2*np.pi*t2), 'r--')
plt.show()
如果不指定
f
i
g
u
r
e
(
)
figure()
figure()的轴,
f
i
g
u
r
e
(
1
)
figure(1)
figure(1)命令默认会被建立,同样的如果你不指定
s
u
b
p
l
o
t
(
n
u
m
r
o
w
s
,
n
u
m
c
o
l
s
,
f
i
g
n
u
m
)
subplot(numrows, numcols, fignum)
subplot(numrows,numcols,fignum)的轴,
s
u
b
p
l
o
t
(
111
)
subplot(111)
subplot(111)也会自动建立。
import matplotlib.pyplot as plt
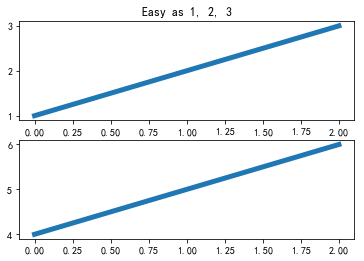
plt.figure(1) # 创建第一个画板(figure)
plt.subplot(211) # 第一个画板的第一个子图
plt.plot([1, 2, 3])
plt.subplot(212) # 第二个画板的第二个子图
plt.plot([4, 5, 6])
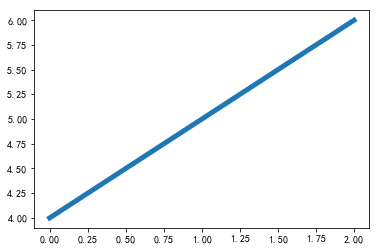
plt.figure(2) # 创建第二个画板
plt.plot([4, 5, 6]) # 默认子图命令是subplot(111)
plt.figure(1) # 调取画板1; subplot(212)仍然被调用中
plt.subplot(211) # 调用subplot(211)
plt.title('Easy as 1, 2, 3') # 做出211的标题
python课程推荐。

最后
以上就是彩色早晨最近收集整理的关于plt.subplot()函数解析(最清晰的解释)欢迎关注WX公众号:【程序员管小亮】的全部内容,更多相关plt.subplot()函数解析(最清晰内容请搜索靠谱客的其他文章。


发表评论 取消回复