我是靠谱客的博主 专一马里奥,这篇文章主要介绍matplotlib animation FuncAnimation画2D线图matplotlib animation FuncAnimation画2D线图,现在分享给大家,希望可以做个参考。
matplotlib animation FuncAnimation画2D线图
觉得有用的话,欢迎一起讨论相互学习~


效果图
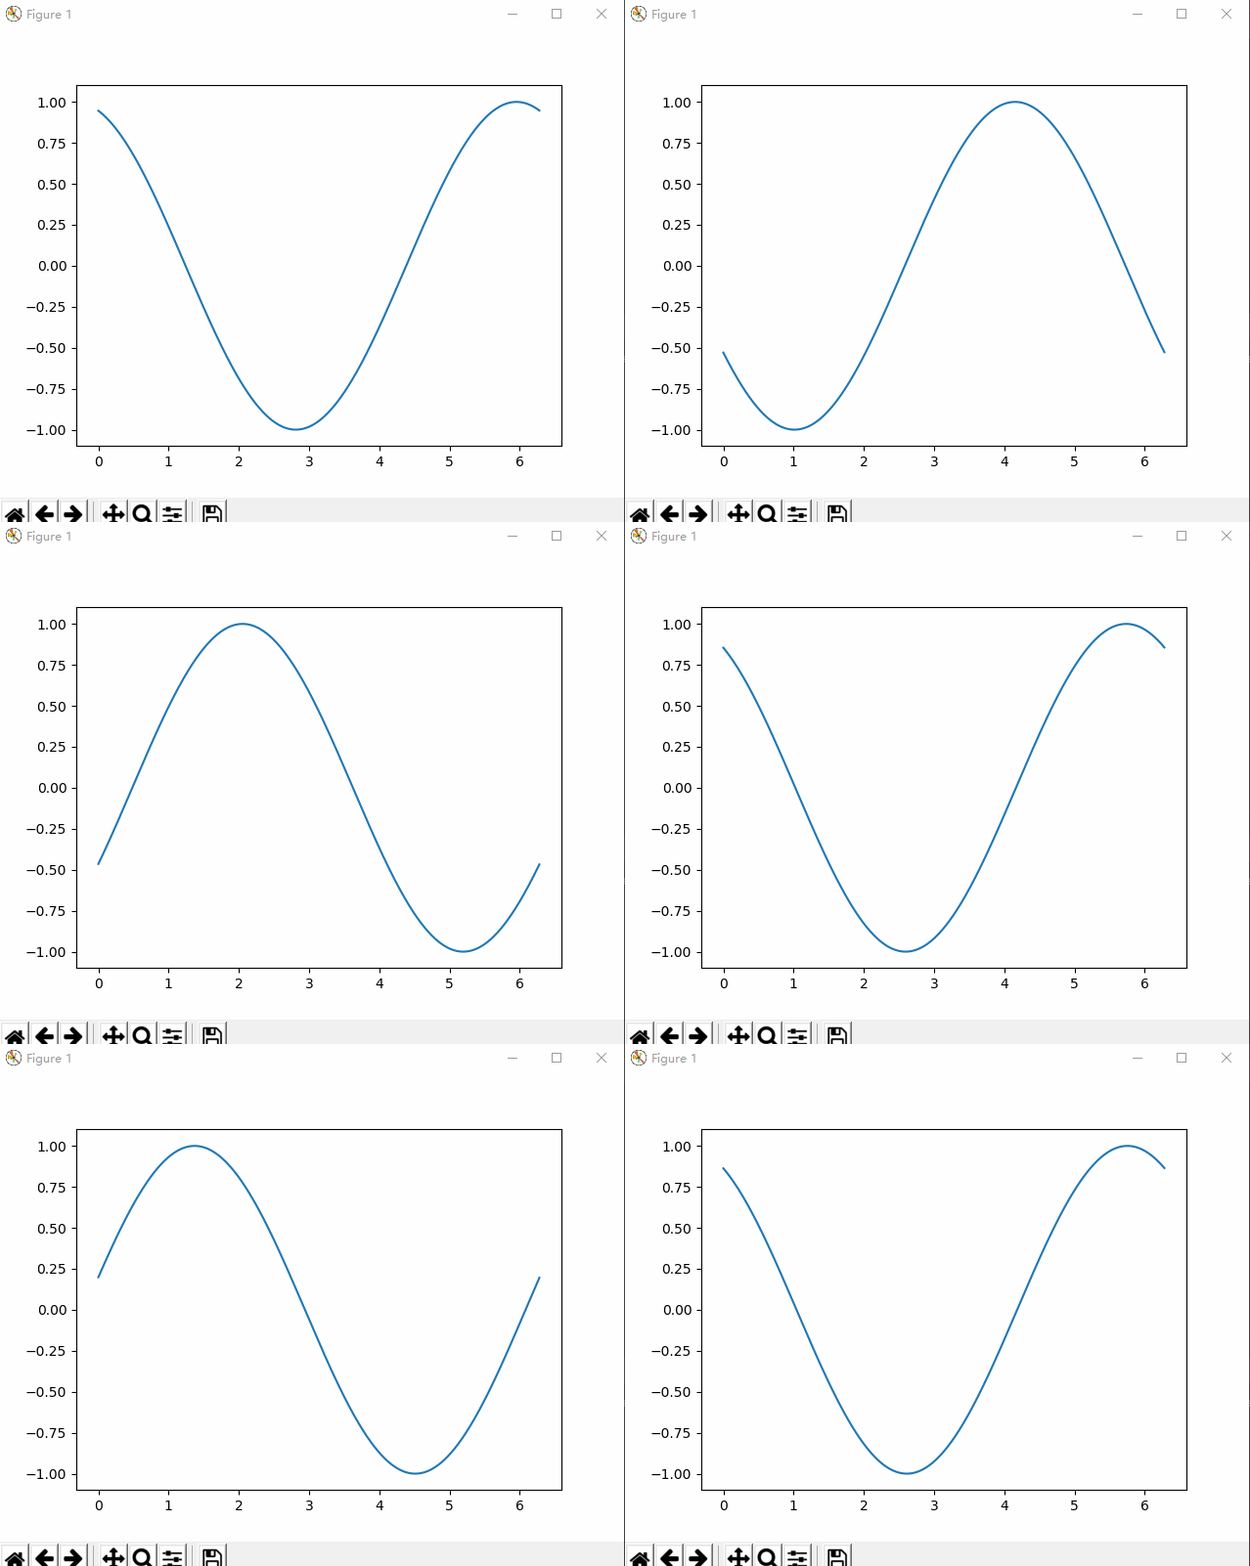
代码
import numpy as np
from matplotlib import pyplot as plt
from matplotlib import animation

fig, ax = plt.subplots()
# 生成子图,相当于fig = plt.figure(),
# ax = fig.add_subplot(),其中ax的函数参数表示把当前画布进行分割,
# 例:fig.add_subplot(2,2,2).表示将画布分割为两行两列,ax在第2个子图中绘制,其中行优先。
x = np.arange(0, 2*np.pi, 0.01)  # 表示从0~2*np.pi之间每隔0.01取一个点
line, = ax.plot(x, np.sin(x))  # 注意,这里line后面要加上逗号,表示一个具有一个元素的元组


# print(type(line))
# print(type((line,)))
# <class 'matplotlib.lines.Line2D'>
# <class 'tuple'>

def animate(i):  # 这里的i其实就是参数0-99,即时frames控制的参数,控制程序画图变换的次数
    # print(i)  # 0-99
    line.set_ydata(np.sin(x + i/10.0))  # 改变线条y的坐标值
    return line,


def init():  # 初始化函数,图形开始显示的状态
    line.set_ydata(np.sin(x))
    return line,


ani = animation.FuncAnimation(fig=fig, func=animate, frames=100, init_func=init,interval=20, blit=False)
"""frames设定帧数,总共执行100个update就会进行下一次循环,并且frames还会作为参数传入animate()函数,init_func设定初始函数图像,
interval设置更新间隔此处设置为20毫秒,(仔细想想20毫秒其实是很小的一个间隔)
blit如果是只有变化了的像素点才更新就设置为True,如果是整张图片所有像素点全部更新的话就设置为False
"""
plt.show()
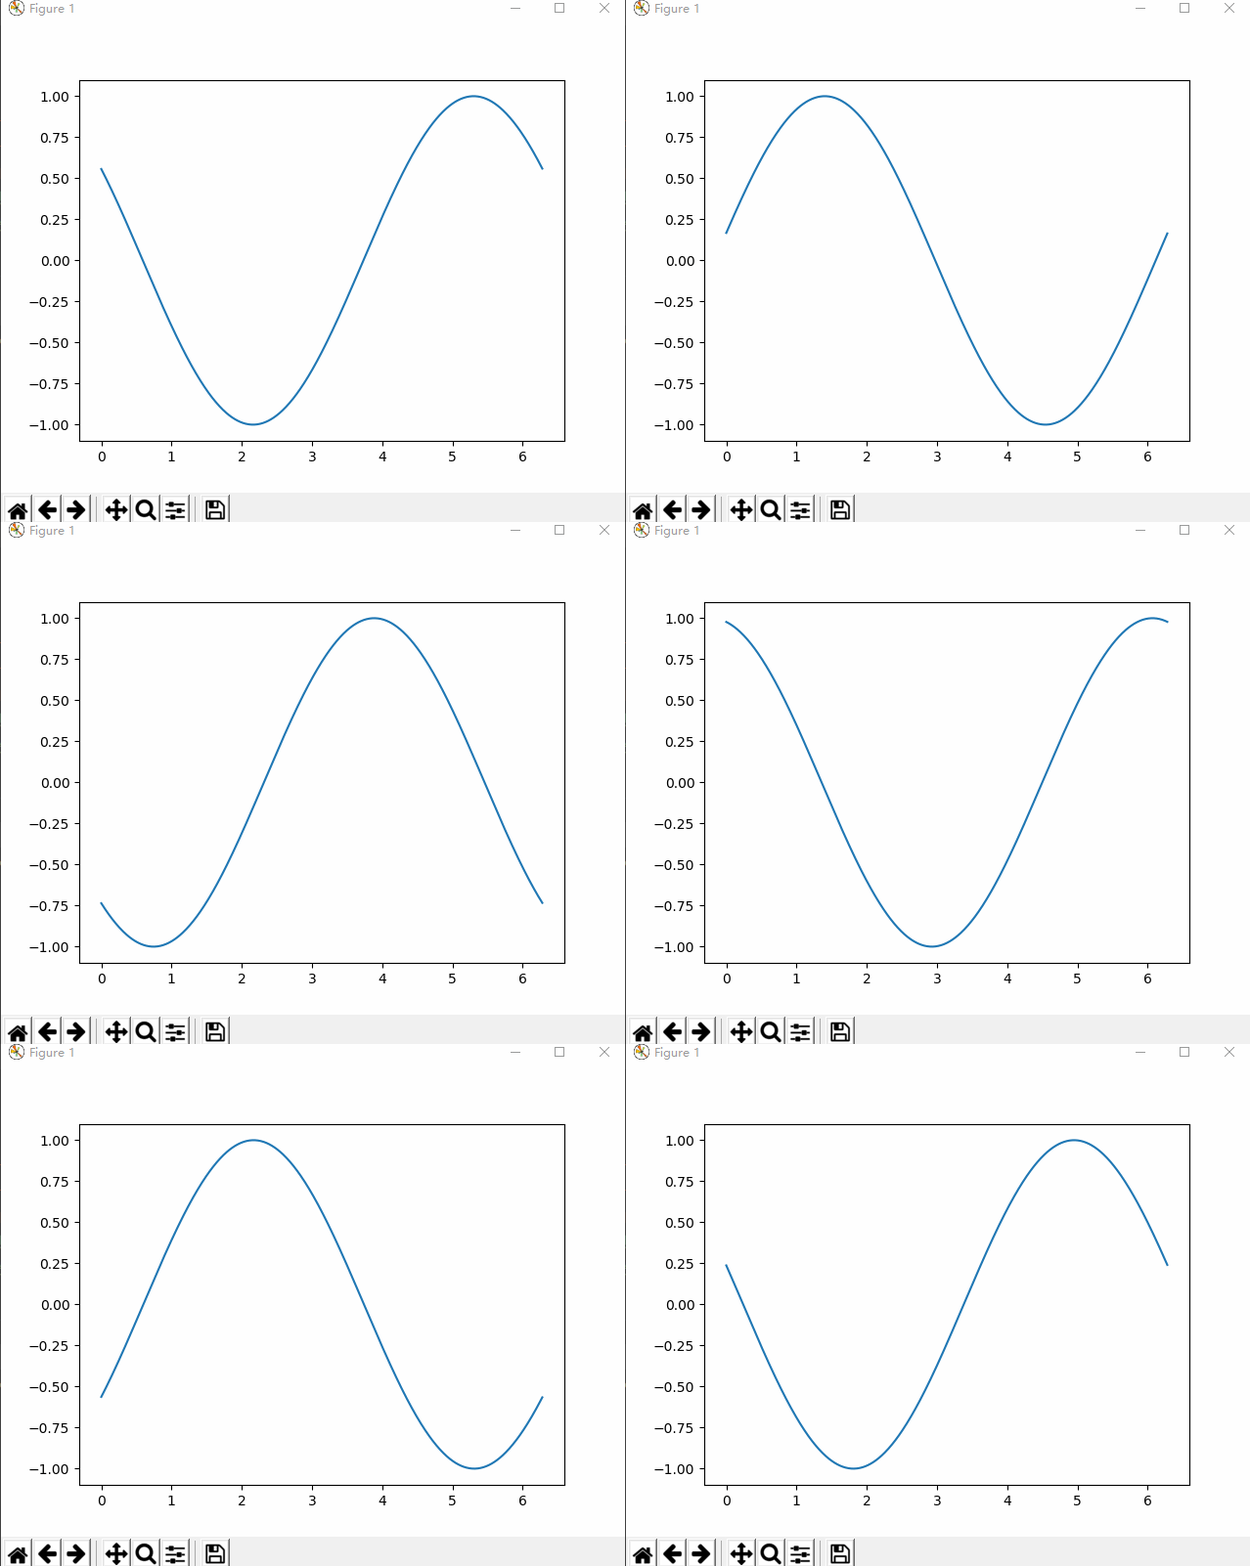
frames参数
- 为了更好的理解animation.FuncAnimation函数,将frames参数作为唯一变量
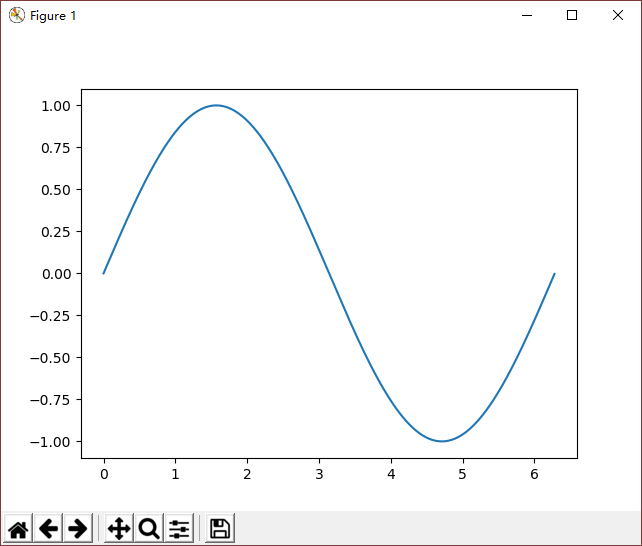
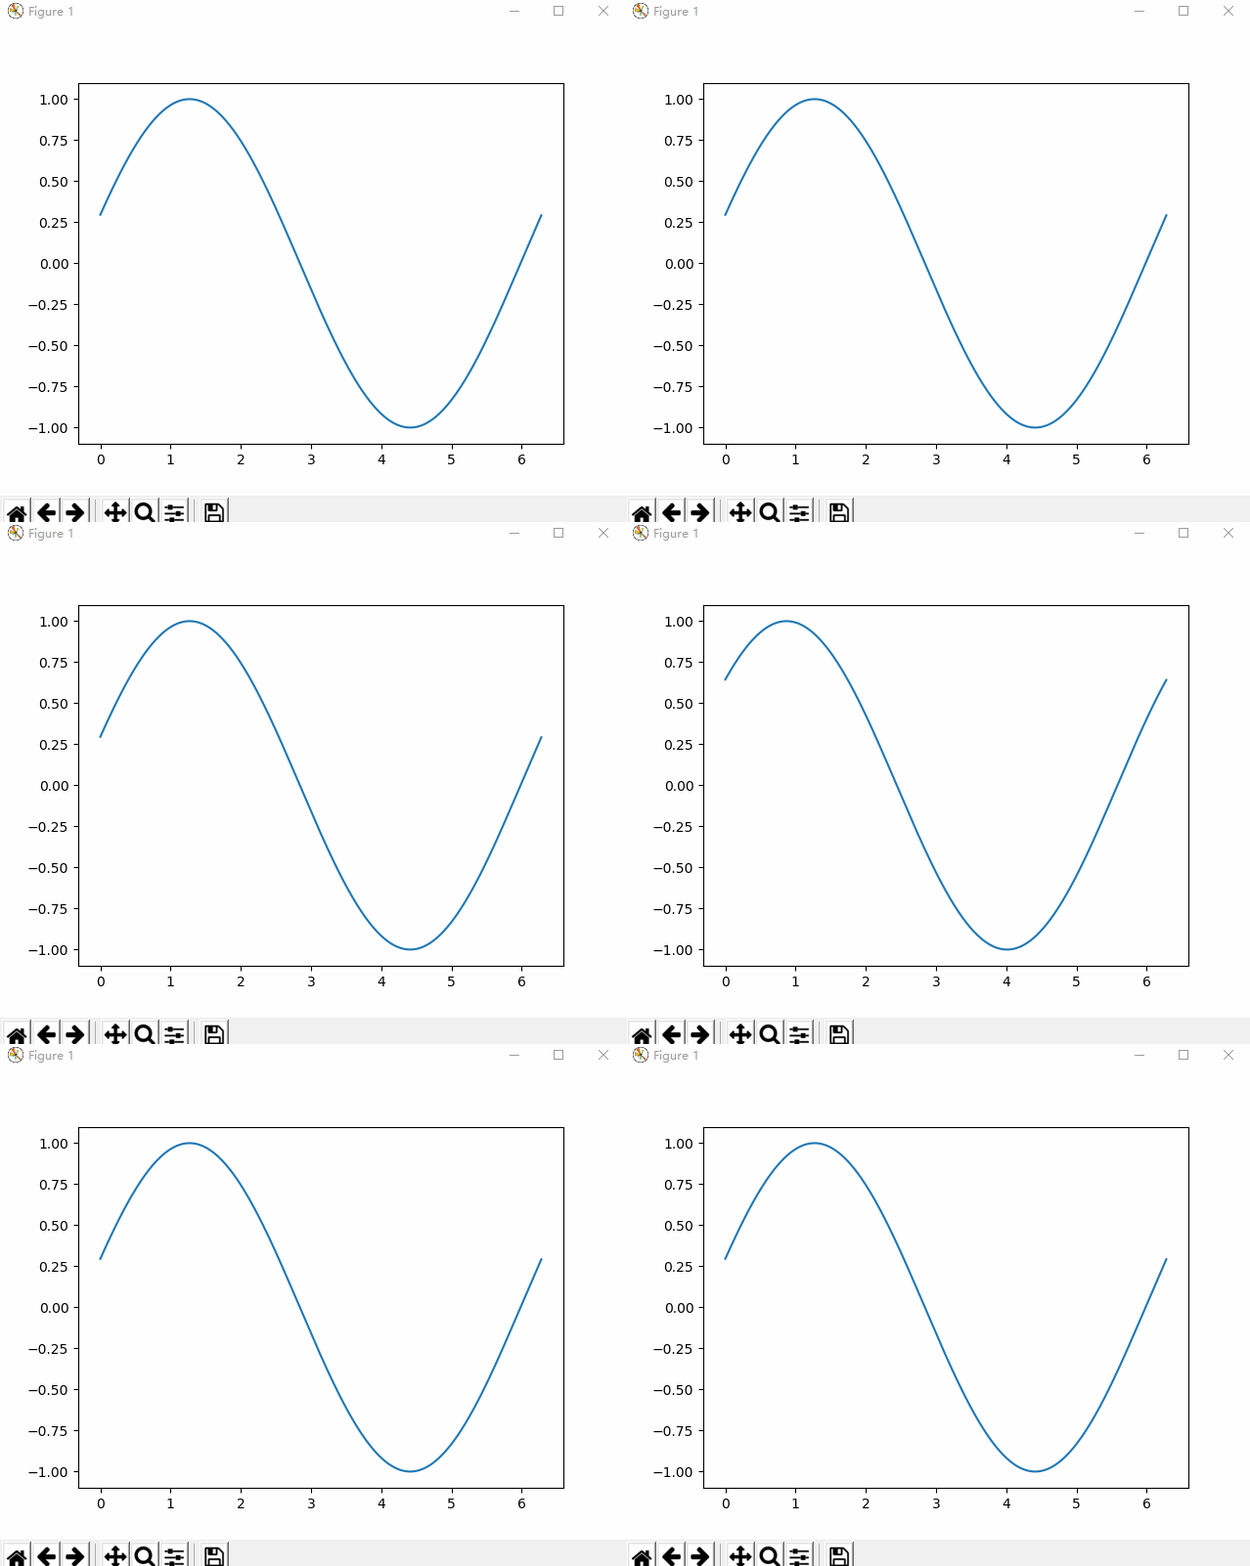
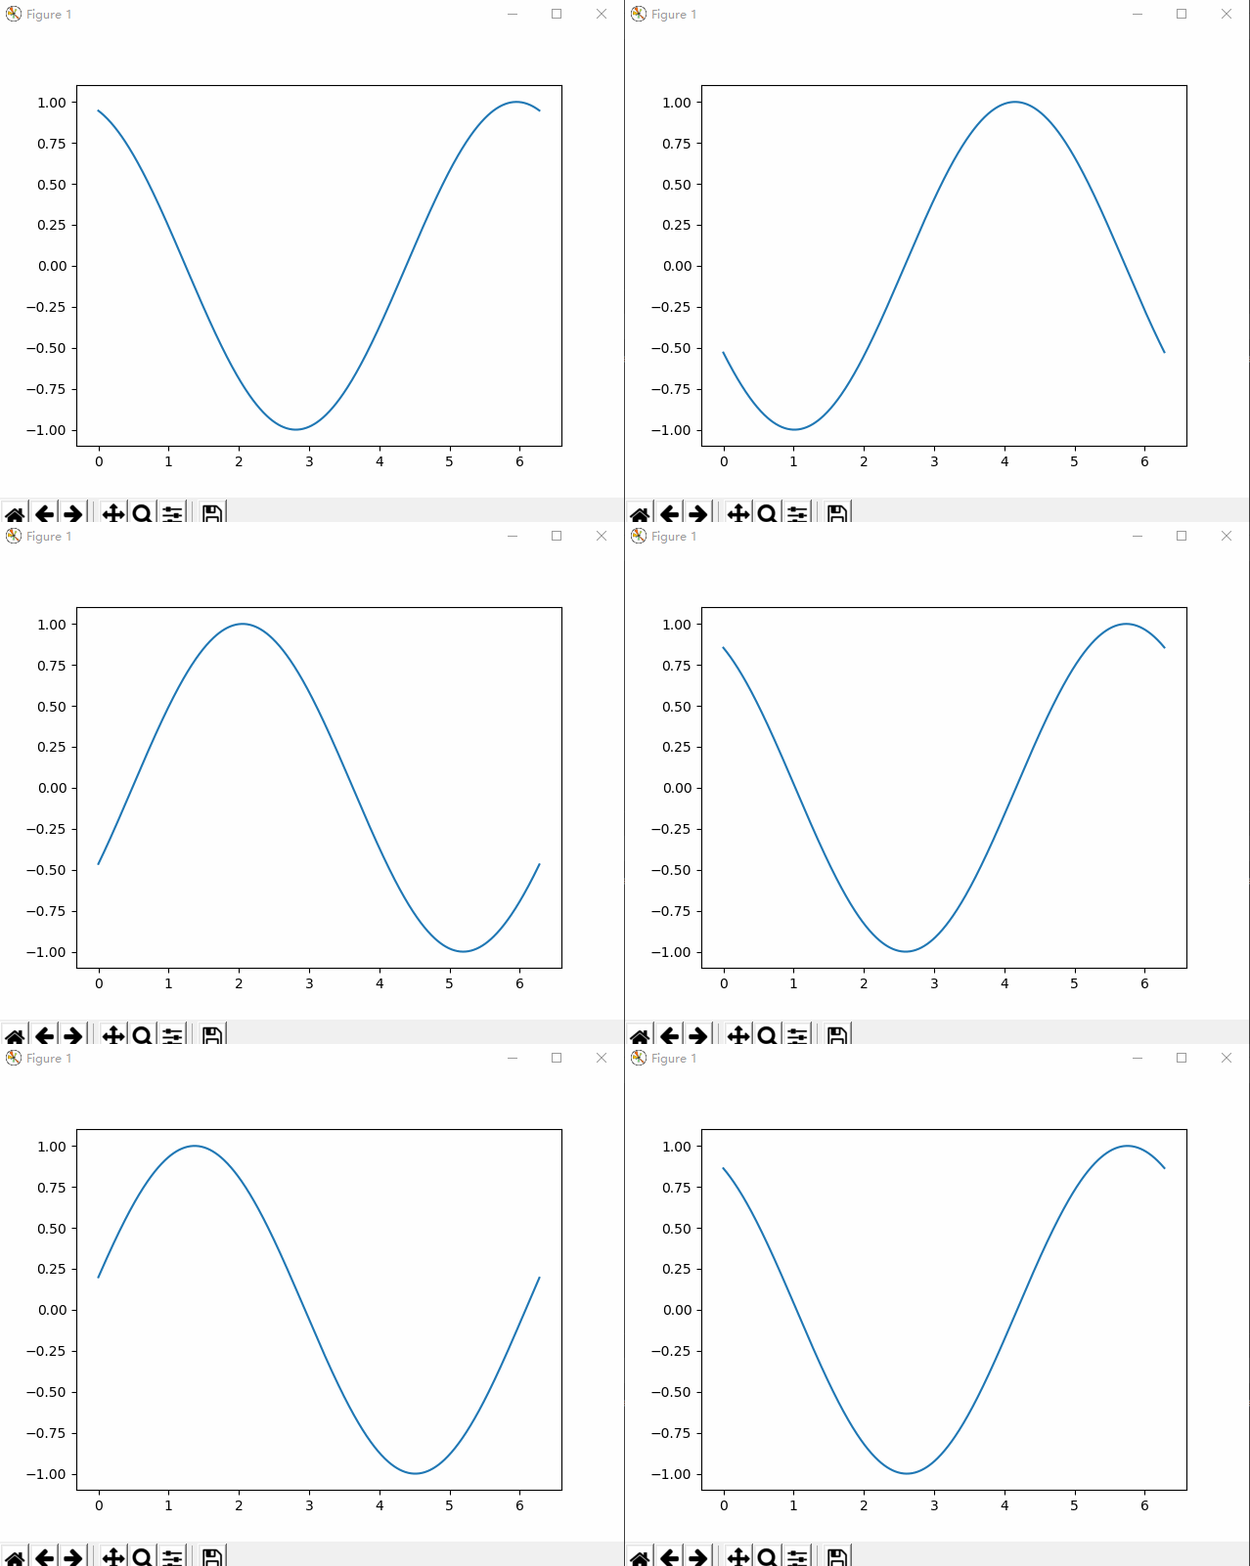
- 仔细观察会发现循环的周期长度不同,frams越大,循环的周期越长
- 统一设置interval为20
frames=1
frames=10
frames=100
frames=1000
interval参数
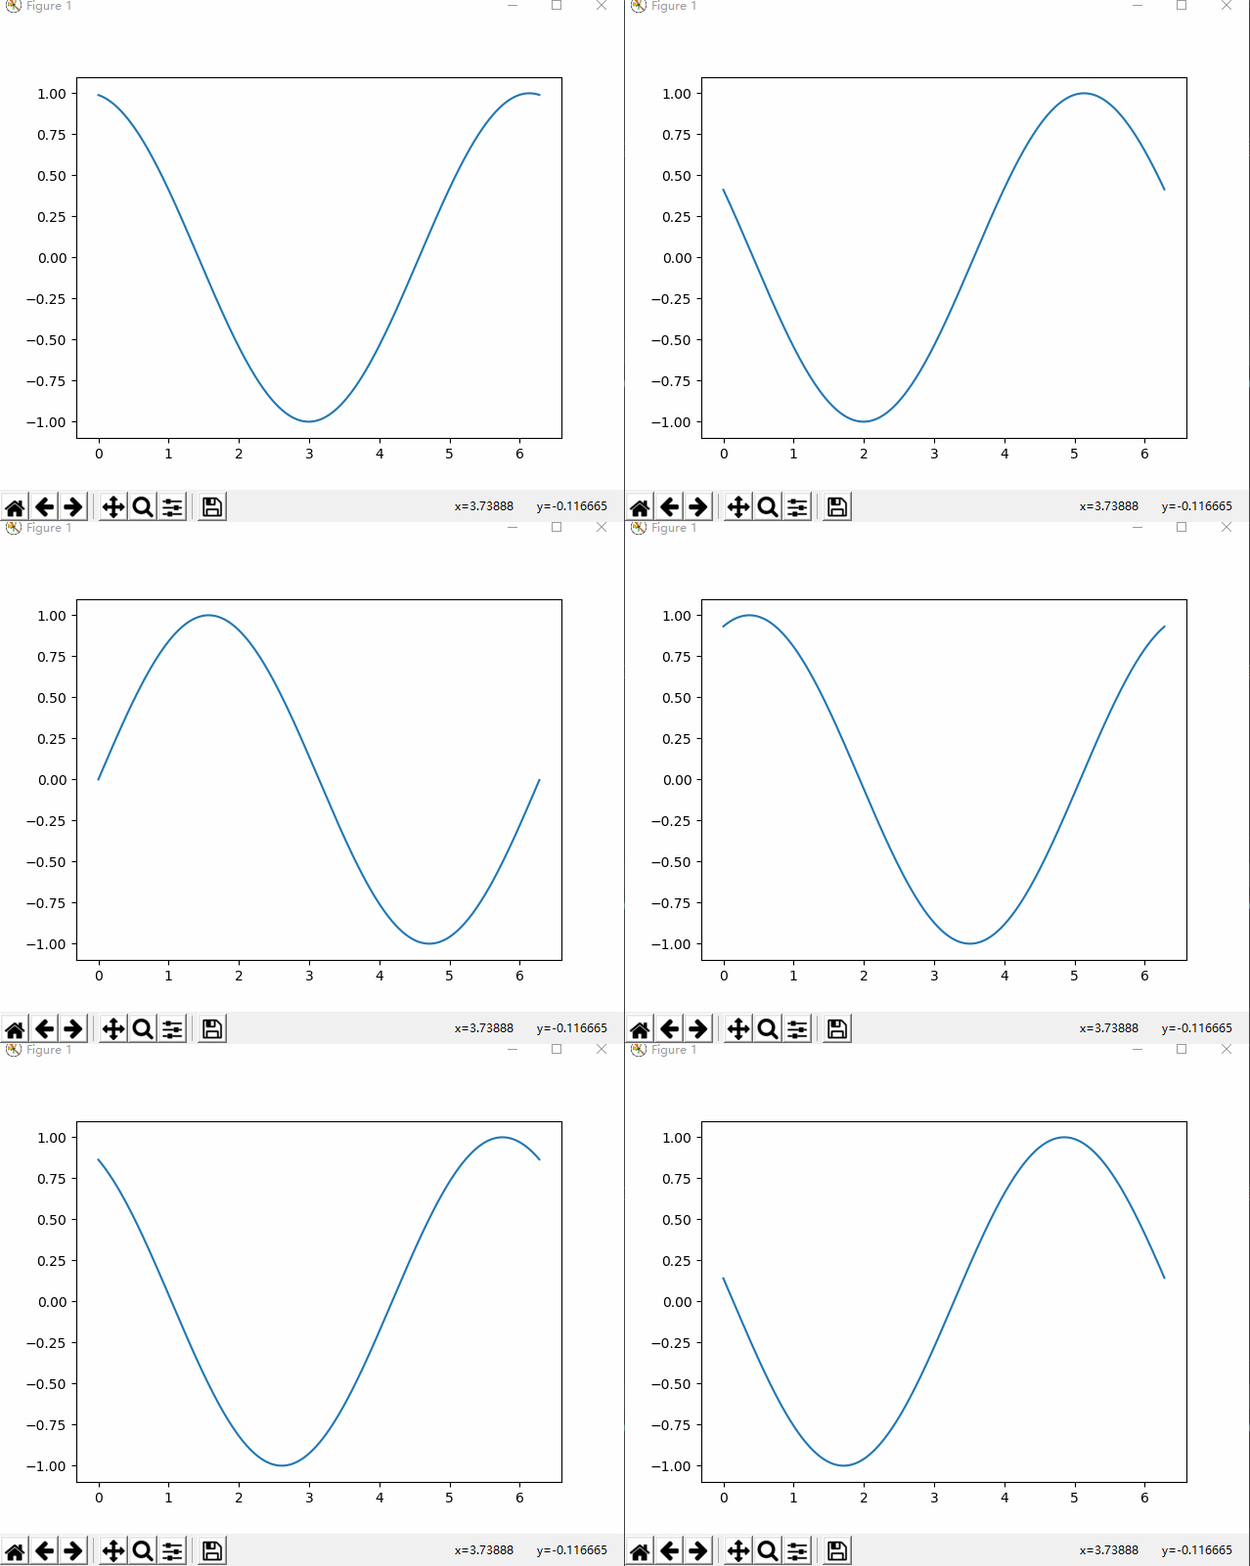
- 为了更好的理解animation.FuncAnimation函数,将interval参数作为唯一变量
- 控制画面更新之间的时间间隔,数值越大则间隔时间越长
- 统一设置frames为100
interval=1
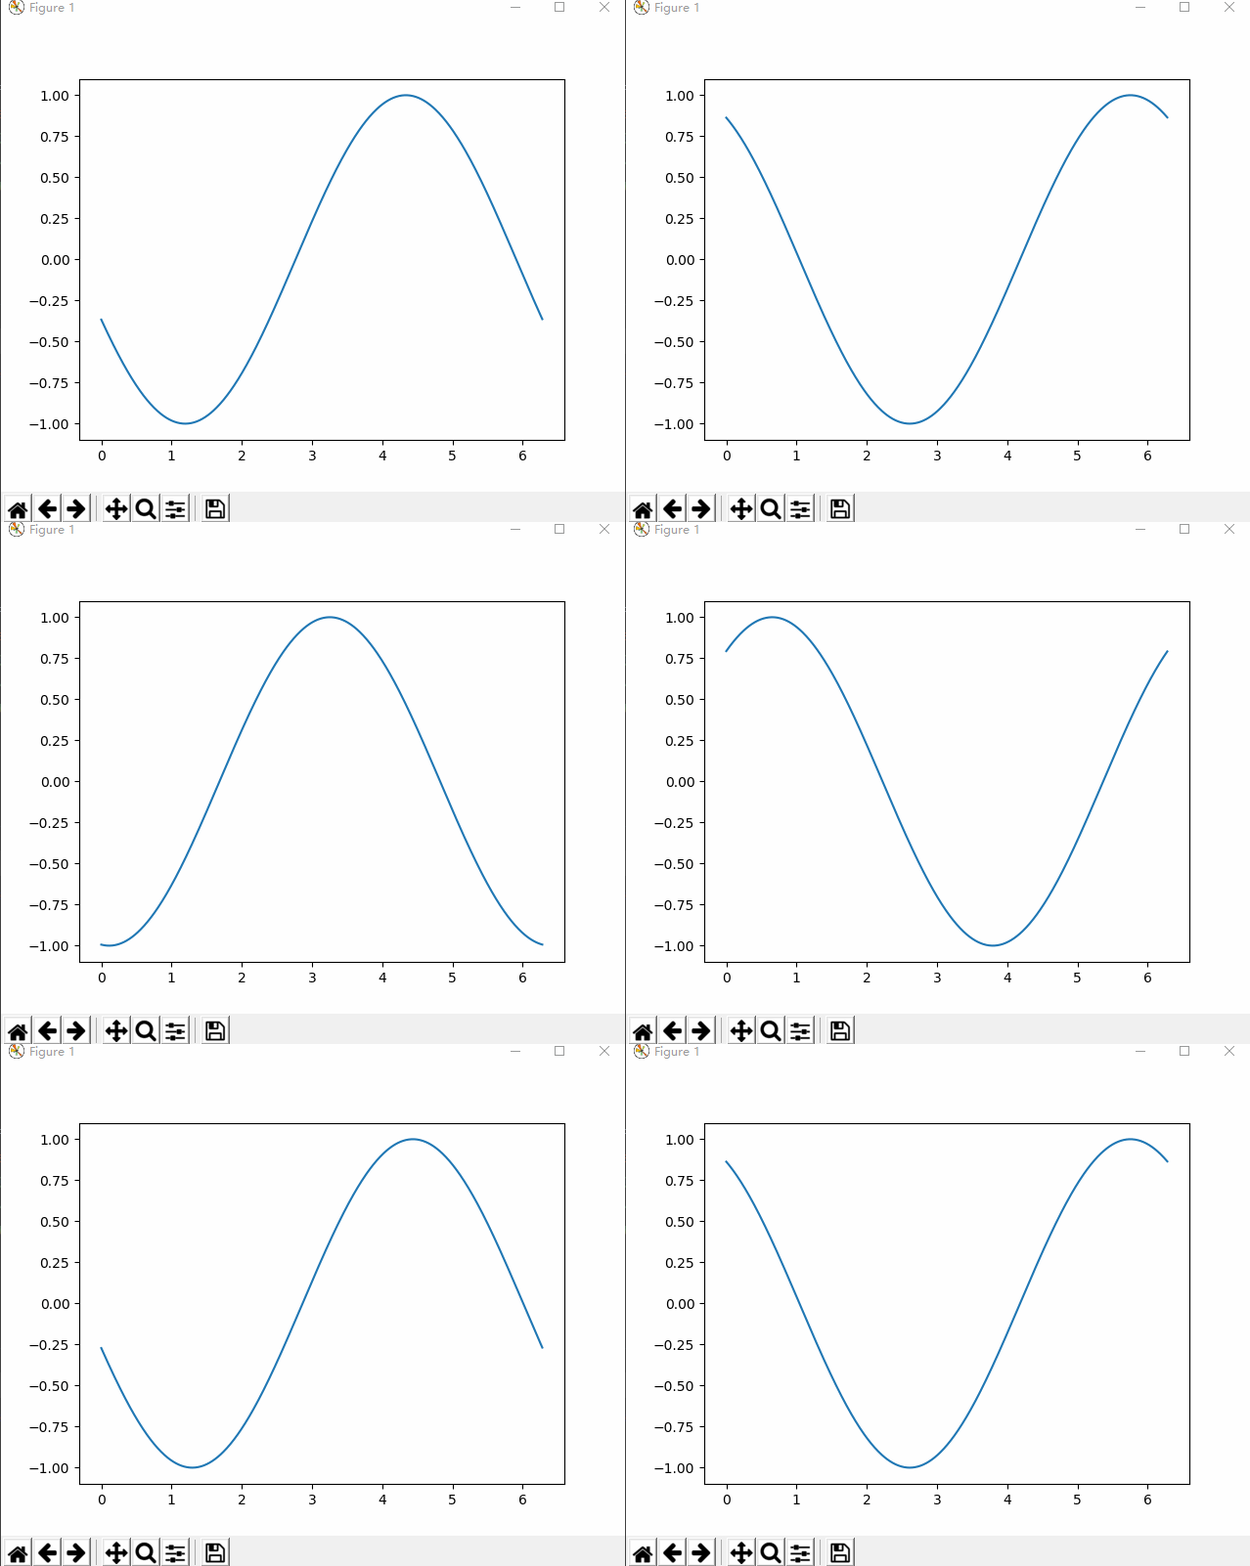
interval=20

interval=100
最后
以上就是专一马里奥最近收集整理的关于matplotlib animation FuncAnimation画2D线图matplotlib animation FuncAnimation画2D线图的全部内容,更多相关matplotlib内容请搜索靠谱客的其他文章。
本图文内容来源于网友提供,作为学习参考使用,或来自网络收集整理,版权属于原作者所有。


发表评论 取消回复