使用matplotlib可以很容易地创建动画框架。我们从一个非常简单的动画开始。
matplotlib 动画
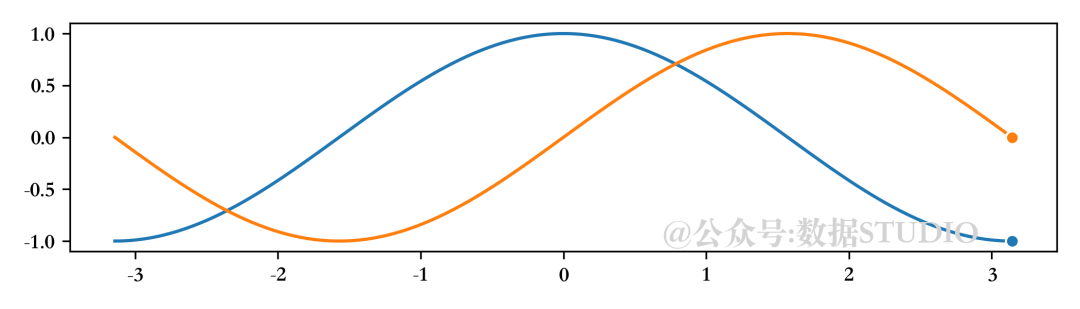
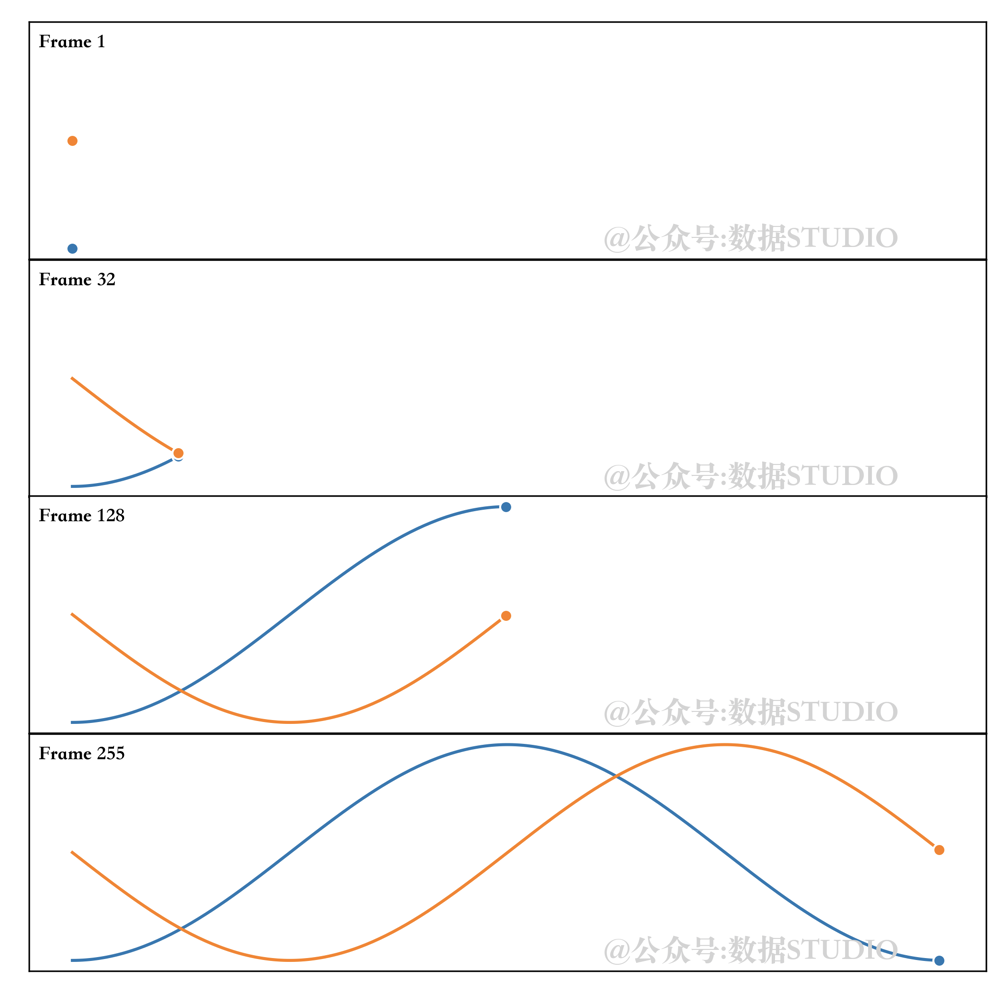
我们想制作一个动画,其中正弦和余弦函数在屏幕上逐步绘制。首先需要告诉matplotlib我们想要制作一个动画,然后必须指定想要在每一帧绘制什么。一个常见的错误是重新绘制每一帧的所有内容,这会使整个过程非常缓慢。相反地,只能更新必要的内容,因为我们知道许多内容不会随着帧的变化而改变。对于折线图,我们将使用set_data方法更新绘图,剩下的工作由matplotlib完成。
注意随着动画移动的终点标记。原因是我们在末尾指定了一个标记(markevery=[-1]),这样每次我们设置新数据时,标记就会自动更新并随着动画移动。参见下图。
import numpy as np
import matplotlib.pyplot as plt
import matplotlib.animation as animation
fig = plt.figure(figsize=(7, 2))
ax = plt.subplot()
X = np.linspace(-np.pi, np.pi, 256, endpoint=True)
C, S = np.cos(X), np.sin(X)
(line1,) = ax.plot(X, C, marker="o", markevery=[-1],
                   markeredgecolor="white")
(line2,) = ax.plot(X, S, marker="o", markevery=[-1],
                   markeredgecolor="white")
def update(frame):
    line1.set_data(X[:frame], C[:frame])
    line2.set_data(X[:frame], S[:frame])
plt.tight_layout()
ani = animation.FuncAnimation(fig, update, interval=10)
如果我们现在想要保存这个动画,matplotlib可以创建一个mp4文件,但是选项非常少。一个更好的解决方案是使用外部库,如FFMpeg,它可以在大多数系统上使用。安装完成后,我们可以使用专用的FFMpegWriter,如下图所示:
writer = animation.FFMpegWriter(fps=30)
anim = animation.FuncAnimation(fig, update,
                               interval=10,
                               frames=len(X))
anim.save("sine-cosine.mp4", writer=writer, dpi=100)注意,当我们保存mp4动画时,动画不会立即开始,因为实际上有一个与影片创建相对应的延迟。对于正弦和余弦,延迟相当短,可以忽略。但对于长且复杂的动画,这种延迟会变得非常重要,因此有必要跟踪其进展。因此我们使用tqdm库添加一些信息。
from tqdm.autonotebook import tqdm
bar = tqdm(total=len(X))
anim.save("../data/sine-cosine.mp4",
          writer=writer, dpi=300,
          progress_callback = lambda i, n: bar.update(1))
bar.close()
[Errno 2] No such file or directory: 'ffmpeg'
如果你在 macOS 上,只需通过 homebrew 安装它:
brew install ffmpeg
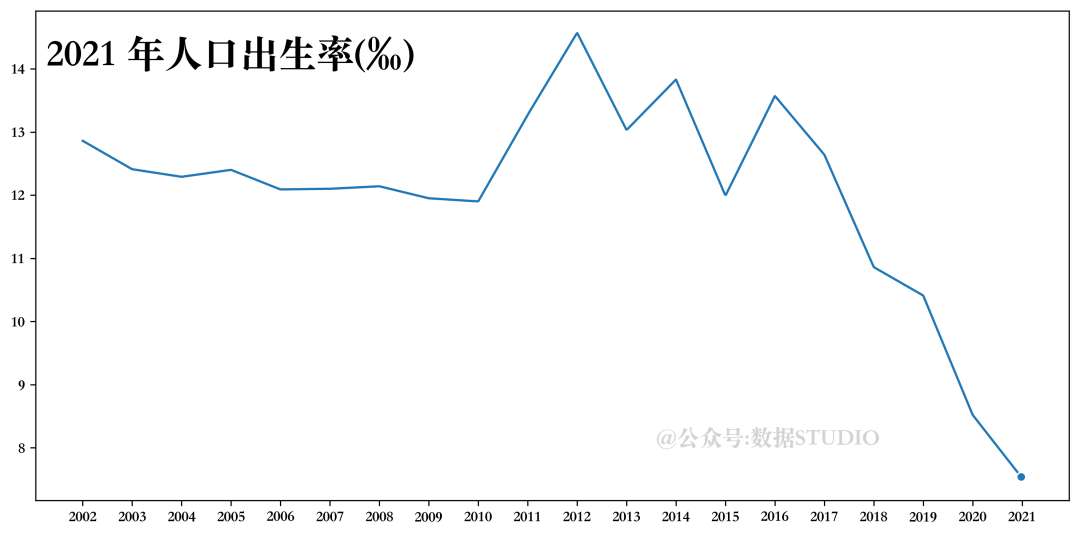
人口出生率
x = data['指标'].values
rate= data['人口出生率(‰)']
y = rate.values
xvals = np.linspace(2002,2021,1000)
yinterp = np.interp(xvals,x,y)
(line1,) = ax.plot(xvals, yinterp, marker="o",
markevery=[-1], markeredgecolor="white")
text = ax.text(0.01, 0.95,'text', ha="left", va="top",
transform=ax.transAxes, size=25)
ax.set_xticks(x)
def update(frame):
line1.set_data(xvals[:frame], yinterp[:frame])
text.set_text("%d 年人口出生率(‰) " % int(xvals[frame]))
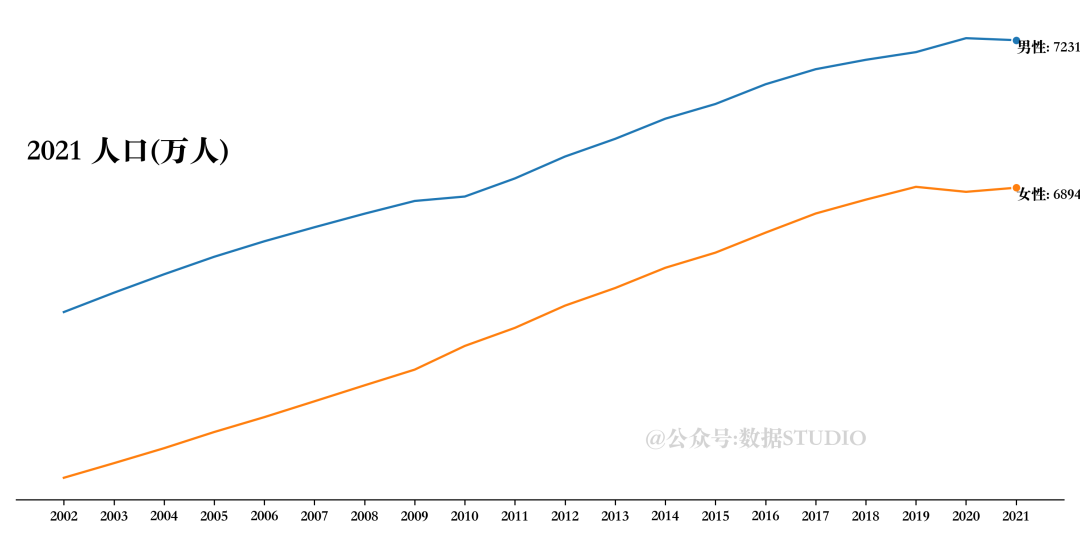
return line1, text男女人口总数
# 设置画布
fig = plt.figure(figsize=(10, 5))
ax = plt.subplot()
# 数据准备
X = data['指标']
male, female =data['男性人口(万人)'], data['女性人口(万人)']
# 绘制折线图
(line1,) = ax.plot(X, male, marker="o",
                   markevery=[-1], markeredgecolor="white")
(line2,) = ax.plot(X, female, marker="o",
                   markevery=[-1], markeredgecolor="white")
# 设置图形注释
text = ax.text(0.01, 0.75,'text',
               ha="left", va="top",
               transform=ax.transAxes,size=20)
text2 = ax.text(X[0],male[0], '', ha="left", va="top")
text3 = ax.text(X[0],female[0], '', ha="left", va="top")
# 设置坐标轴刻度标签
ax.set_xticks(X)
ax.set_yticks([])
# 设置坐标轴线格式
ax.spines["top"].set_visible(False)
ax.spines["left"].set_visible(False)
ax.spines["right"].set_visible(False)
# 定义更新函数
def update(frame):
    line1.set_data(X[:frame+1], male[:frame+1])
    line2.set_data(X[:frame+1], female[:frame+1])
    text.set_text("%d 人口(万人)" % X[frame])
    text2.set_position((X[frame], male[frame]))
    text2.set_text(f'男性: {male[frame]}')
    text3.set_position((X[frame], female[frame]))
    text3.set_text(f'女性: {female[frame]}')
    return line1,line2, text
# 定义输出
plt.tight_layout()
writer = animation.FFMpegWriter(fps=5)
# 执行动画
anim = animation.FuncAnimation(fig, update, interval=500, frames=len(X))
# 存储动画
# 设置进度条
bar = tqdm(total=len(X))
anim.save(
    "num_people2.mp4",
    writer=writer,
    dpi=300,
    progress_callback=lambda i, n: bar.update(1),
)
# 关闭进度条
bar.close()
雨滴

# 设置雨滴绘图更新函数
def rain_update(frame):
    global R, scatter
  # 数据获取
    R["color"][:, 3] = np.maximum(0, R["color"][:, 3] - 1 / len(R))
    R["size"] += 1 / len(R)
    i = frame % len(R)
    R["position"][i] = np.random.uniform(0, 1, 2)
    R["size"][i] = 0
    R["color"][i, 3] = 1
    # 散点形状设置
    scatter.set_edgecolors(R["color"])
    scatter.set_sizes(1000 * R["size"].ravel())
    scatter.set_offsets(R["position"])
    return (scatter,)
# 绘制画布
fig = plt.figure(figsize=(6, 8), facecolor="white", dpi=300)
ax = fig.add_axes([0, 0, 1, 1], frameon=False)  # , aspect=1)
# 绘制初始化散点图
scatter = ax.scatter([], [], s=[],
                     linewidth=0.5, edgecolors=[],
                     facecolors="None",cmap='rainbow')
# 设置雨滴数量
n = 250
# 为雨滴设置参数值
R = np.zeros(
    n, dtype=[("position", float, (2,)),
              ("size", float, (1,)),
              ("color", float, (4,))])
R["position"] = np.random.uniform(0, 1, (n, 2))
R["size"] = np.linspace(0, 1.5, n).reshape(n, 1)
R["color"][:, 3] = np.linspace(0, 1, n)
# 设置坐标轴格式
ax.set_xlim(0, 1), ax.set_xticks([])
ax.set_ylim(0, 1), ax.set_yticks([])
# 保存同上
流体
最后一个更加复杂的流体
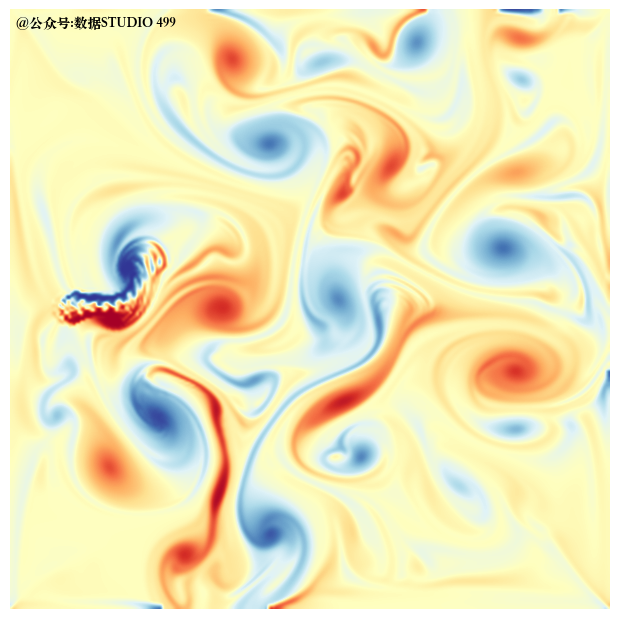 Matplotlib绘制动图成品赏析
参考资料
[1]
Scientific Visualisation-Python & Matplotlib

往期精彩回顾
适合初学者入门人工智能的路线及资料下载(图文+视频)机器学习入门系列下载中国大学慕课《机器学习》(黄海广主讲)机器学习及深度学习笔记等资料打印《统计学习方法》的代码复现专辑机器学习交流qq群955171419,加入微信群请扫码
最后
以上就是落寞钢笔最近收集整理的关于【Python】Matplotlib 可视化进阶之动画的全部内容,更多相关【Python】Matplotlib内容请搜索靠谱客的其他文章。
本图文内容来源于网友提供,作为学习参考使用,或来自网络收集整理,版权属于原作者所有。


发表评论 取消回复