代码来源
Samara, J., et al. (2022). "Supplementation with a probiotic mixture accelerates gut microbiome maturation and reduces intestinal inflammation in extremely preterm infants." Cell Host Microbe 30(5): 696-711 e695.
Probiotics are increasingly administered to premature infants to prevent necrotizing enterocolitis and neonatal sepsis. However, their effects on gut microbiome assembly and immunity are poorly understood. Using a randomized intervention trial in extremely premature infants, we tested the effects of a probiotic product containing four strains of Bifidobacterium species autochthonous to the infant gut and one Lacticaseibacillus strain on the compositional and functional trajectory of microbiome. Daily administration of the mixture accelerated the transition into a mature, term-like microbiome with higher stability and species interconnectivity. Besides infant age, Bifidobacterium strains and stool metabolites were the best predictors of microbiome maturation, and structural equation modeling confirmed probiotics as a major determinant for the trajectory of microbiome assembly. Bifidobacterium-driven microbiome maturation was also linked to an anti-inflammatory intestinal immune milieu. This demonstrates that Bifidobacterium strains are ecosystem engineers that lead to an acceleration of microbiome maturation and immunological consequences in extremely premature infants.
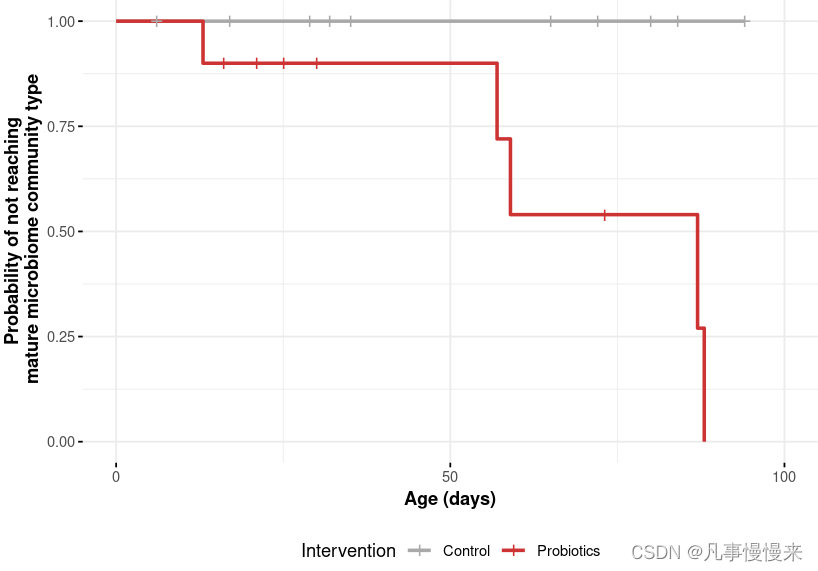
生存曲线常常用来判断肿瘤患者中某危险因素对生存结局的影响,需要获取到患者的随访时间和生存状态。在菌群分析中,这篇文章利用生存曲线来分析益生菌干预对菌群随时间成熟程度的影响。
输入数据格式
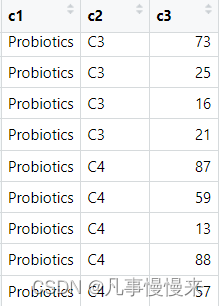
注:c1是益生菌分组,c2是肠型,c3是随访时间
绘图代码
library(survminer)
library(survival)

sdf <- sdf %>%
     mutate(mature = ifelse(c2 %in% c("C1", "C2", "C3"), "Immature", "Mature"))

sdf$SurvObj <- with(sdf, Surv(c3, c2 == "C4"))

set.seed(897651)
fit<- survfit(SurvObj ~ c1, data = sdf, conf.type = "log-log")

fig <- ggsurvplot(fit,
                  legend = "bottom",
                  legend.title = "Intervention",
                  legend.labs = c("Control", "Probiotics"),
                  size = 1,
                  break.time.by = 50,
                  palette = c("darkgray", "brown3"),
                  pval = TRUE,
                  ggtheme = theme_minimal(),
                  xlab = "Age (days)",
                  ylab = "Probability of not reachingn mature microbiome community type",
                  font.x = c("bold"),
                  font.y = c("bold"),
                  pval.coord = c(250, 1))
输出结果
最后
以上就是陶醉抽屉最近收集整理的关于R语言绘制生存曲线图的全部内容,更多相关R语言绘制生存曲线图内容请搜索靠谱客的其他文章。


发表评论 取消回复