- 调用格式
- 示例1:Pyplot Simple
- 示例2:Pyplot Formatstr
- 示例3:Pyplot Three
- 示例4:Whats New 0.98.4 Legend
- 示例5:Pyplot Two Subplots
调用格式
plot([x], y, [fmt], data=None, **kwargs)
plot([x], y, [fmt], [x2], y2, [fmt2], ..., **kwargs)
示例1:Pyplot Simple
"""
=============
Pyplot Simple
=============

"""
import matplotlib.pyplot as plt
plt.plot([1,2,3,4])
plt.ylabel('some numbers')
plt.show()
运行结果:
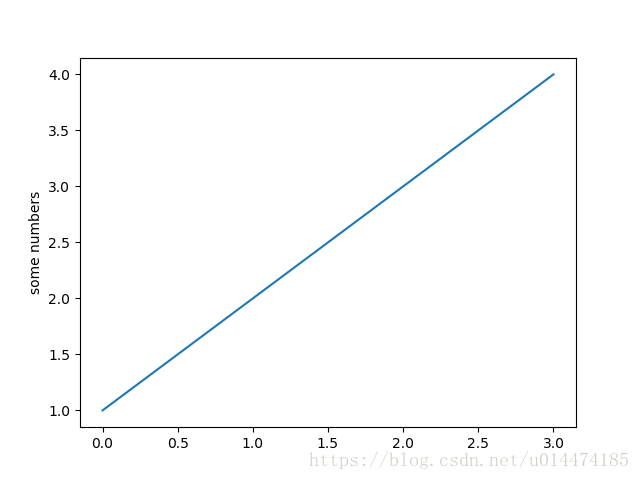
在上面的例子中,plt.plot([1,2,3,4])指定了所绘图形的纵坐标,当横坐标未给出时,默认为[0, ···, N-1]。plt.ylabel('some numbers')给出了y轴标签。
示例2:Pyplot Formatstr
"""
================
Pyplot Formatstr
================

"""
import matplotlib.pyplot as plt
plt.plot([1,2,3,4], [1,4,9,16], 'ro')
plt.axis([0, 6, 0, 20])
plt.show()
运行结果:
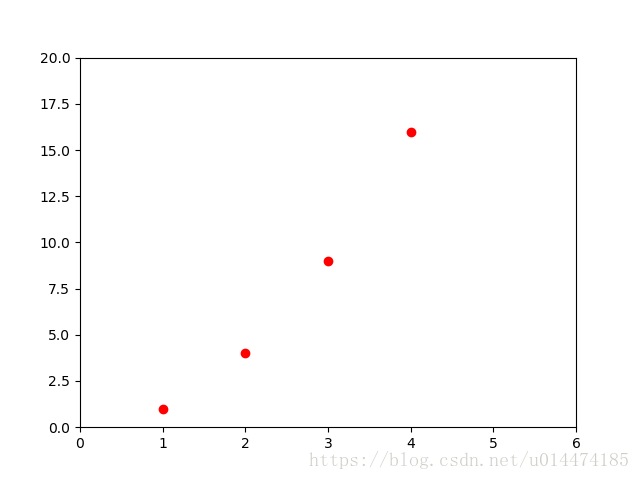
plt.plot([1,2,3,4], [1,4,9,16], 'ro')中参数[1,2,3,4], [1,4,9,16]指定了所绘图形的横坐标和纵坐标,参数ro中r为red,o代表使用圆形标记绘制而不是用线绘制。plt.axis([0, 6, 0, 20])设定了横坐标与纵坐标范围。
示例3:Pyplot Three
"""
============
Pyplot Three
============

"""
import numpy as np
import matplotlib.pyplot as plt

# evenly sampled time at 200ms intervals
t = np.arange(0., 5., 0.2)

# red dashes, blue squares and green triangles
plt.plot(t, t, 'r--', t, t**2, 'bs', t, t**3, 'g^')
plt.show()
运行结果:
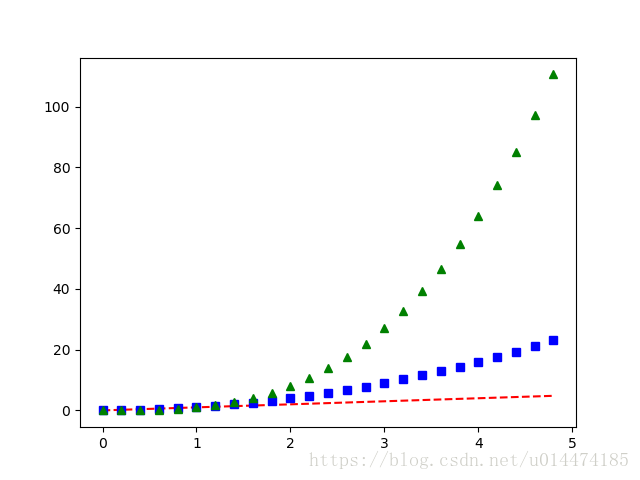
plt.plot(t, t, 'r--', t, t**2, 'bs', t, t**3, 'g^')绘制了三个点集。参数r--表示红色虚线,bs表示蓝色方块标记,g^表示绿色三角标记。
示例4:Whats New 0.98.4 Legend
"""
=======================
Whats New 0.98.4 Legend
=======================

"""
import matplotlib.pyplot as plt
import numpy as np


ax = plt.subplot(111)
t1 = np.arange(0.0, 1.0, 0.01)
for n in [1, 2, 3, 4]:
    plt.plot(t1, t1**n, label="n=%d"%(n,))

leg = plt.legend(loc='best', ncol=2, mode="expand", shadow=True, fancybox=True)
leg.get_frame().set_alpha(0.5)


plt.show()
运行结果:
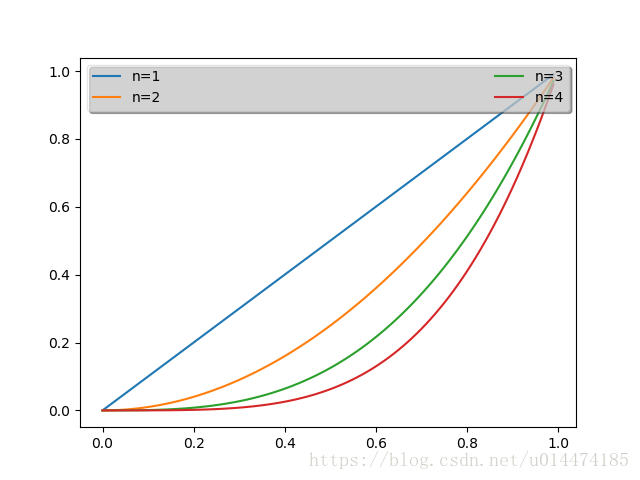
ax = plt.subplot(111)与ax = plt.subplot(1, 1, 1)效果相同,表示将绘制区域分割成1行1列,并在第一个坐标系中绘图。subplot函数第一个参数表示分割的行数,第二个参数表示分割的列数,第三个参数表示在哪个坐标系中绘图。语句plt.legend(loc='best', ncol=2, mode="expand", shadow=True, fancybox=True)绘制图例,ncol=2表示图例有两列,loc='best'表示放置的位置,mode="expand"表示图例在水平方向填充坐标系区域,shadow=True表示绘制阴影。
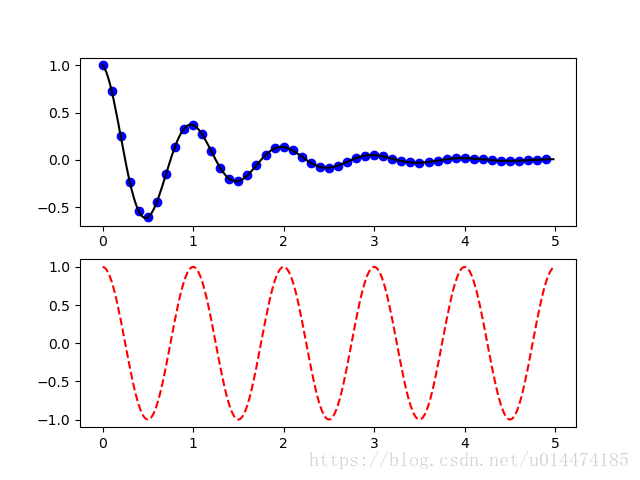
示例5:Pyplot Two Subplots
"""
===================
Pyplot Two Subplots
===================

"""
import numpy as np
import matplotlib.pyplot as plt

def f(t):
    return np.exp(-t) * np.cos(2*np.pi*t)

t1 = np.arange(0.0, 5.0, 0.1)
t2 = np.arange(0.0, 5.0, 0.02)

plt.figure(1)
plt.subplot(211)
plt.plot(t1, f(t1), 'bo', t2, f(t2), 'k')

plt.subplot(212)
plt.plot(t2, np.cos(2*np.pi*t2), 'r--')
plt.show()
运行结果:
最后
以上就是爱笑菠萝最近收集整理的关于Matplotlib学习笔记(一):plot()函数调用格式示例1:Pyplot Simple示例2:Pyplot Formatstr示例3:Pyplot Three示例4:Whats New 0.98.4 Legend示例5:Pyplot Two Subplots的全部内容,更多相关Matplotlib学习笔记(一):plot()函数调用格式示例1:Pyplot内容请搜索靠谱客的其他文章。


发表评论 取消回复