https://laurent-leturgez.com/2017/12/22/profiling-java-application-with-systemtap/
I’m not a JVM internals geek but I was sure there was a way to do the job without restarting the JVM, and I found some cool stuff with Systemtap.
To do this, you have to install two packages on your linux distribution: systemtap and systemtap-runtime-java (and configure correctly your user environment):
[root@spark ~]# yum install systemtap systemtap-runtime-java
Please note that I used a CentOS 7.4 distribution.
Then, and for the demo, I wrote a very small piece of Java that do these steps:
- Prints the JVM PID
- Wait for a key to be pressed. During this time, you will have to execute the systemtap script I will described later.
- Execute a loop ten times, each loop with print a message and wait one second, and this last step is executed in a method name “loop_and_wait”.
Here’s the sample code:
|
1
2
3
4
5
6
7
8
9
10
11
12
13
14
15
16
17
18
19
20
21
22
23
24
25
26
27
28
29
30
31
32
33
34
35
36
|
package
com.premiseo;
import
java.lang.*;
import
java.io.BufferedReader;
import
java.io.InputStreamReader;
import
java.io.IOException;
class
Example {
public
static
void
loop_and_wait(
int
n)
throws
InterruptedException{
System.out.println(
"Waiting "
+n+
"ms... Tick"
);
Thread.sleep(n);
}
public
static
void
main(String[] args) {
System.out.println(
"PID = "
+java.lang.management.ManagementFactory.getRuntimeMXBean().getName().split(
"@"
)[
0
]);
System.out.println(
"Press any key when ready ..."
);
try
{
BufferedReader in =
new
BufferedReader(
new
InputStreamReader(System.in));
String next = in.readLine();
}
catch
(IOException ioe) {
ioe.printStackTrace();
}
try
{
for
(
int
i=
0
;i<
10
;i++) {
loop_and_wait(
1000
);
}
}
catch
(InterruptedException ie) {
ie.printStackTrace();
}
}
}
|
Then, compile and execute … very basic I said
[spark@spark java]$ javac -cp $CLASSPATH:. com/premiseo/Example.java
[spark@spark java]$ java -cp $CLASSPATH:. com.premiseo.Example
PID = 9928
Press any key when ready ...

Waiting 1000ms... Tick
Waiting 1000ms... Tick
Waiting 1000ms... Tick
Waiting 1000ms... Tick
Waiting 1000ms... Tick
Waiting 1000ms... Tick
Waiting 1000ms... Tick
Waiting 1000ms... Tick
Waiting 1000ms... Tick
Waiting 1000ms... Tick
Now, to answer to Tanel, I used a short systemtap script that will profile the program and specially the loop_and_wait method. I will count the number of times the loop_and_wait method has been called, and I will account the time spent in this method execution.
To do that, I had to write two probes related to:
- the full name of the class, including the package name: com.premiseo.Example
- the class name where the method is defined: Example
- the method name I want to profile: loop_and_wait
The first one will be executed when the program will start to execute the targeted method (java(“com.premiseo.Example”).class(“Example”).method(“loop_and_wait”)), the second one will be executed when the method will return (java(“com.premiseo.Example”).class(“Example”).method(“loop_and_wait”).return)
The related systemtap script is given below:
#!/usr/bin/env stap

global counter,timespent,t

probe begin {
  printf("Press Ctrl+C to stop profilingn")
  counter=0
  timespent=0
}

probe java("com.premiseo.Example").class("Example").method("loop_and_wait")
{
  counter++
  t=gettimeofday_ms()
}

probe java("com.premiseo.Example").class("Example").method("loop_and_wait").return
{
  timespent+=gettimeofday_ms()-t
}

probe end {
   printf("Number of calls for loop_and_wait method: %ld n",    counter)
   printf("Time Spent in method loop_and_wait: %ld msecs n", timespent)
}
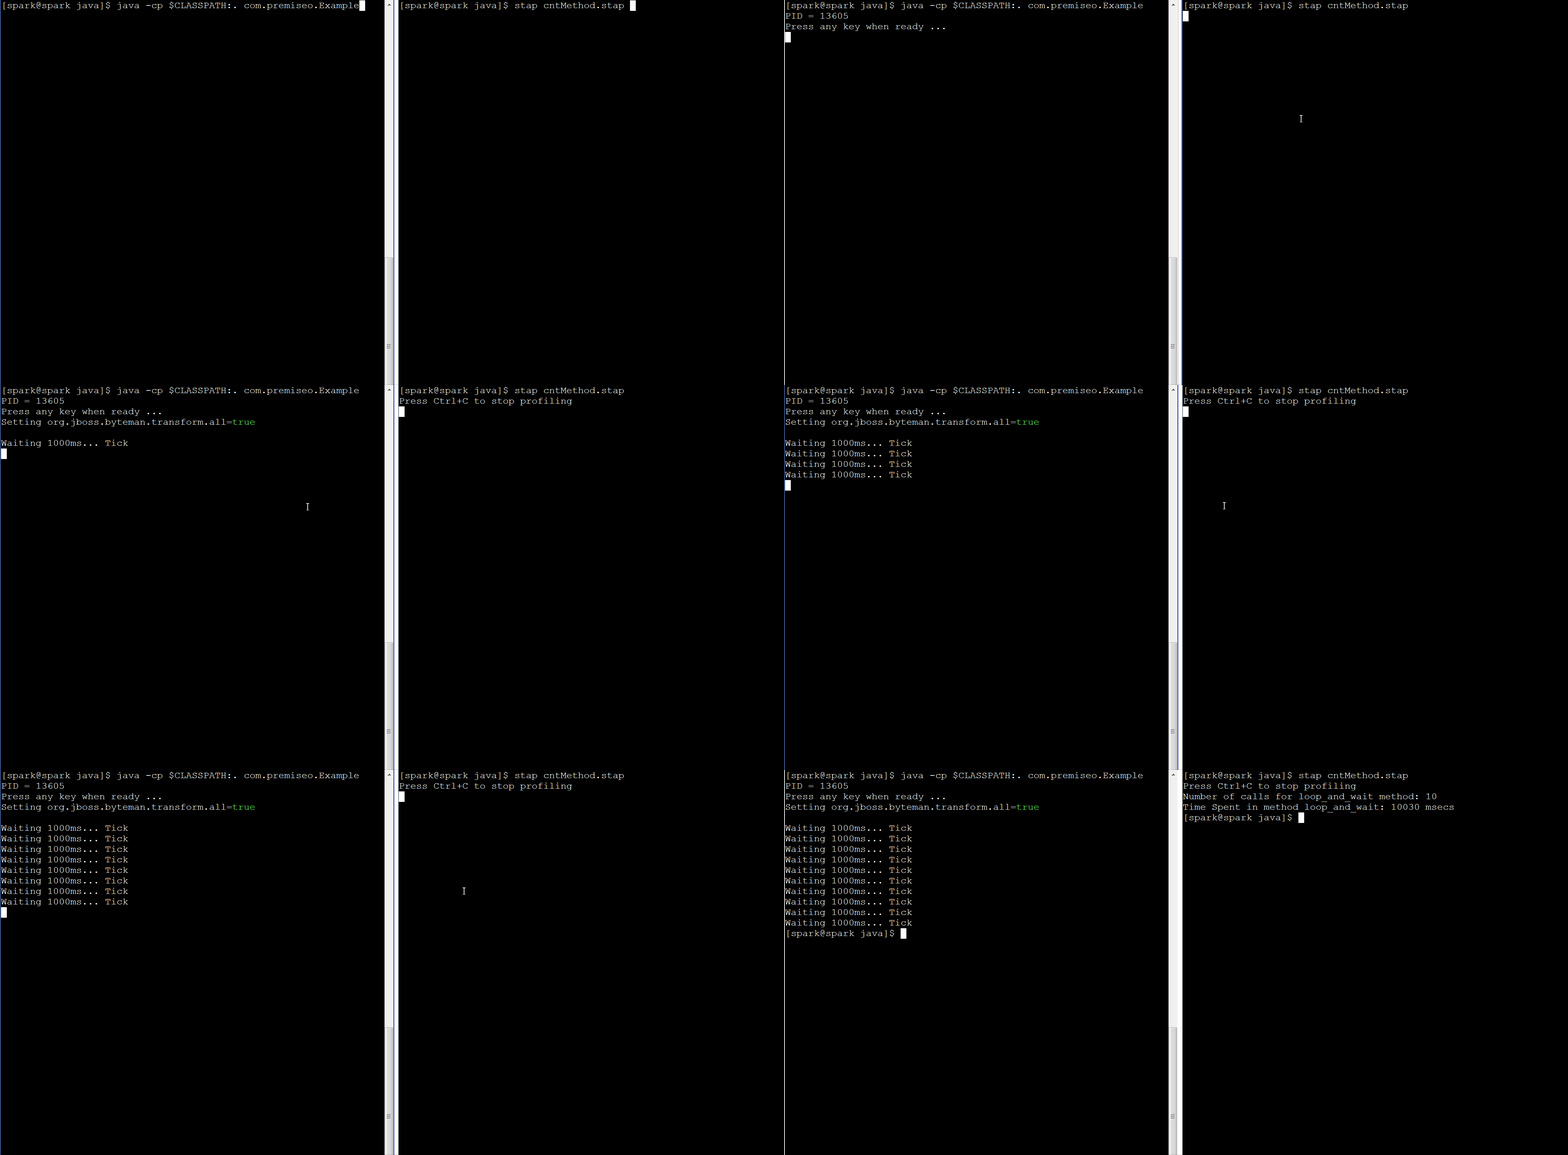
Execution of this systemtap script gave the following result (click the image for full size):

Is it dynamic? Yes, no need to restart the running JVM process you want to target. If you want to target a specific JVM process id, you can use the stap’s “-x” option, add the modify your probe definition like this:
probe java("com.premiseo.Example").class("Example").method("loop_and_wait")
{
  if (pid() == target())
    counter++
    t=gettimeofday_ms()
}
There’s a limitation, you cannot use wilcards in the java probe definition (java(“com.premiseo.Example”).class(“Example”).method(“loop*”) … for example). That would have been useful to profile a set of methods in the same class … but not possible currently.
If you want to read more about this kind of stuff, please read the following websites:
- https://developers.redhat.com/blog/2014/01/10/probing-java-w-systemtap/
- https://sourceware.org/systemtap/langref/Probe_points.html#SECTION00056000000000000000
- https://myaut.github.io/dtrace-stap-book/app/java.html
And … that’s all for today !!
最后
以上就是快乐外套最近收集整理的关于Profiling Java Application with Systemtap的全部内容,更多相关Profiling内容请搜索靠谱客的其他文章。


发表评论 取消回复