目录
- 一、代码示例
- 1.1 基本设置
- 1.2 widget.h头文件
- 1.3 绘制图像
- 1.4 生成游标
- 1.5 游标说明
- 1.6 mouseMove1函数
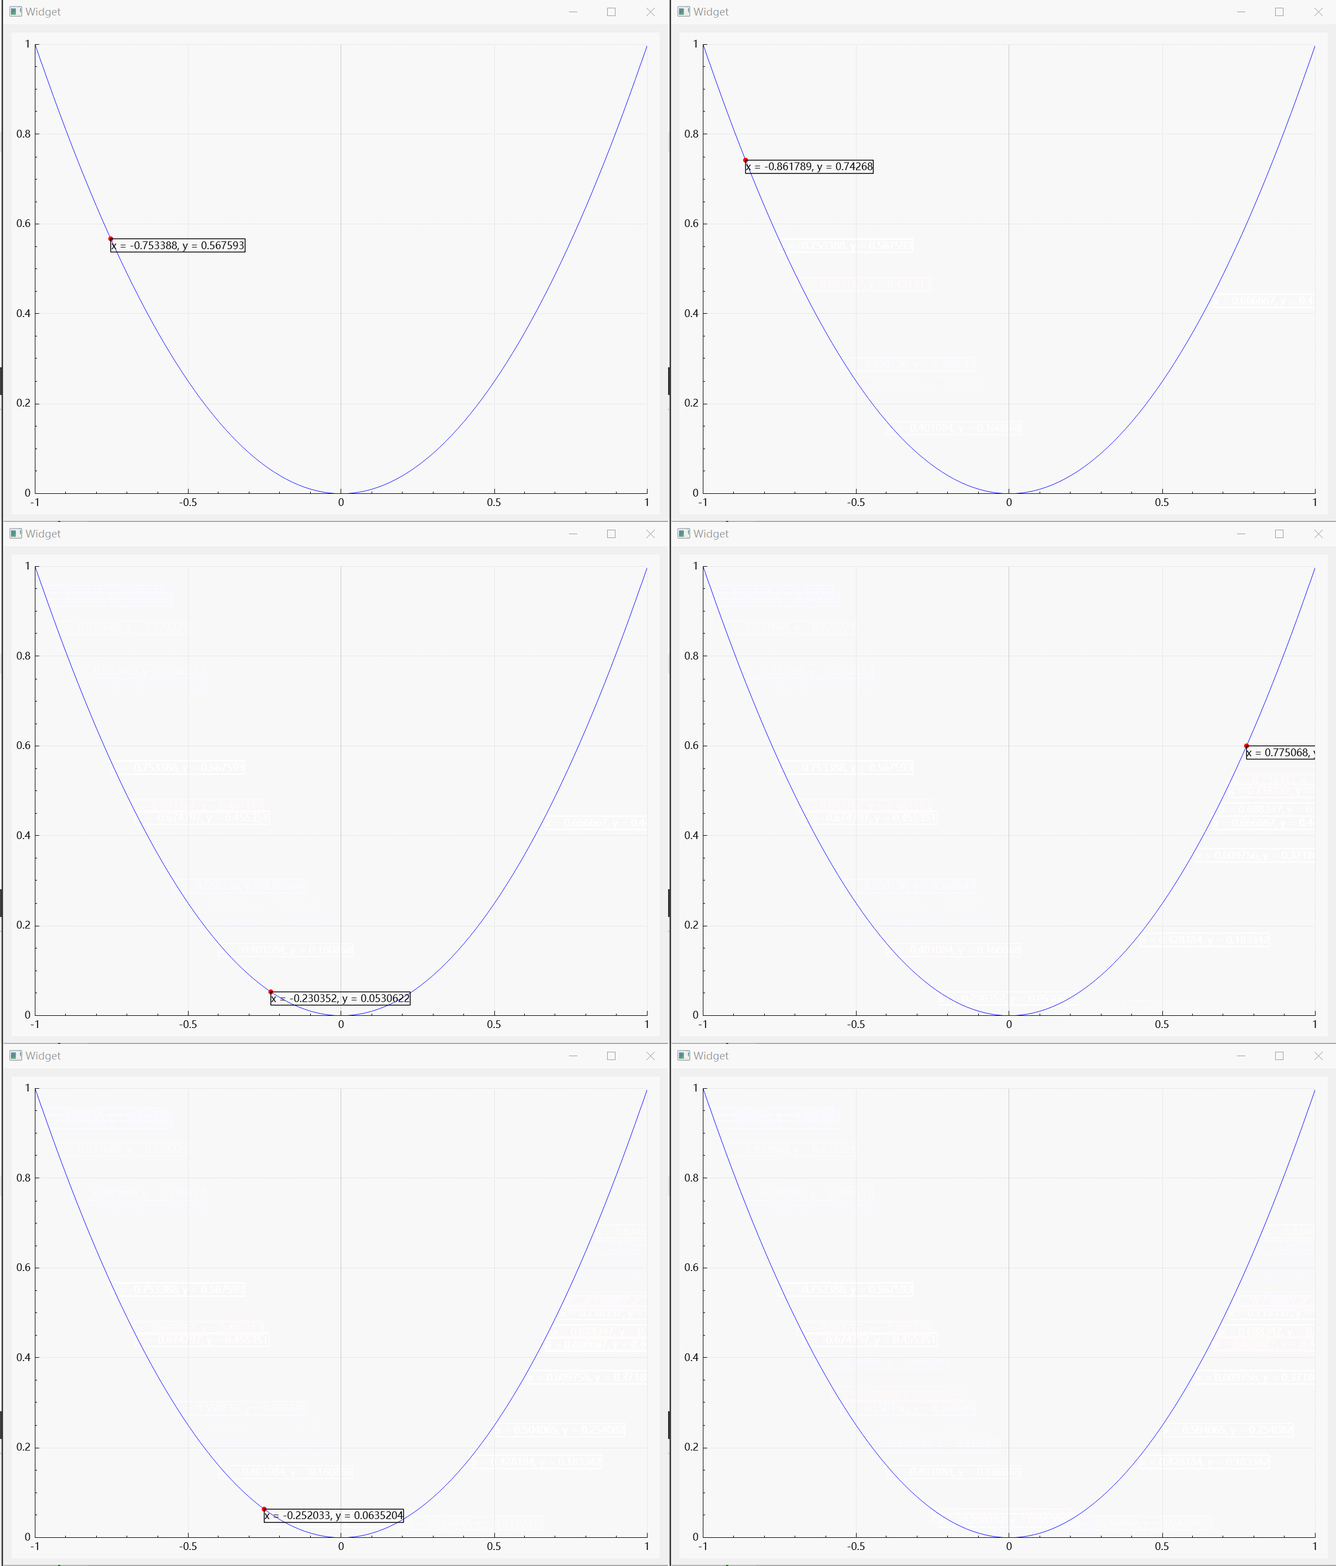
- 二、运行结果
- 三、拓展
一、代码示例
1.1 基本设置
首先新建一个widget文件,UI界面内放置一个Widget并将其提升为QCustomPlot,这里就不详细介绍,详情可参考:https://blog.csdn.net/didi_ya/article/details/120105121
1.2 widget.h头文件
包含一个槽函数,声明一个变量:
public slots:
    void mouseMove1(QMouseEvent *e);

private:
    QCustomPlot *customPlot;
    QCPItemTracer *tracer;
    QCPItemText *tracerLabel;
1.3 绘制图像
绘制图像代码如下:
customPlot = ui->customPlot;//创建customPlot
 // 生成数据,画出的是抛物线
QVector<double> x(101), y(101); //初始化向量x和y
for (int i=0; i<101; ++i)
{
  x[i] = i/50.0 - 1; // x范围[-1,1]
  y[i] = x[i]*x[i]; // y=x*x
}
customPlot->xAxis->setRange(-1, 1);
customPlot->yAxis->setRange(0, 1);
customPlot->addGraph();
customPlot->graph(0)->setData(x, y); //把数据加入到绘制器cmPlot,绘制器会自动绘制曲线
1.4 生成游标
为了实现随鼠标移动的游标功能,还要加入QCPItemTracer的指针(tracer)和QCPItemText的指针(tracerLabel)作为成员,前者就是游标,后者用于显示游标在曲线上的数据。
生成游标代码如下:
//生成游标
tracer = new QCPItemTracer(customPlot); //生成游标

tracer->setPen(QPen(Qt::red));//圆圈轮廓颜色
tracer->setBrush(QBrush(Qt::red));//圆圈圈内颜色
tracer->setStyle(QCPItemTracer::tsCircle);//圆圈
tracer->setSize(5);//设置大小
1.5 游标说明
代码如下:
//游标说明
tracerLabel = new QCPItemText(customPlot); //生成游标说明
tracerLabel->setLayer("overlay");//设置图层为overlay,因为需要频繁刷新
tracerLabel->setPen(QPen(Qt::black));//设置游标说明颜色
tracerLabel->setPositionAlignment(Qt::AlignLeft | Qt::AlignTop);//左上
tracerLabel->position->setParentAnchor(tracer->position);//将游标说明锚固在tracer位置处,实现自动跟随
1.6 mouseMove1函数
函数代码如下:
void Widget::mouseMove1(QMouseEvent *e)
{
    //获得鼠标位置处对应的横坐标数据x
    double x = customPlot->xAxis->pixelToCoord(e->pos().x());
    //double y = cmPlot->yAxis->pixelToCoord(e->pos().y());
    double xValue, yValue;

    xValue = x;//xValue就是游标的横坐标
    yValue = x*x;//yValue就是游标的纵坐标,这里直接根据产生数据的函数获得

    tracer->position->setCoords(xValue, yValue);//设置游标位置
    tracerLabel->setText(QString("x = %1, y = %2").arg(xValue).arg(yValue));//设置游标说明内容
    customPlot->replot();//绘制器一定要重绘,否则看不到游标位置更新情况
}
最后,再加入信号-槽连接语句:
//信号-槽连接语句
    connect(customPlot, SIGNAL(mouseMove(QMouseEvent*)), this, SLOT(mouseMove1(QMouseEvent*)));
二、运行结果

三、拓展
但是上述方法只适合于函数比较简单的情况(比如幂函数或指数函数),计算yValue时计算开销不大,鼠标移动时响应比较迅速。如果函数形式比较复杂,计算量大,那么应该采用以下的方法。
方法2:
void Widget::mouseMove2(QMouseEvent *e)
{
    //获得鼠标位置处对应的横坐标数据x
    double x = customPlot->xAxis->pixelToCoord(e->pos().x());

    tracer->setGraph(customPlot->graph(0)); //将游标和该曲线图层想连接
    tracer->setGraphKey(x); //将游标横坐标设置成刚获得的横坐标数据x
    tracer->setInterpolating(true); //游标的纵坐标可以通过曲线数据线性插值自动获得
    tracer->updatePosition(); //使得刚设置游标的横纵坐标位置生效
    //更新游标说明的内容
    double xValue = tracer->position->key();
    double yValue = tracer->position->value();
    tracerLabel->setText(QString("x = %1, y = %2").arg(xValue).arg(yValue));
    customPlot->replot(); //重绘
}
完整代码可以参考:https://download.csdn.net/download/didi_ya/22038184
参考:https://blog.csdn.net/weixin_45875835/article/details/104074736
最后
以上就是跳跃学姐最近收集整理的关于QCustomPlot基础教程(六)——Qt设置鼠标跟随动态显示曲线上的点的值的全部内容,更多相关QCustomPlot基础教程(六)——Qt设置鼠标跟随动态显示曲线上内容请搜索靠谱客的其他文章。
本图文内容来源于网友提供,作为学习参考使用,或来自网络收集整理,版权属于原作者所有。


发表评论 取消回复