2019独角兽企业重金招聘Python工程师标准>>> 
ELK是集中式、独立的、搜集管理各个服务和服务器上的日志信息,可以通过可视化的方式查看日志,帮助开发人员和运维人员快速处理和分析线上的问题。
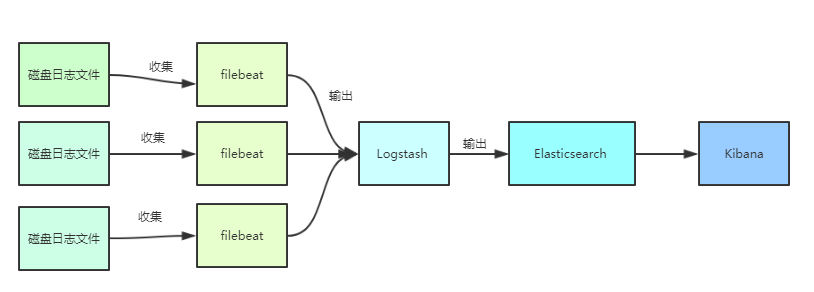
1、Filebeat负责收集应用写到磁盘上的日志,并将日志发送给logstash
2、logstash处理来自filebeat的日志,并将处理后的日志保存elasticsearch索引库。
3、elasticsearch存储来自logstash的日志。
4、kibana从elasticsearch搜索日志,并展示到页面。
下面介绍一下整个日志管理系统的搭建过程。
环境准备:centos7,java8,node-v9.8.0(kibana依赖nodejs)
准备好Filebeat,logstash,elasticsearch,kibana,可以去官网下载,这里用的版本是6.2.4
1、安装elasticsearch。
出于安全考虑,elasticsearch默认不允许以root账号运行。
创建用户:
useradd suzhe
设置密码:
passwd suzhe
切换用户:
su - suzhe
上传安装包,并解压
[suzhe@VM_108_39_centos ~]$ tar -zxvf elasticsearch-6.2.4.tar.gz
目录重命名:
mv elasticsearch-6.2.4/ elasticsearch
进入查看目录
[suzhe@VM_108_39_centos elasticsearch]$ ll
total 240
drwxr-xr-x
2 suzhe suzhe
4096 Nov
8 09:59 bin
drwxr-xr-x
2 suzhe suzhe
4096 Dec 21 10:31 config
drwxrwxr-x
3 suzhe suzhe
4096 Nov
8 10:07 data
drwxr-xr-x
2 suzhe suzhe
4096 Apr 13
2018 lib
-rw-r--r--
1 suzhe suzhe
11358 Apr 13
2018 LICENSE.txt
drwxr-xr-x
2 suzhe suzhe
4096 Dec 20 05:38 logs
drwxr-xr-x 16 suzhe suzhe
4096 Apr 13
2018 modules
-rw-r--r--
1 suzhe suzhe 191887 Apr 13
2018 NOTICE.txt
drwxr-xr-x
3 suzhe suzhe
4096 Nov
8 10:40 plugins
-rw-r--r--
1 suzhe suzhe
9268 Apr 13
2018 README.textile
[suzhe@VM_108_39_centos elasticsearch]$
修改配置
cd config 进入配置目录。
[suzhe@VM_108_39_centos elasticsearch]$ cd config
[suzhe@VM_108_39_centos config]$ ll
total 16
-rw-rw---- 1 suzhe suzhe 2878 Nov 29 20:39 elasticsearch.yml
-rw-rw---- 1 suzhe suzhe 2771 Nov
8 10:03 jvm.options
-rw-rw---- 1 suzhe suzhe 5091 Apr 13
2018 log4j2.properties
[suzhe@VM_108_39_centos config]$
jvm.options(Elasticsearch基于Lucene的,而Lucene底层是java实现,因此可以调整jvm参数 )
-Xms1g
-Xmx1g
修改elasticsearch.yml:vim elasticsearch.yml
-
修改数据和日志目录:
path.data: /home/suzhe/elasticsearch/data # 数据目录位置
path.logs: /home/suzhe/elasticsearch/logs # 日志目录位置
我们把data和logs目录修改指向了elasticsearch的安装目录。但是这两个目录并不存在,因此我们需要创建出来。
进入elasticsearch的根目录,然后创建:
mkdir data
mkdir logs
-
修改绑定的ip:
network.host: 0.0.0.0 # 绑定到0.0.0.0,允许任何ip来访问
默认只允许本机访问,修改为0.0.0.0后则可以远程访问
运行:
进入elasticsearch/bin目录可以看到elasticsearch 可执行文件
[suzhe@VM_108_39_centos elasticsearch]$ cd bin
[suzhe@VM_108_39_centos bin]$ ll
total 256
-rwxr-xr-x 1 suzhe suzhe
1557 Apr 13
2018 elasticsearch
-rw-r--r-- 1 suzhe suzhe
1431 Apr 13
2018 elasticsearch.bat
-rwxr-xr-x 1 suzhe suzhe
2238 Apr 13
2018 elasticsearch-env
-rw-r--r-- 1 suzhe suzhe
1713 Apr 13
2018 elasticsearch-env.bat
-rwxr-xr-x 1 suzhe suzhe
239 Apr 13
2018 elasticsearch-keystore
-rw-r--r-- 1 suzhe suzhe
329 Apr 13
2018 elasticsearch-keystore.bat
-rwxr-xr-x 1 suzhe suzhe
229 Apr 13
2018 elasticsearch-plugin
-rw-r--r-- 1 suzhe suzhe
319 Apr 13
2018 elasticsearch-plugin.bat
-rw-r--r-- 1 suzhe suzhe
8018 Apr 13
2018 elasticsearch-service.bat
-rw-r--r-- 1 suzhe suzhe 104448 Apr 13
2018 elasticsearch-service-mgr.exe
-rw-r--r-- 1 suzhe suzhe 103936 Apr 13
2018 elasticsearch-service-x64.exe
-rwxr-xr-x 1 suzhe suzhe
242 Apr 13
2018 elasticsearch-translog
-rw-r--r-- 1 suzhe suzhe
332 Apr 13
2018 elasticsearch-translog.bat
[suzhe@VM_108_39_centos bin]$
执行命令启动:
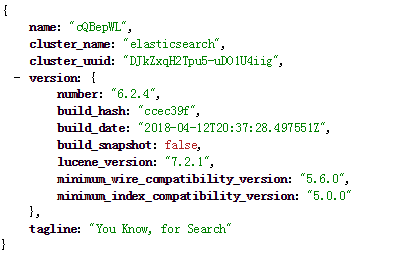
./elasticsearch -d访问:http://node:9200/ 可以看到如下的json信息。
2、安装kibana
1、解压
[root@VM_108_39_centos software]# tar -zxvf kibana-6.2.4-linux-x86_642、修改配置
配置elasticsearch的地址
# Kibana is served by a back end server. This setting specifies the port to use.
server.port: 5601
# To allow connections from remote users, set this parameter to a non-loopback address.
server.host: "0.0.0.0"
# The URL of the Elasticsearch instance to use for all your queries.
elasticsearch.url: "http://localhost:9200"
后台运行 Kibana:
[root@VM_108_39_centos software]# cd kibana-6.2.4-linux-x86_64/bin/
[root@VM_108_39_centos bin]# nohup ./kibana &
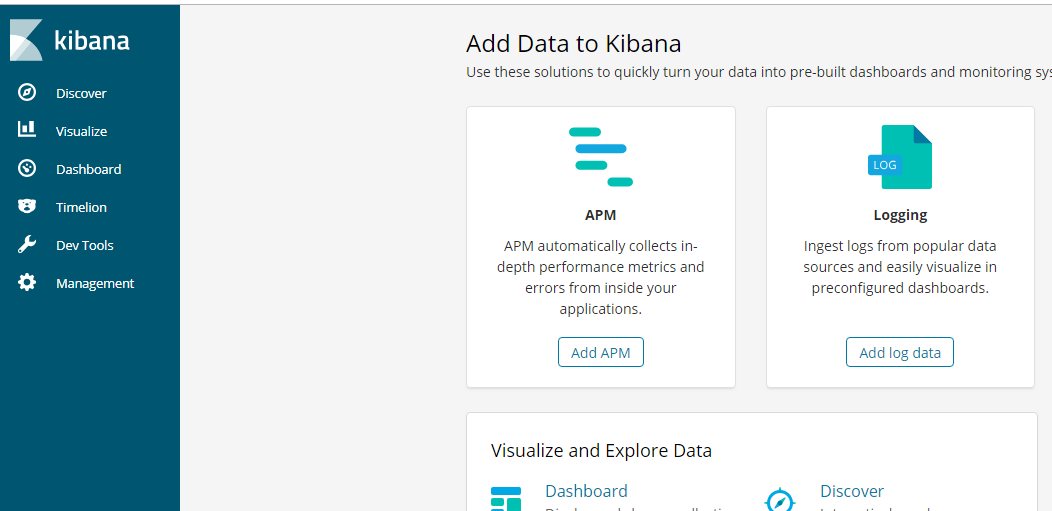
访问:http://node:5601
3、安装Logstash
解压logstash
[root@VM_108_39_centos software]# tar -zxvf logstash-6.2.4.tar.gz
创建配置文件
[root@VM_108_39_centos software]# vim logstash-6.2.4/config/filebeat-first.conf内容如下
input {
stdin {}
beats {
port => 5044
}
}
output {
elasticsearch {
hosts => ["192.168.1.56:9200"]
}
stdout {
codec => rubydebug
}
}
port是接受filebeat的端口,192.168.1.56:9200为elsticsearch的的服务地址,这儿要替换成你的地址。
启动logstash
[root@VM_108_39_centos software]# cd logstash-6.2.4/bin/
[root@VM_108_39_centos bin]# nohup ./logstash -f ../config/filebeat-first.conf &
查看进程
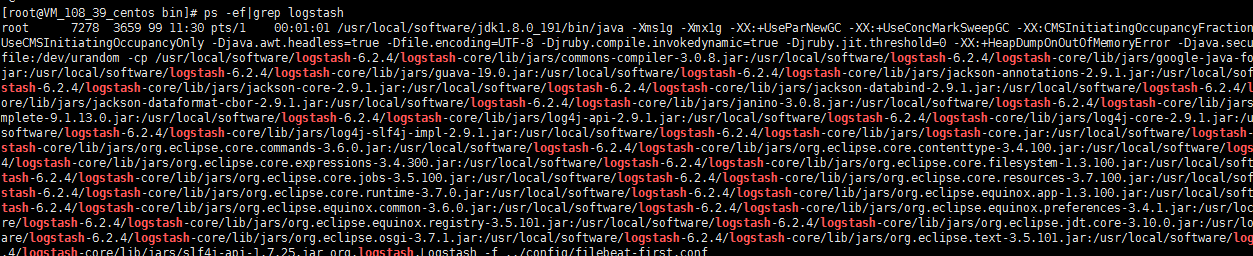
查看端口是否被监听:
[root@VM_108_39_centos bin]# netstat -lntp|grep 5044
tcp        0      0 0.0.0.0:5044            0.0.0.0:*               LISTEN      7278/java
[root@VM_108_39_centos bin]#
4、安装Filebeat
解压
[root@VM_108_39_centos software]# tar -zxvf filebeat-6.2.4-linux-x86_64.tar.gz编辑配置文件
[root@VM_108_39_centos software]# vim filebeat-6.2.4-linux-x86_64/filebeat.yml
#=========================== Filebeat prospectors =============================
filebeat.prospectors:
- type: log
enabled: true
paths:
- /data/logs/admin.log
- /data/logs/mobile.log
fields:
log_source: node1
logtype: applog
document_type: applog
multiline.pattern: '^['
multiline.negate: true
multiline.match: after
exclude_lines: ['DEBUG']
#----------------------------- Logstash output --------------------------------
output.logstash:
# The Logstash hosts
hosts: ["192.168.1.56:5044"]
filebeat.yml 配置的主要有两个部分,一个是日志收集,一个是日志输出的配置。
配置解释:
type: log 读取日志文件的每一行(默认)
enabled: true 该配置是否生效,如果改为false,将不收集该配置的日志
paths: 要抓取日志的全路径
fields: 自定义属性,可以定义多个,继续往下排就行
multiline.pattern: 正则表达式
multiline.negate: true 或 false;默认是false,匹配pattern的行合并到上一行;true,不匹配pattern的行合并到上一行
multiline.match: after 或 before,合并到上一行的末尾或开头
exclude_lines: ['DEBUG'] 该属性配置不收集DEBUG级别的日志,如果配置多行 这个配置也要放在多行的后面
192.168.1.56:5044 为输出到Logstash的地址和端口。
启动filebeat
[root@VM_108_39_centos filebeat-6.2.4-linux-x86_64]# nohup ./filebeat -e -c filebeat.yml &
5、验证
1、输入日志文件
进入/data/logs目录输入日志。
[root@VM_108_39_centos logs]# echo "删除用户" >> admin.log
[root@VM_108_39_centos logs]#
echo "提现成功 " >> mobile.log
[root@VM_108_39_centos logs]# echo "注册成功 " >> mobile.log
[root@VM_108_39_centos logs]#
echo "I love you,admin" >> admin.log
2、创建index
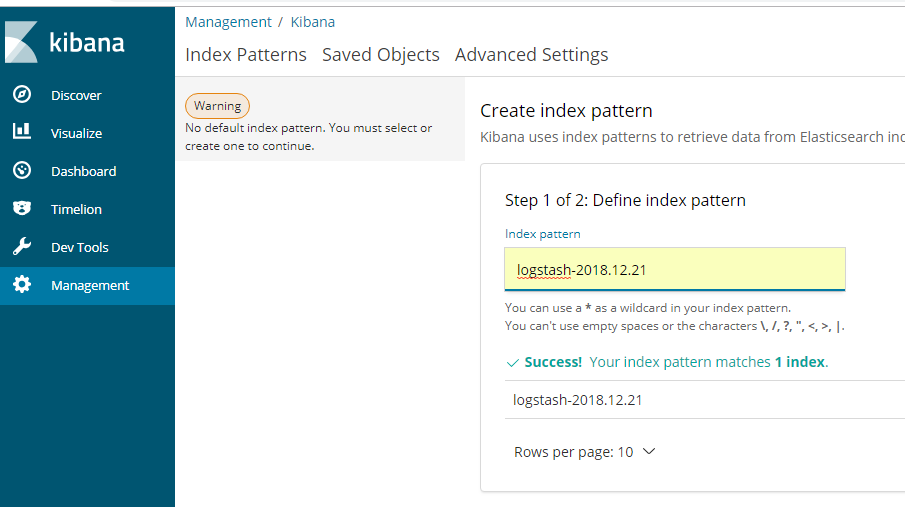
点击next step
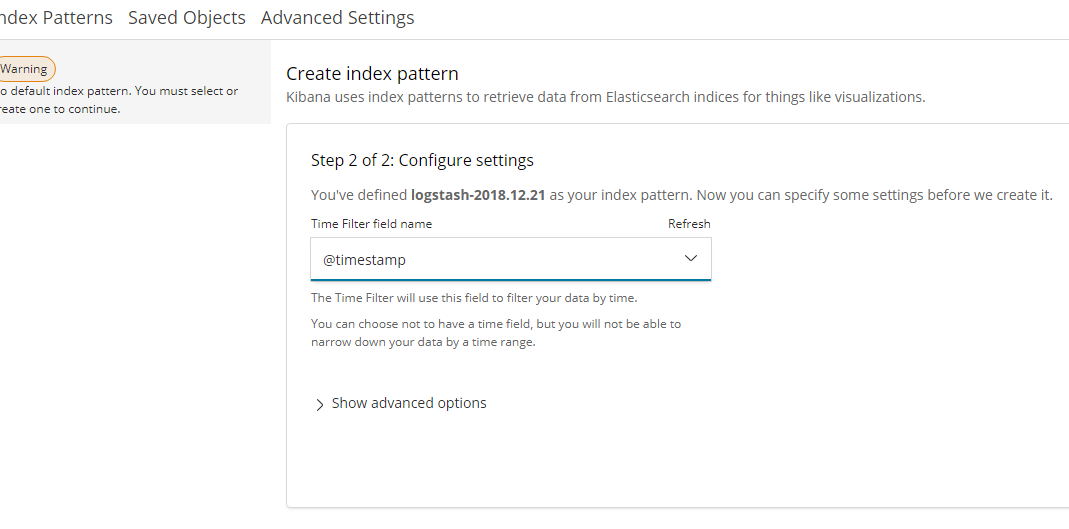
点击 create index pattern 创建索引
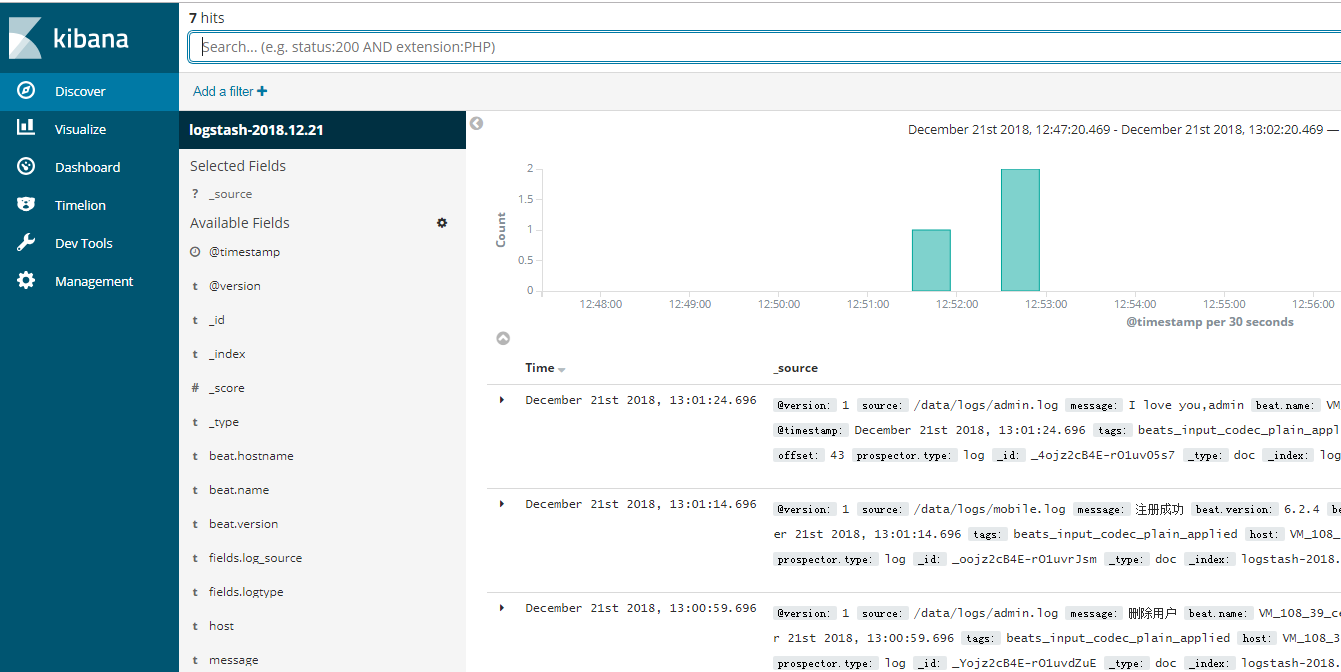
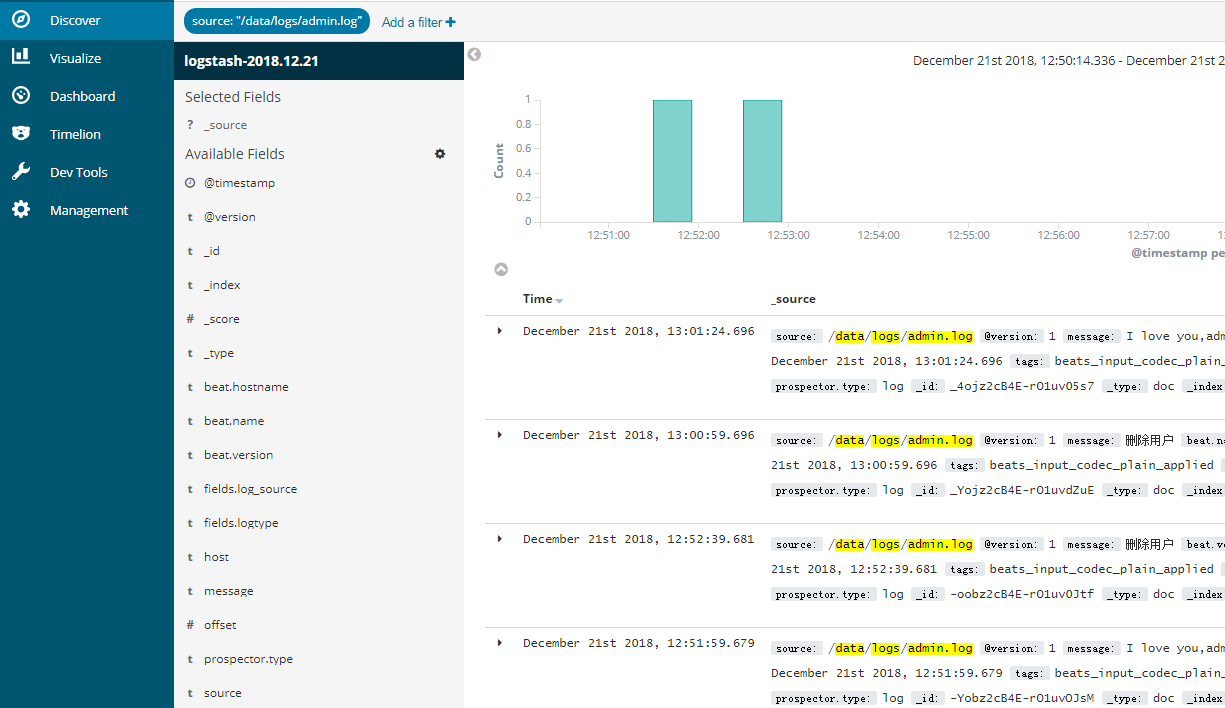
点击 discover可查看日志
根据source过滤,只查看admin的日志
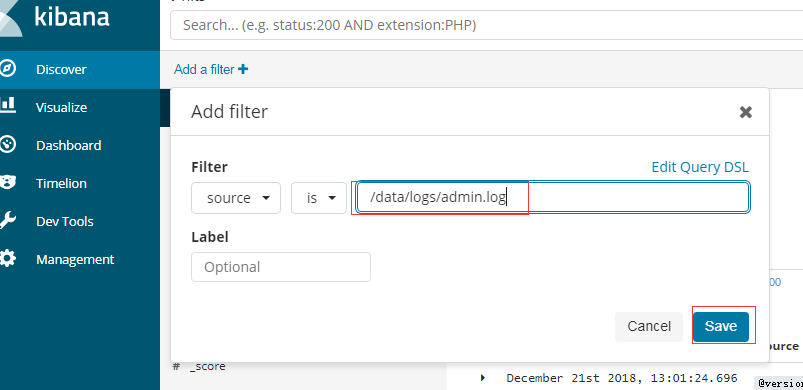
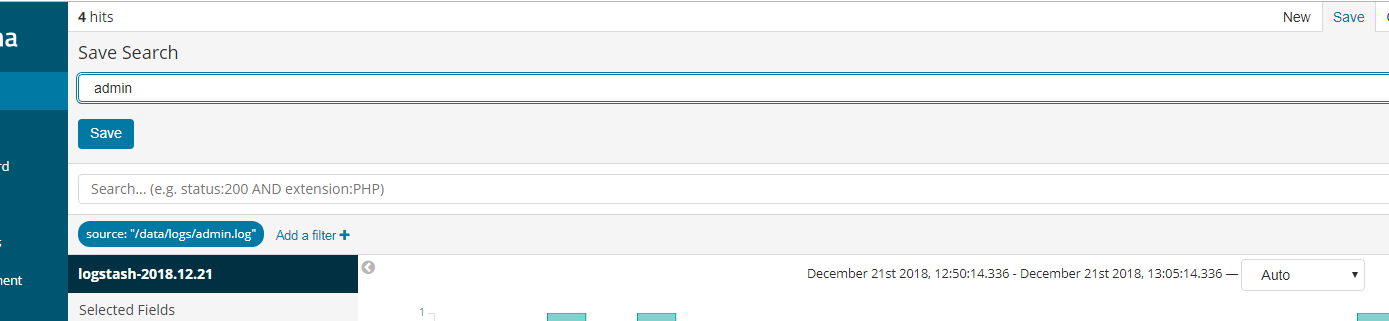
点击保存,可以看到只有admin的日志。
保存该过滤条件
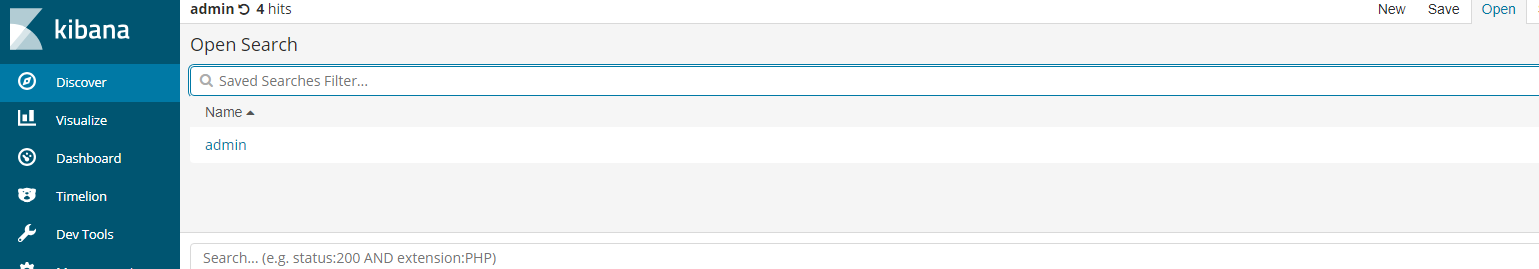
下次再查看日志可以直接点击open--》点击admin进行查看
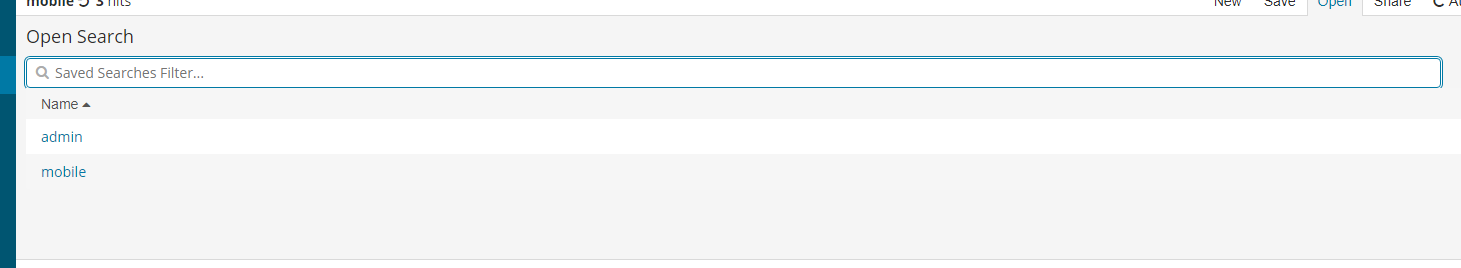
同理mobile也可以配置好过滤,下次查看日志的时候直接根据情况选择admin或者mobile。
ok,到这里,整个日志管理系统就搭建好了。
6、思考
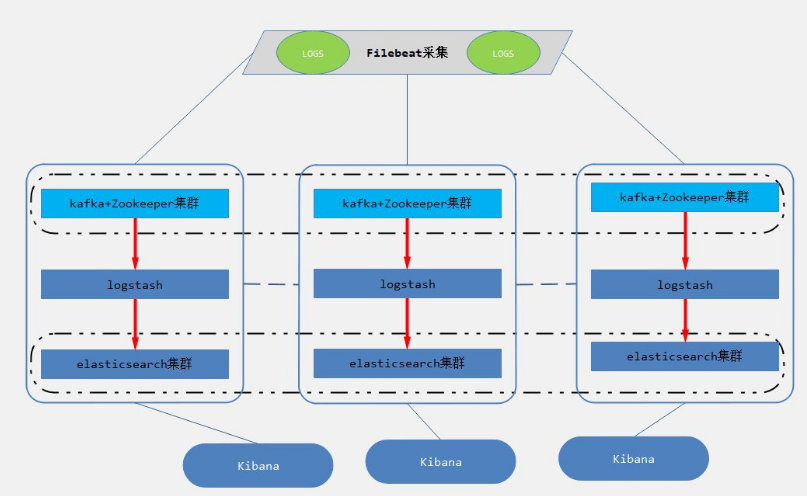
以上对于一般的中小型公司,上面的系统基本上可以满足需求,只是需要做到高可用(logstash集群,elasticsearch集群,kibana高可用),这部分比较简单。但是对于高并发场景,可能会产生大量的日志,大量的数据涌入Logstash集群以及elasticsearch集群,可能系统会遇到流量上的瓶颈。
如何解决这个问题?
加入数据缓冲层,日志采集客户端采集来的数据,转存到kafka+zookeeper集群中,做一个消息队列,让数据有一定的缓冲。如图所示:
转载于:https://my.oschina.net/suzheworld/blog/2991522
最后
以上就是奋斗电源最近收集整理的关于Elk+filebeat搭建日志系统1、安装elasticsearch。2、安装kibana3、安装Logstash4、安装Filebeat5、验证6、思考的全部内容,更多相关Elk+filebeat搭建日志系统1、安装elasticsearch内容请搜索靠谱客的其他文章。


发表评论 取消回复