简介
Go 有非常多好用的工具,pprof 可以用来分析一个程序的性能。pprof 有以下 4 种类型:
CPU profiling(CPU 性能分析):这是最常使用的一种类型。用于分析函数或方法的执行耗时;
Memory profiling:这种类型也常使用。用于分析程序的内存占用情况;
Block profiling:这是 Go 独有的,用于记录 goroutine 在等待共享资源花费的时间;
Mutex profiling:与 Block profiling 类似,但是只记录因为锁竞争导致的等待或延迟。
我们主要介绍前两种类型。Go 中 pprof 相关的功能在包runtime/pprof中。
CPU profiling
pprof 使用非常简单。首先调用pprof.StartCPUProfile()启用 CPU profiling。它接受一个io.Writer类型的参数,pprof会将分析结果写入这个io.Writer中。为了方便事后分析,我们写到一个文件中。
在要分析的代码后调用pprof.StopCPUProfile()。那么StartCPUProfile()和StopCPUProfile()之间的代码执行情况都会被分析。方便起见可以直接在StartCPUProfile()后,用defer调用StopCPUProfile(),即分析这之后的所有代码。
我们现在实现一个计算斐波那契数列的第n数的函数:
func fib(n int) int {
  if n <= 1 {
    return 1
  }

  return fib(n-1) + fib(n-2)
}
然后使用 pprof 分析一下运行情况:
func main() {
  f, _ := os.OpenFile("cpu.profile", os.O_CREATE|os.O_RDWR, 0644)
  defer f.Close()
  pprof.StartCPUProfile(f)
  defer pprof.StopCPUProfile()

  n := 10
  for i := 1; i <= 5; i++ {
    fmt.Printf("fib(%d)=%dn", n, fib(n))
    n += 3 * i
  }
}
执行go run main.go,会生成一个cpu.profile文件。这个文件记录了程序的运行状态。使用go tool pprof命令分析这个文件:
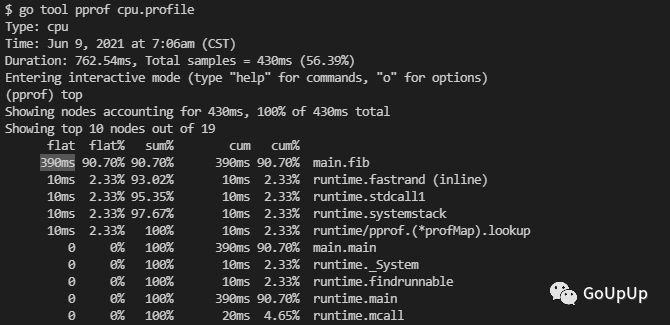
上面用top命令查看耗时最高的 10 个函数。可以看到fib函数耗时最高,累计耗时 390ms,占了总耗时的 90.70%。我们也可以使用top5和top20分别查看耗时最高的 5 个 和 20 个函数。
当找到耗时较多的函数,我们还可以使用list命令查看该函数是怎么被调用的,各个调用路径上的耗时是怎样的。list命令后跟一个表示方法名的模式:
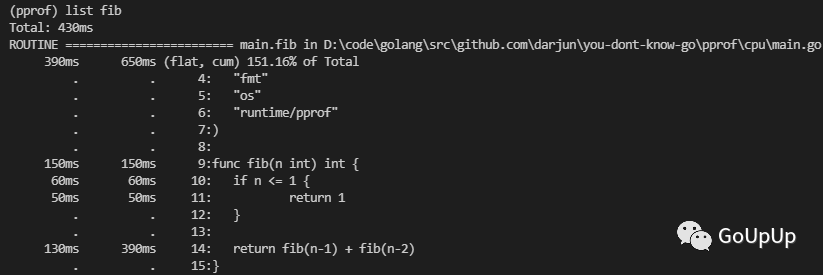
我们知道使用递归求解斐波那契数存在大量重复的计算。下面我们来优化一下这个函数:
func fib2(n int) int {
  if n <= 1 {
    return 1
  }

  f1, f2 := 1, 1
  for i := 2; i <= n; i++ {
    f1, f2 = f2, f1+f2
  }

  return f2
}
改用迭代之后耗时如何呢?我们来测一下。首先执行go run main.go生成cpu.profile文件,然后使用go tool pprof分析:
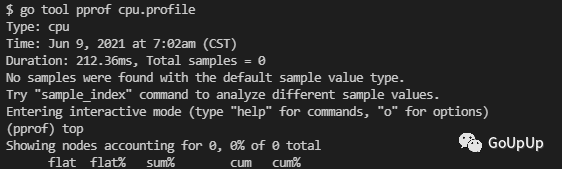
这里 top 看到的列表是空的。因为启用 CPU profiling 之后,运行时每隔 10ms 会中断一次,记录每个 goroutine 当前执行的堆栈,以此来分析耗时。我们优化之后的代码,在运行时还没来得及中断就执行完了,因此没有信息。
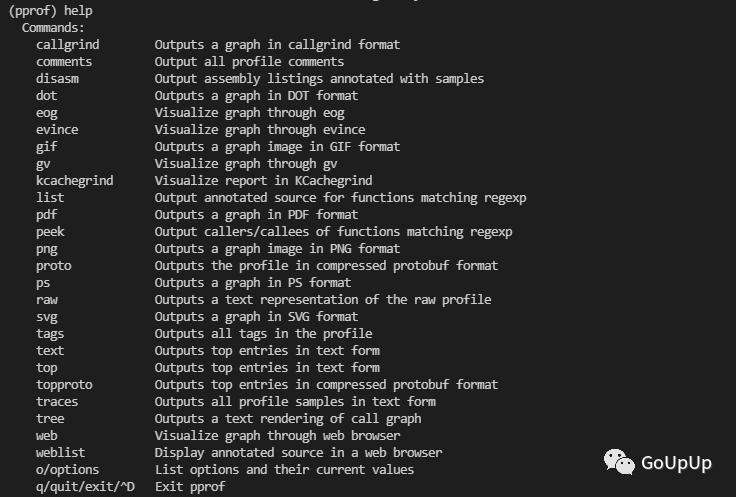
go tool pprof 执行的所有命令可以通过help查看:
Memory profiling
内存分析有所不同,我们可以在程序运行过程中随时查看堆内存情况。下面我们编写一个生成随机字符串,和将字符串重复n次的函数:
const Letters = "abcdefghijklmnopqrstuvwxyzABCDEFGHIJKLMNOPQRSTUVWXYZ"

func generate(n int) string {
  var buf bytes.Buffer
  for i := 0; i < n; i++ {
    buf.WriteByte(Letters[rand.Intn(len(Letters))])
  }
  return buf.String()
}

func repeat(s string, n int) string {
  var result string
  for i := 0; i < n; i++ {
    result += s
  }

  return result
}
编写程序,调用上面的函数,记录内存占用情况:
func main() {
  f, _ := os.OpenFile("mem.profile", os.O_CREATE|os.O_RDWR, 0644)
  defer f.Close()
  for i := 0; i < 100; i++ {
    repeat(generate(100), 100)
  }

  pprof.Lookup("heap").WriteTo(f, 0)
}
这里在循环结束后,通过pprof.Lookup("heap")查看堆内存的占用情况,并将结果写到文件mem.profile中。
运行go run main.go生成mem.profile文件,然后使用go tool pprof mem.profile来分析:
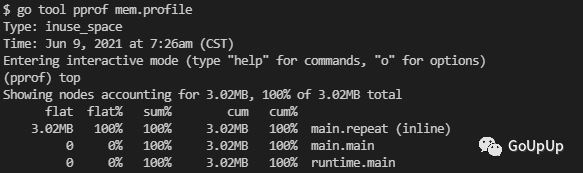
当然也可以使用list命令查看,内存在哪一行分配的:
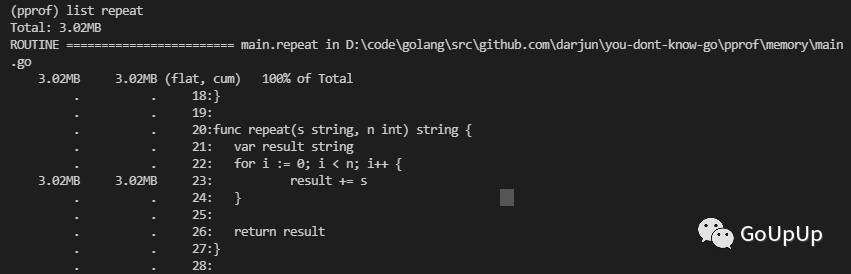
结果在预期之中,因为字符串拼接要会占用不少临时空间。
pkg/profile
runtime/pprof使用起来有些不便,因为要重复编写打开文件,开启分析,结束分析的代码。所以出现了包装了runtime/pprof的库:pkg/profile。pkg/profile的 GitHub 仓库地址为:https://github.com/pkg/profile。pkg/profile只是对runtime/pprof做了一层封装,让它更好用。使用pkg/profile可以将代码简化为一行。使用前需要使用go get github.com/pkg/profile获取这个库。
defer profile.Start().Stop()
默认启用的是 CPU profiling,数据写入文件cpu.pprof。使用它来分析我们的fib程序性能:
$ go run main.go
2021/06/09 21:10:36 profile: cpu profiling enabled, C:UsersADMINI~1AppDataLocalTempprofile594431395cpu.pprof
fib(10)=89
fib(13)=377
fib(19)=6765
fib(28)=514229
fib(40)=165580141
2021/06/09 21:10:37 profile: cpu profiling disabled, C:UsersADMINI~1AppDataLocalTempprofile594431395cpu.pprof
控制台会输出分析结果写入的文件路径。
如果要启用 Memory profiling,可以传入函数选项MemProfile:
defer profile.Start(profile.MemProfile).Stop()
另外还可以通过函数选项控制内存采样率,默认为 4096。我们可以改为 1:
defer profile.Start(profile.MemProfile, profile.MemProfileRate(1)).Stop()
火焰图
通过命令行查看 CPU 或内存情况不够直观。Bredan Gregg 大神发明了火焰图(Flame Graph)可以很直观地看到内存和 CPU 消耗情况。新版本的 go tool pprof 工具已经集成了火焰图(我使用的是 Go1.16)。想要生成火焰图,必须安装 graphviz。
在 Mac 上:
brew install graphviz
在 Ubuntu 上:
apt install graphviz
在 Windows 上,官网下载页http://www.graphviz.org/download/有可执行安装文件,下载安装即可。注意设置 PATH 路径。
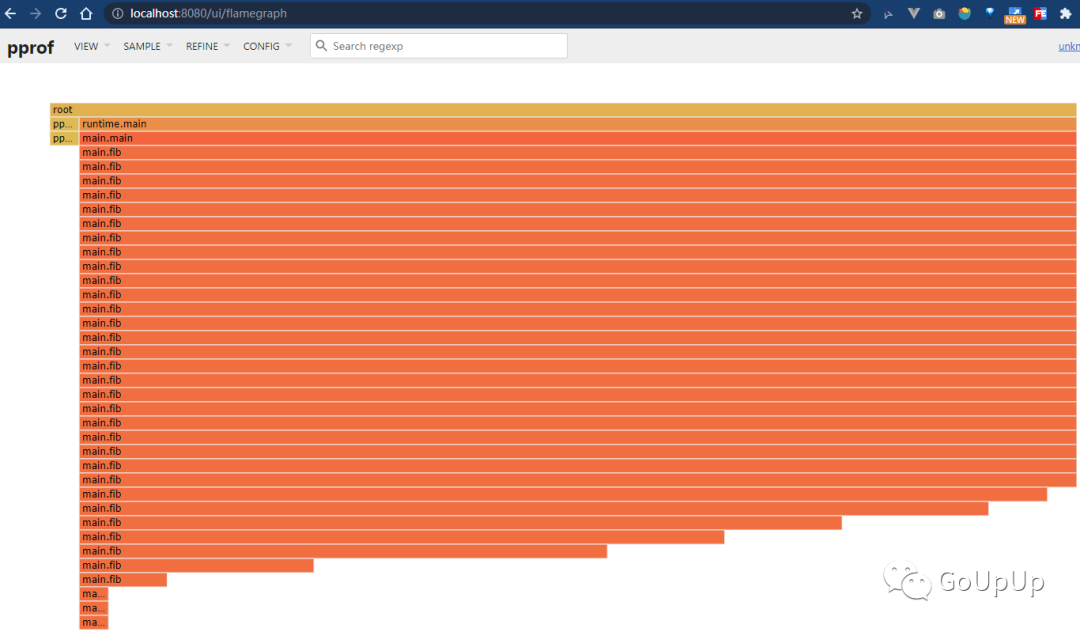
上面程序生成的 cpu.profile 和 mem.profile 我们可以直接在网页上查看火焰图。执行下面命令:
go tool pprof -http :8080 cpu.profile
默认会打开浏览器窗口,显示下面的页面:
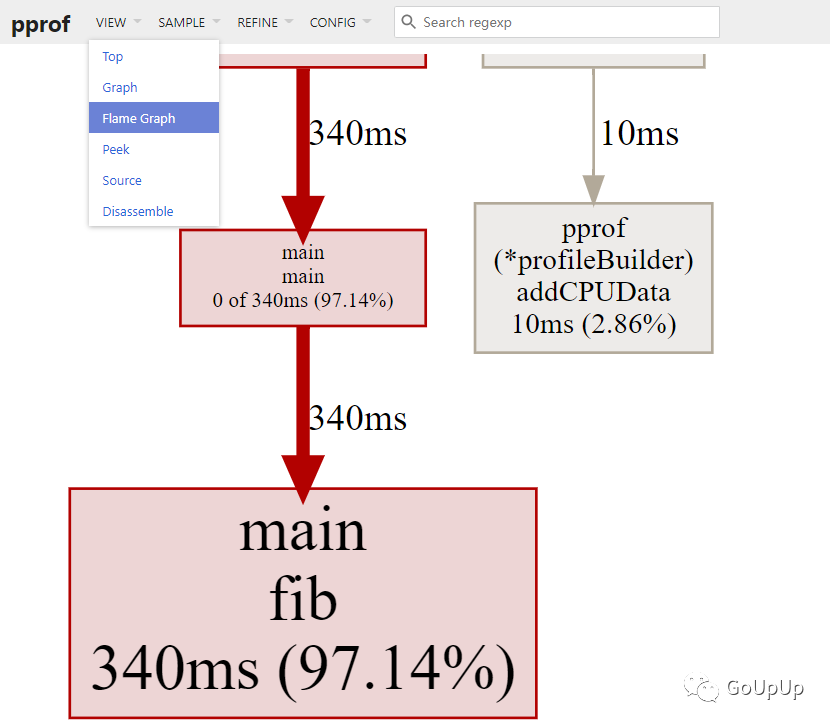
我们可以在 VIEW 菜单栏中切换显示火焰图:
可以用鼠标在火焰图上悬停、点击,来查看具体的某个调用。
net/http/pprof
如果线上遇到 CPU 或内存占用过高,该怎么办呢?总不能将上面的 Profile 代码编译到生产环境吧,这无疑会极大地影响性能。net/http/pprof提供了一个方法,不使用时不会造成任何影响,遇到问题时可以开启 profiling 帮助我们排查问题。我们只需要使用import这个包,然后在一个新的 goroutine 中调用http.ListenAndServe()在某个端口启动一个默认的 HTTP 服务器即可:
import (
  _ "net/http/pprof"
)

func NewProfileHttpServer(addr string) {
  go func() {
    log.Fatalln(http.ListenAndServe(addr, nil))
  }()
}
下面我们编写一个 HTTP 服务器,将前面示例中的求斐波那契数和重复字符串搬到 Web 上。为了让测试结果更明显一点,我把原来执行一次的函数都执行了 1000 次:
func fibHandler(w http.ResponseWriter, r *http.Request) {
  n, err := strconv.Atoi(r.URL.Path[len("/fib/"):])
  if err != nil {
    responseError(w, err)
    return
  }

  var result int
  for i := 0; i < 1000; i++ {
    result = fib(n)
  }
  response(w, result)
}

func repeatHandler(w http.ResponseWriter, r *http.Request) {
  parts := strings.SplitN(r.URL.Path[len("/repeat/"):], "/", 2)
  if len(parts) != 2 {
    responseError(w, errors.New("invalid params"))
    return
  }

  s := parts[0]
  n, err := strconv.Atoi(parts[1])
  if err != nil {
    responseError(w, err)
    return
  }

  var result string
  for i := 0; i < 1000; i++ {
    result = repeat(s, n)
  }
  response(w, result)
}
创建 HTTP 服务器,注册处理函数:
func main() {
  mux := http.NewServeMux()
  mux.HandleFunc("/fib/", fibHandler)
  mux.HandleFunc("/repeat/", repeatHandler)

  s := &http.Server{
    Addr:    ":8080",
    Handler: mux,
  }

  NewProfileHttpServer(":9999")

  if err := s.ListenAndServe(); err != nil {
    log.Fatal(err)
  }
}
我们另外启动了一个 HTTP 服务器用于处理 pprof 相关请求。
另外为了测试,我编写了一个程序,一直发送 HTTP 请求给这个服务器:
func doHTTPRequest(url string) {
  resp, err := http.Get(url)
  if err != nil {
    fmt.Println("error:", err)
    return
  }

  data, _ := ioutil.ReadAll(resp.Body)
  fmt.Println("ret:", len(data))
  resp.Body.Close()
}

func main() {
  var wg sync.WaitGroup
  wg.Add(2)
  go func() {
    defer wg.Done()
    for {
      doHTTPRequest(fmt.Sprintf("http://localhost:8080/fib/%d", rand.Intn(30)))
      time.Sleep(500 * time.Millisecond)
    }
  }()

  go func() {
    defer wg.Done()
    for {
      doHTTPRequest(fmt.Sprintf("http://localhost:8080/repeat/%s/%d", generate(rand.Intn(200)), rand.Intn(200)))
      time.Sleep(500 * time.Millisecond)
    }
  }()
  wg.Wait()
}
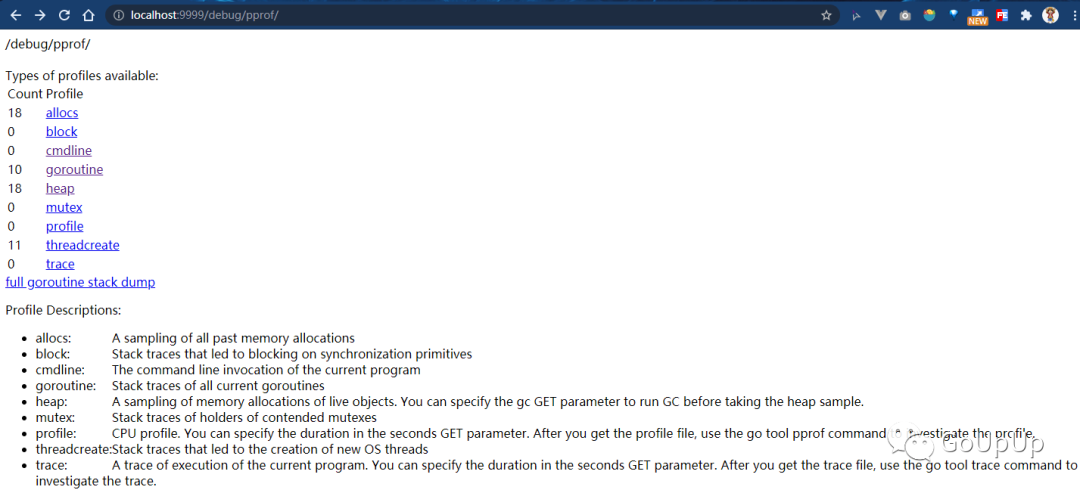
使用命令go run main.go启动服务器。运行上面的程序一直发送请求给服务器。一段时间之后,我们可以用浏览器打开http://localhost:9999/debug/pprof/:
go tool pprof也支持远程获取 profile 文件:
$ go tool pprof -http :8080 localhost:9999/debug/pprof/profile?seconds=120

其中seconds=120表示采样 120s,默认为 30s。结果如下:
可以看出这里除了运行时的消耗,主要就是fibHandler和repeatHandler这两个处理的消耗了。
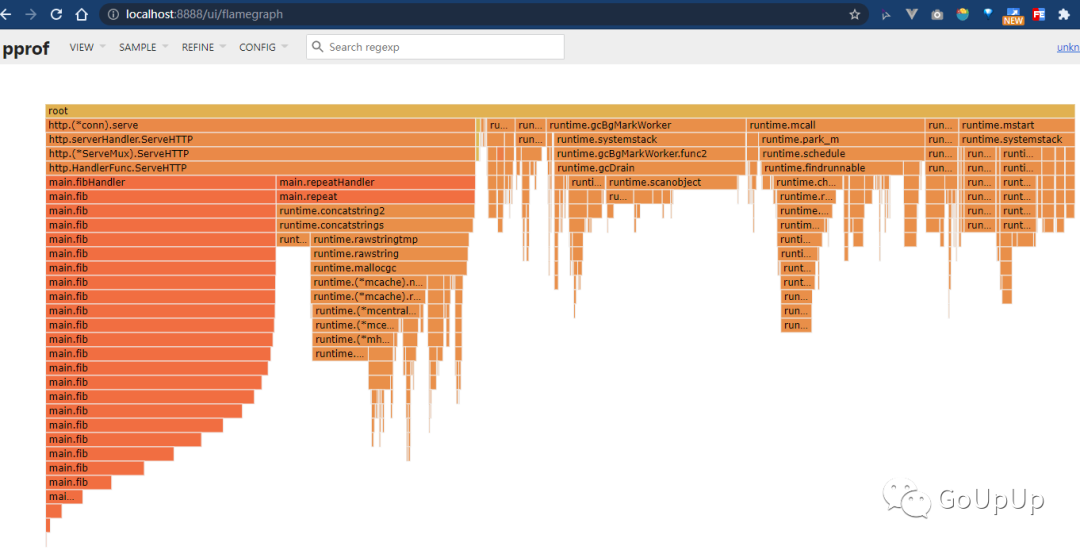
当然一般线上不可能把这个端口开放出来,因为有很大的安全风险。所以,我们一般在线上机器 profile 生成文件,将文件下载到本地分析。上面我们看到go tool pprof会生成一个文件保存在本地,例如我的机器上是C:UsersAdministratorpprofpprof.samples.cpu.001.pb.gz。把这个文件下载到本地,然后:
$ go tool pprof -http :8888 pprof.samples.cpu.001.pb.gz
net/http/pprof 实现
net/http/pprof的实现也没什么神秘的地方,无非就是在net/http/pprof包的init()函数中,注册了一些处理函数:
// src/net/http/pprof/pprof.go
func init() {
  http.HandleFunc("/debug/pprof/", Index)
  http.HandleFunc("/debug/pprof/cmdline", Cmdline)
  http.HandleFunc("/debug/pprof/profile", Profile)
  http.HandleFunc("/debug/pprof/symbol", Symbol)
  http.HandleFunc("/debug/pprof/trace", Trace)
}
http.HandleFunc()会将处理函数注册到默认的ServeMux中:
// src/net/http/server.go
var DefaultServeMux = &defaultServeMux
var defaultServeMux ServeMux

func HandleFunc(pattern string, handler func(ResponseWriter, *Request)) {
  DefaultServeMux.HandleFunc(pattern, handler)
}
这个DefaultServeMux是net/http的包级变量,只有一个实例。为了避免路径冲突,通常我们不建议在自己编写 HTTP 服务器的时候使用默认的DefaultServeMux。一般都是先调用http.NewServeMux()创建一个新的ServeMux,见上面的 HTTP 示例代码。
再来看net/http/pprof包注册的处理函数:
// src/net/http/pprof/pprof.go
func Profile(w http.ResponseWriter, r *http.Request) {
  // ...
  if err := pprof.StartCPUProfile(w); err != nil {
    serveError(w, http.StatusInternalServerError,
      fmt.Sprintf("Could not enable CPU profiling: %s", err))
    return
  }
  sleep(r, time.Duration(sec)*time.Second)
  pprof.StopCPUProfile()
}
删掉前面无关的代码,这个函数也是调用runtime/pprof的StartCPUProfile(w)方法开始 CPU profiling,然后睡眠一段时间(这个时间就是采样间隔),最后调用pprof.StopCPUProfile()停止采用。StartCPUProfile()方法传入的是http.ResponseWriter类型变量,所以采样结果直接写回到 HTTP 的客户端。
内存 profiling 的实现用了一点技巧。首先,我们在init()函数中没有发现处理内存 profiling 的处理函数。实现上,/debug/pprof/heap路径都会走到Index()函数中:
// src/net/http/pprof/pprof.go
func Index(w http.ResponseWriter, r *http.Request) {
  if strings.HasPrefix(r.URL.Path, "/debug/pprof/") {
    name := strings.TrimPrefix(r.URL.Path, "/debug/pprof/")
    if name != "" {
      handler(name).ServeHTTP(w, r)
      return
    }
  }
  // ...
}
最终会走到handler(name).ServeHTTP(w, r)。handler只是基于string类型定义的一个新类型,它定义了ServeHTTP()方法:
type handler string

func (name handler) ServeHTTP(w http.ResponseWriter, r *http.Request) {
  p := pprof.Lookup(string(name))
  // ...
  p.WriteTo(w, debug)
}
删掉其他无关的代码,就剩下上面两行。统计数据将会写入http.ResponseWriter。
Benchmark
其实在Benchmark时也可以生成cpu.profile、mem.profile这些分析文件。我们在第一个示例的目录下新建一个bench_test.go文件:
func BenchmarkFib(b *testing.B) {
  for i := 0; i < b.N; i++ {
    fib(30)
  }
}
然后执行命令go test -bench . -test.cpuprofile cpu.profile:
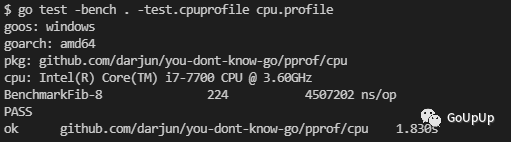
然后就可以分析这个cpu.profile文件了。
总结
本文介绍了 pprof 工具的使用,以及更方便使用的库pkg/profile,另外介绍如何使用net/http/pprof给线上程序加个保险,遇到问题随时可以诊断。没有遇到问题不会对性能有任何影响。
参考
pkg/profile GitHub:https://github.com/pkg/profile
你不知道的Go GitHub:https://github.com/darjun/you-dont-know-go
我
我的博客:https://darjun.github.io
欢迎关注我的微信公众号【GoUpUp】,共同学习,一起进步~
最后
以上就是瘦瘦紫菜最近收集整理的关于你不知道的 Go 之 pprof的全部内容,更多相关你不知道的内容请搜索靠谱客的其他文章。


![[UE4]点积、余弦和急停](https://www.shuijiaxian.com/files_image/reation/bcimg1.png)


发表评论 取消回复