import jieba
import jieba.posseg as peg
import matplotlib.pyplot as plt使用jieba库对自然语言进行处理,以及使用matplotlib的pyplot库将数据用饼状图表示。
class CUT():
def __init__(self):
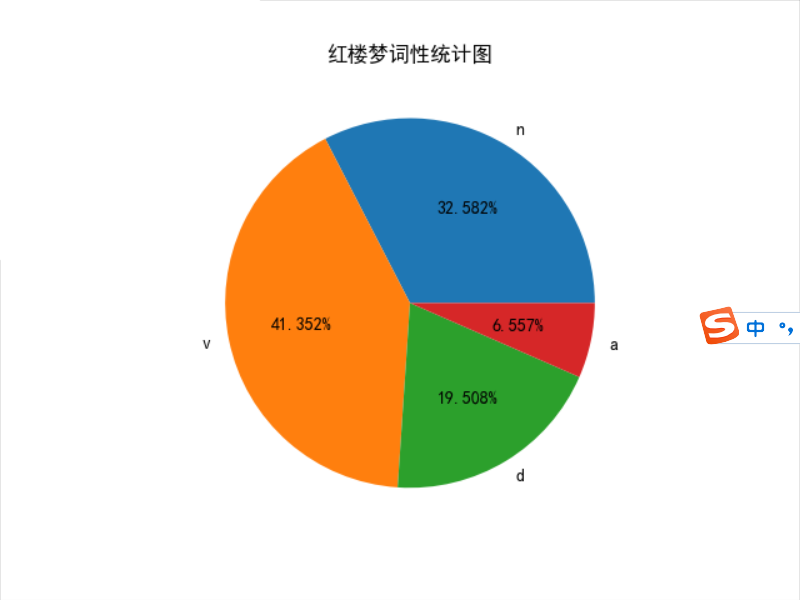
self.labels = 'n','v','d','a' ### 词性标签,主要对名词,动词,副词以及形容词进行统计
self.label_list= ['n','v','d','a']
self.num_list = [0,0,0,0] ###数量列表这里统计的主要是名词,动词,副词及形容词的统计
    def cut(self,dicpath):
        with open (dicpath,'rb') as f:
            for line in f:
                words = peg.cut(line)  ###使用jieba对line分词及词性标注
                for x in words:
                    if x.flag  in self.label_list:  ###判断x的词性是否存在词性列表中
                        if x.flag == 'n':
                            index1 = 0
                        if x.flag == 'v':
                            index1 = 1
                        if x.flag == 'd':
                            index1 = 2
                        if x.flag == 'a':
                            index1 = 3
                        self.num_list[index1] += 1
定义cut()method对文本进行分词, 使用'rb'按照二进制位进行读取的,不会将读取的字节转换成字符。
peg.cut(line)返回word和flag两个值,可以采用for word,flag in words:对词及词性进行引用。
    def show_pie(self):                 ###定义展现饼状图的方法
        lt = []
        for i in range(len(self.num_list)):
            result = self.num_list[i]/sum(self.num_list)
            lt.append(result)
        plt.rcParams['font.sans-serif'] = ['SimHei']
        plt.pie(x=lt,autopct='%1.3f%%',labels=self.labels)
        plt.title('红楼梦词性统计图')
        plt.show()
python中使用matplotlib绘制饼状图,常用的参数如下:
plt.pie(x, explode=None, labels=None, colors=None, autopct=None, pctdistance=0.6, shadow=False, labeldistance=1.1, startangle=None, radius=None, counterclock=True, wedgeprops=None, textprops=None, center=(0, 0), frame=False)
作者主要使用的是x,labels,autopct三个参数。
其中x为指定绘图的数据,数据需为整型的浮点数,列表中的数需要小于1。
autopct:自动添加百分比显示,可以采用格式化的方法显示,可设置保留几位小数,如保留让浮点数保留两位小数点可采用autopct='%1.2f%%'。
labels:为图示添加标签。
if __name__ == '__main__':
    seq = CUT()
    seq.cut('hlm.txt')
    seq.show_pie()
结果如下:
画饼状图主要参照网址:https://blog.csdn.net/qq_41294281/article/details/106970304?utm_medium=distribute.pc_relevant_download.none-task-blog-baidujs-2.nonecase&depth_1-utm_source=distribute.pc_relevant_download.none-task-blog-baidujs-2.nonecase
最后
以上就是大意钻石最近收集整理的关于python--对自然语言词性统计及饼状图表示的全部内容,更多相关python--对自然语言词性统计及饼状图表示内容请搜索靠谱客的其他文章。

![[LeetCode]Sort Characters By Frequency@Python](https://www.shuijiaxian.com/files_image/reation/bcimg18.png)


发表评论 取消回复