class my_model(Model):
    def __init__(self, dim):
        super(my_model, self).__init__()
        self.Base  = VGG16(input_shape=(dim), include_top = False, weights = 'imagenet')
        self.GAP   = L.GlobalAveragePooling2D()
        self.BAT   = L.BatchNormalization()
        self.DROP  = L.Dropout(rate=0.1)
        self.DENS  = L.Dense(256, activation='relu', name = 'dense_A')
        self.OUT   = L.Dense(1, activation='sigmoid')

    def call(self, inputs):
        x  = self.Base(inputs)
        g  = self.GAP(x)
        b  = self.BAT(g)
        d  = self.DROP(b)
        d  = self.DENS(d)
        return self.OUT(d)

    # AFAIK: The most convenient method to print model.summary()
    # similar to the sequential or functional API like.
    def build_graph(self):
        x = Input(shape=(dim))
        return Model(inputs=[x], outputs=self.call(x))

dim = (124,124,3)
model = my_model((dim))
model.build((None, *dim))
model.build_graph().summary()
It will produce as follows:
Layer (type)                 Output Shape              Param #
=================================================================
input_67 (InputLayer)        [(None, 124, 124, 3)]     0
_________________________________________________________________
vgg16 (Functional)           (None, 3, 3, 512)         14714688
_________________________________________________________________
global_average_pooling2d_32  (None, 512)               0
_________________________________________________________________
batch_normalization_7 (Batch (None, 512)               2048
_________________________________________________________________
dropout_5 (Dropout)          (None, 512)               0
_________________________________________________________________
dense_A (Dense)              (None, 256)               402192
_________________________________________________________________
dense_7 (Dense)              (None, 1)                 785
=================================================================
Total params: 14,848,321
Trainable params: 14,847,297
Non-trainable params: 1,024
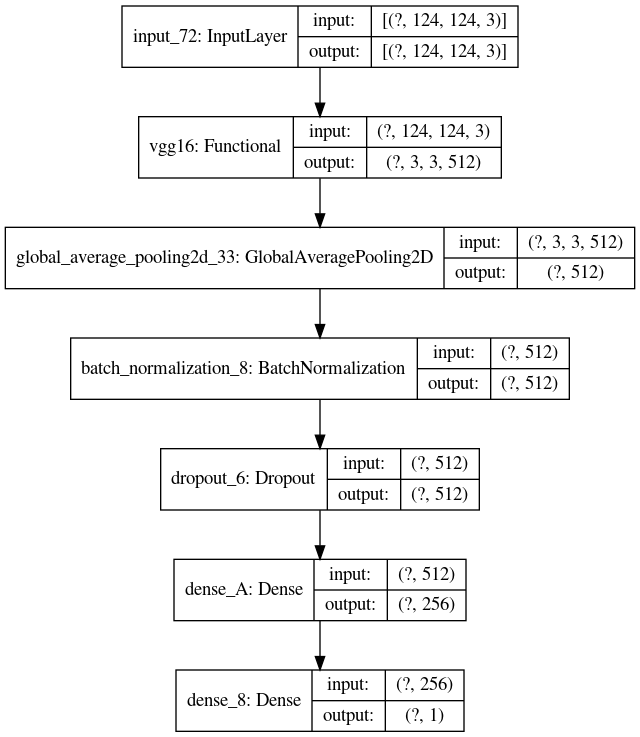
Now by using the build_graph function, we can simply plot the whole architecture.
# Just showing all possible argument for newcomer.
tf.keras.utils.plot_model(
    model.build_graph(),                      # here is the trick (for now)
    to_file='model.png', dpi=96,              # saving
    show_shapes=True, show_layer_names=True,  # show shapes and layer name
    expand_nested=False                       # will show nested block
)
It will produce as follows: -)
PS
有时安装Graphviz后还是提示找不到,可以在程序中加入:
os.environ[“PATH”] += os.pathsep + ‘C:/Program Files (x86)/Graphviz2.38/bin/’
参考
https://stackoverflow.com/questions/61427583/how-do-i-plot-a-keras-tensorflow-subclassing-api-model
最后
以上就是爱听歌火最近收集整理的关于Keras/Tensorflow subclassing API 实现的model,如何plot_model的全部内容,更多相关Keras/Tensorflow内容请搜索靠谱客的其他文章。
本图文内容来源于网友提供,作为学习参考使用,或来自网络收集整理,版权属于原作者所有。


发表评论 取消回复