echarts轮播
- 挂载
- 初始化
- 修改配置
- 开启定时器 定时轮播
- 清除定时器
- 触发resize (保证在页面放大缩小再次渲染)
初始化
<div class="main"></div>
//初始化
  init() {
         window.addEventListener(
                "resize",
                function () {
                    this.myChart.resize();
              }.bind(this)
        );
  },
配置项
chart() {
            // let _this = this;
            this.myChart = echarts.init(document.querySelector(".main"));//初始化挂载
            this.myChart.setOption({
                tooltip: {
                    trigger: 'item'
                },
                legend: {
                    top: 'center',
                    right: '5%',
                    orient: 'vertical',
                    itemWidth: 15,
                    itemHeight: 10,
                    textStyle: {
                        color: '#6DDEFF'//字体颜色
                    }
                },
                color: ['#0596F6', '#FB7494'],
                series: [
                    {
                        name: '总人口',
                        type: 'pie',
                        radius: ['40%', '50%'],
                        center: ['35%', 'center'],
                        avoidLabelOverlap: false,
                        label: {
                            show: false,
                            // position: 'center'
                        },
                        labelLine: {
                            show: false
                        },
                        data: [
                            { value: 1048, name: '男' },
                            { value: 735, name: '女' },
                        ]
                    }
                ]
            })
            //循环高亮
            let index = 0;
            clearInterval(this.timer);

            this.timer = setInterval(() => {
            	//跟图表循环配合使用
                this.myChart.dispatchAction({
                    type: "downplay",
                    seriesIndex: 0, // serieIndex的索引值   可以触发多个
                });
                //提示语循环
                this.myChart.dispatchAction({
                    type: "showTip",
                    seriesIndex: 0,
                    dataIndex: index
                });
                //图表循环
                this.myChart.dispatchAction({
                    type: "highlight",
                    seriesIndex: 0,
                    dataIndex: index
                });
                index++;
                if (index > 1) {
                    index = 0;
                }
            }, 3000);
        }
销毁循环定时器
beforeDestroy() {
        clearInterval(this.timer);
        this.timer = null;
    },
执行
    mounted() {
        this.chart();
        this.init();
    },
最后这里注意一个问题就是数据请求是异步的这就会导致在初次渲染是没有数据的
这时候我们就需要监听事件,再借助nextTick
在有数据的时候借用nextTick立刻执行重新渲染
  watch: {
        'data': {
            handler(newv, oldv) {
                // console.log(newv, '2222');
                this.$nextTick(() => { //这里需要重新加载渲染
                    this.dataList = [
                        { value: newv.rksx, name: '18岁以下' },
                        { value: newv.rksr, name: '19-65岁' },
                        { value: newv.rksz, name: '66-80岁' },
                        { value: newv.rkso, name: '80岁以上' },
                    ]
                    this.chart()//重新渲染
                })
            }

        }
    }
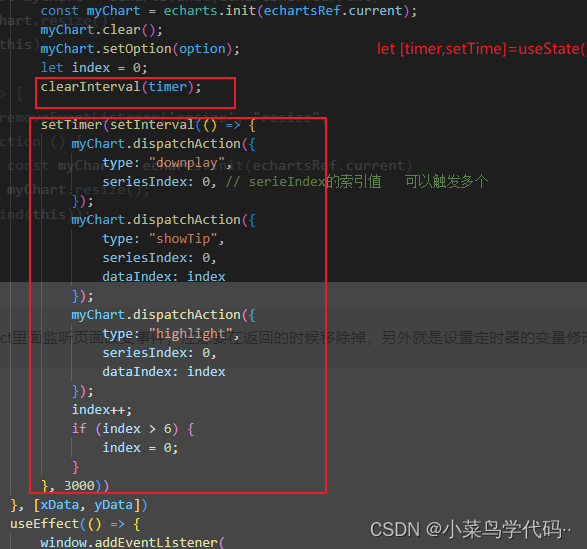
react页面发生改变重新渲染echart写法
 useEffect(() => {
        window.addEventListener(
            "resize",
            function () {
                const myChart = echarts.init(echartsRef.current)
                myChart.resize();
            }.bind(this)
        );
        return () => {
            window.removeEventListener('resize', "resize",
                function () {
                    const myChart = echarts.init(echartsRef.current)
                    myChart.resize();
                }.bind(this));
        }
    }, [])
重点代码,在useEffect里面监听页面改变事件,注意要在返回的时候移除掉,另外就是设置定时器的变量修改
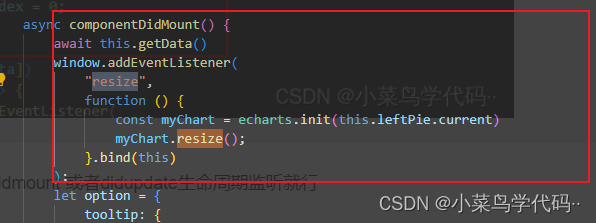
react类函数直接在didmount 或者didupdate生命周期监听就行
最后
以上就是冷酷咖啡豆最近收集整理的关于echarts轮播的全部内容,更多相关echarts轮播内容请搜索靠谱客的其他文章。
本图文内容来源于网友提供,作为学习参考使用,或来自网络收集整理,版权属于原作者所有。


发表评论 取消回复