LSB信息隐藏的卡方分析
一、 实验目的
了解什么是隐写分析(steganalysis),隐写分析与信息隐藏和数字水印的关 系。掌握基于图像的 LSB 隐写的分析方法,设计并实现一种基于图像的 LSB 卡方隐写分析方法。
二、 实验环境
(1)Windows10 或 11 系统
(2)Python 3.7 或以上
(3)图像文件 man.bmp
三、 实验要求
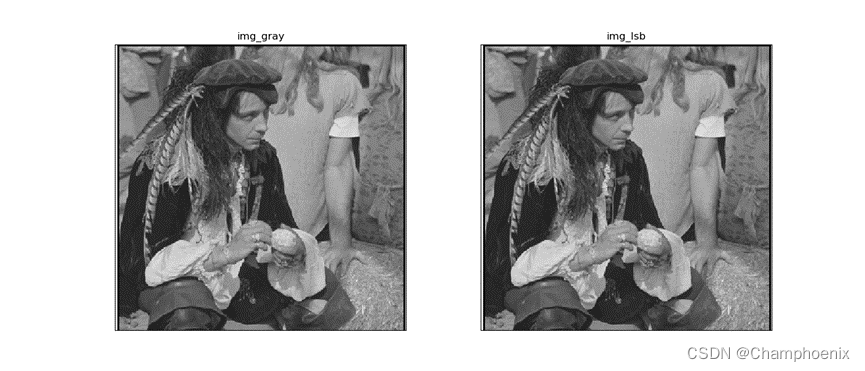
(1)在灰度图 man.bmp 利用 LSB 方法随机嵌入 0 和 1 的比特,嵌入率为 100% , 后 生 成 mangraystego.bmp , 在 一 行 两 列 中 输 出 mangray.bmp 和 mangraystego.bmp,截图插入到实验报告中;
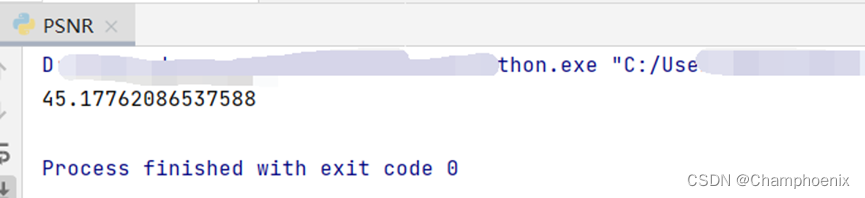
(2)并计算隐写后的图像的峰值信噪比,从主观(视觉效果)和客观(峰值信噪比)上来查看隐写后图像的透明性。将峰值信噪比的结果截图插入到实验报告中。
(3)比较嵌入秘密信息前后的直方图变化,将直方图显示在屏幕上,截图插入到实验报告中。直方图输出的时候要求输出灰度值为 40-60 的灰度值,不需要输出全部的 0-255 的灰度值的数量。
(4)利用卡方分析方法判断隐写后的图像是否隐藏秘密信息,计算 p,将结果截图插入到实验报告中。
四、 实验步骤和结果
1.灰度图LSB嵌入
作业(1):在灰度图 man.bmp 利用 LSB 方法随机嵌入 0 和 1 的比特,嵌入率为100%,后生成 mangraystego.bmp , 在一行两列中输出 mangray.bmp 和 mangraystego.bmp,截图插入到实验报告中;
实验步骤:
(1)读取图像man.bmp,把彩色图像转为灰度图;
(2)根据嵌入率生成0/1比特信息,嵌入率为100%,并将信息写入
(3)在一行两列中输出 mangray.bmp 和 mangraystego.bmp
代码:
from PIL import Image
from function import stgPrb
import numpy as np
import matplotlib.pyplot as plt

#图像的基本信息
img = Image.open("man.bmp")
width = img.size[0]
height = img.size[1]
#rgb 彩色图像转灰度图
def rgb2gray(img):
    img = img.convert("L")
    return img

#根据嵌入率生成 0/1 比特随机信息
def randomMsg(percent):
    if percent>0 and percent<=1:
        row = round(width * percent)
        col = round(height * percent)
        return np.random.randint(0,2,(col,row))
    else:
        raise Exception("传入的值必须属于(0,1]")

#将信息写入
def lsbWritein(img,msg):
    for y in range(len(msg)):
        for x in range(len(msg[0])):
            color = img.getpixel((x,y))
            temp = bin(color).replace('0b','')
            #不满足 8bit 长度的在高位补 0
            for j in range(8-len(temp)):
                temp = '0' + temp
            temp = temp[0:7]+str(msg[y][x])
            img.putpixel((x,y),int(temp,2))
    return img

#主函数
def main():
    img_gray = rgb2gray(img)
    #根据隐写率大小生成秘密信息,隐写率为 1
    rt = 1
    msg = randomMsg(rt)
    #lsb 隐写
    img_lsb = lsbWritein(img_gray,msg)
    img_lsb.save("mangraystego.bmp")

    plt.figure(figsize=(14, 6))
    plt.subplot(121)
    plt.imshow(img_gray, 'gray')
    plt.title('img_gray')
    plt.xticks([]), plt.yticks([])

    plt.subplot(122)
    plt.imshow(img_lsb, 'gray')
    plt.title('img_lsb')
    plt.xticks([]), plt.yticks([])

    plt.show()

main()
结果:
原灰度图像与隐写图像对比如图:
2.计算峰值信噪比
作业(2):并计算隐写后的图像的峰值信噪比,从主观(视觉效果)和客观(峰值信噪比)上来查看隐写后图像的透明性。将峰值信噪比的结果截图插入到实验报告中。
实验步骤:
(1)读入图像
(2)通过公式计算峰值信噪比
代码:
import math
import numpy as np
import cv2

def psnr(img1, img2):
    img1 = np.float64(img1)
    img2 = np.float64(img2)
    mse = np.mean((img1 / 1.0 - img2 / 1.0) ** 2)
    if mse < 1.0e-10:
        return 100
    PIXEL_MAX = 255.0
    return 20 * math.log10(PIXEL_MAX / math.sqrt(mse))

img_gray = cv2.imread('man.bmp')
img_lsb = cv2.imread('mangraystego.bmp')
res = psnr(img_gray, img_lsb)
print(res)
结果:
计算结果如下图,每次随机嵌入后的结果不同:
隐写图像透明度分析:
从主观(视觉效果)上 , 以嵌入率 100% 进行 LSB 隐写后的图像 mangraystego.bmp 与原图像 man.bmp 十分相似,肉眼无法观察出来两者的区别, 即在视觉效果上隐写后的图像透明性较好;
从客观(峰值信噪比)上,每次嵌入不同的随机信息后,两张图片的 PSNR 值不同,但数值大多为 50 上下。由于峰值信噪比越大,图像的透明性越好,故 本实验中 LSB 隐写后的图像透明度较好,但仍有改进空间。
3.比较隐写前后的直方图变化
(3)比较嵌入秘密信息前后的直方图变化,将直方图显示在屏幕上,截图插入到实验报告中。直方图输出的时候要求输出灰度值为 40-60 的灰度值,不需要输出全部的 0-255 的灰度值的数量。
实验步骤:
(1)读取图像,将彩色图像转变为灰度图
(2)生成随机信息,以嵌入率100%进行LSB隐写
(3)绘制表格,灰度值范围为40-60
代码:
#PIL 图像处理库
from PIL import Image
#表格绘制库
import matplotlib.pyplot as plt
#数学库
import numpy as np

#图像的基本信息
img = Image.open("man.bmp")
width = img.size[0]
height = img.size[1]

#rgb 彩色图像转灰度图
def rgb2gray(img_):
    img_ = img_.convert("L")
    return img_

#生成随机信息
def randomMsg(percent):
    if percent>0 and percent<=1:
        row = round(width * percent)
        col = round(height * percent)
        return np.random.randint(0,2,(col,row))
    else:
        raise Exception("传入的值必须属于(0,1]")

#将信息写入
def lsbWritein(img,msg):
    for y in range(len(msg)):
        for x in range(len(msg[0])):
            color = img.getpixel((x,y))
            temp = bin(color).replace('0b','')
            #不满足 8bit 长度的在高位补 0
            for j in range(8-len(temp)):
                temp = '0' + temp
            temp = temp[0:7]+str(msg[y][x])
            img.putpixel((x,y),int(temp,2))
    return img

#主函数
def main():
    plt.figure("pixel")
    #以嵌入率 100%进行 lsb 隐写
    rt = 1
    img_gray = rgb2gray(img)
    martix_gray = np.array(img_gray)
    msg = np.array(randomMsg(rt))
    img_lsb = lsbWritein(img_gray,msg)
    martix_lsb = np.array(img_lsb)

    #表格绘制,范围为 40-60
    x = range(40,61, 1)
    plt.subplots_adjust(hspace=0.3) # 调整子图间距
    plt.subplot(211)
    plt.title("img_gray")
    plt.hist(martix_gray.flatten(),bins=np.arange(40,61,1),rwidth=0.1,align='left')
    plt.xticks(x)

    plt.subplot(212)
    plt.title("img_lsb")
    plt.hist(martix_lsb.flatten(),bins=np.arange(40,61,1),rwidth=0.1,align='left')
    plt.xticks(x)

    plt.show()

main()
结果:
原灰度图像与 lsb 隐写图像的直方图比较如下图(40-60 范围内):
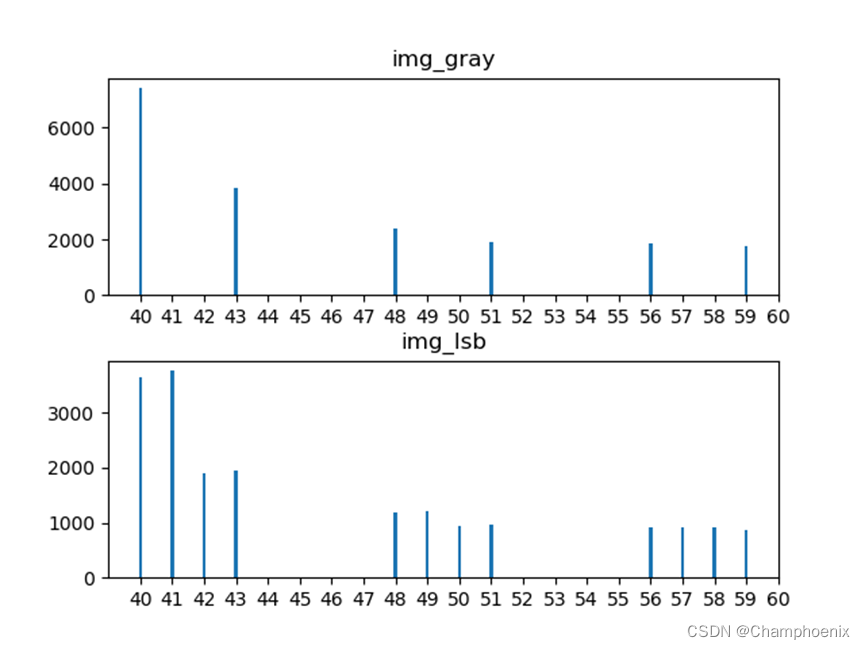
由对比可知,相同灰度值下,LSB 隐写前的数值较大,而 LSB 隐写后约降为原来的 1/2。同时,LSB 隐写前的 T[2i]与 T[2i+1]数值相差很大,而 LSB 隐写后两者十分相近。因此通过直方图对比,我们可以得知图像发生了信息隐藏。
4.利用卡方分析方法判断隐写,并计算p值
作业(4):利用卡方分析方法判断隐写后的图像是否隐藏秘密信息,计算 p,将结果截图插入到实验报告中。
实验步骤:
(1)读取图像,彩色图转为灰度图
(2)根据隐写率大小生成秘密信息,隐写率为1
(3)对图片进行卡方分析,计算p值
卡方分析函数源代码 function.py 如下,返回值为 p:
#function.py
#统计学库
from scipy.stats import chi2
#数学库
import numpy as np
#卡方分析
def stgPrb(martix):
    count = np.zeros(256,dtype=int)
    for i in range(len(martix)):
        for j in range(len(martix[0])):
            count[martix[i][j]] += 1
    h2i = count[2:255:2]
    h2is = (h2i+count[3:256:2])/2
    filter= (h2is!=0)
    k = sum(filter)
    idx = np.zeros(k,dtype=int)
    for i in range(127):
        if filter[i]==True:
            idx[sum(filter[1:i])]=i
    r=sum(((h2i[idx]-h2is[idx])**2)/(h2is[idx]))
    p = 1-chi2.cdf(r,k-1)
    return p
利用步骤 1 灰度图 LSB 嵌入的结果,直接将嵌入率确定为 1,利用卡方分析计算 p 值,源代码如下(改自 LSB 卡方分析.py):
代码:
from PIL import Image
from function import stgPrb
import numpy as np
import matplotlib.pyplot as plt

#图像的基本信息
img = Image.open("man.bmp")
width = img.size[0]
height = img.size[1]
#rgb 彩色图像转灰度图
def rgb2gray(img):
    img = img.convert("L")
    return img

#生成 0/1 比特随机信息
def randomMsg(percent):
    if percent>0 and percent<=1:
        row = round(width * percent)
        col = round(height * percent)
        return np.random.randint(0,2,(col,row))
    else:
        raise Exception("传入的值必须属于(0,1]")

#将信息写入
def lsbWritein(img,msg):
    for y in range(len(msg)):
        for x in range(len(msg[0])):
            color = img.getpixel((x,y))
            temp = bin(color).replace('0b','')
            #不满足 8bit 长度的在高位补 0
            for j in range(8-len(temp)):
                temp = '0' + temp
            temp = temp[0:7]+str(msg[y][x])
            img.putpixel((x,y),int(temp,2))
    return img

#主函数
def main():
    img_gray = rgb2gray(img)
    #根据隐写率大小生成秘密信息,隐写率为 1
    rt = 1
    msg = randomMsg(rt)

    #lsb 隐写
    img_lsb = lsbWritein(img_gray,msg)
    img_lsb.save("mangraystego.bmp")

    # 确定隐写率为 1,对图片进行卡方分析,计算 p 值
    martix = np.array(img_lsb)
    p = stgPrb(martix[0:width, 0:height])
    print(p)

main()
结果:
p 值计算结果如下图,每次随机嵌入后的结果不同:
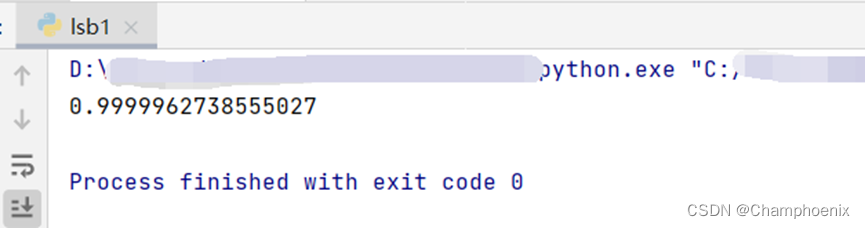
由于 p 值十分接近 1,可以通过卡方分析判定在图像 mangraystego.bmp 在嵌入率 100%的情况下进行了 LSB 隐写。
五、 实验心得体会
在本学期的最后一次实验中,我们学习了LSB信息隐藏的卡方分析。了解了在灰度图中利用 LSB 方法以不同的嵌入率随机嵌入0/1比特的操作,并能够计算隐写后的图像的峰值信噪比,比较嵌入秘密信息前后的直方图变化。最后学会了利用卡方分析方法判断隐写后的图像是否隐藏秘密信息,计算 p的方法。
在本节第一个小实验中,刚开始忘记修改嵌入率,后来复查实验报告的时候才发现,并及时修改。
最后
以上就是怕孤独冥王星最近收集整理的关于信息隐藏与数字水印实验4-LSB信息隐藏的卡方分析的全部内容,更多相关信息隐藏与数字水印实验4-LSB信息隐藏内容请搜索靠谱客的其他文章。


发表评论 取消回复