
作者:李誉辉
四川大学在读研究生
往期连载: R_ggplot2基础(一)5 stat_xxx()统计变换
相比几何对象,增加了:
| 统计变换函数 | 描述 | 其它 |
|---|---|---|
stat_bin | 直方图 | 分割数据,然后绘制直方图 |
stat_function | 函数曲线 | 增加函数曲线图 |
stat_qq | Q-Q图 | |
stat_smooth | 平滑曲线 | |
stat_ellipse | 椭圆 | 常用于椭圆形置信区间,带状置信区间用geom_ribbon |
stat_spoke | 绘制有方向的数据点 | |
stat_sum | 绘制不重复的取值之和 | |
stat_summary | 分组汇总 | 可以求每组的均值,中位数等 |
stat_unique | 绘制不同的数据,去掉重复值 | |
stat_ecdf | 经验累计密度图 | |
stat_xsline | 样条曲线拟合 | 见基础运算_3 |
查询其它的统计变换函数:
ggplot2 parts of the tidyverse
使用ls(pattern = '^stat_', env = as.environment('package:ggplot2'))
library(ggplot2)
ls(pattern = "^stat_", env = as.environment("package:ggplot2"))
重要例子:
5.1 stat_summary
要求数据源的y能够被分组,每组不止一个元素, 或增加一个分组映射,即aes(x= , y = , group = )
stat_summary (mapping = NULL, data = NULL, geom = "pointrange", position = "identity",
    ..., fun.data = NULL, fun.y = NULL, fun.ymax = NULL, fun.ymin = NULL,
    fun.args = list(), na.rm = FALSE, show.legend = NA, inherit.aes = TRUE)
参数解释:
* fun.data 表示指定完整的汇总函数,输入数字向量,输出数据框,常见4种:smean.cl.boot,smean.cl.normal,smean.sdl,smedian.hilow。 更多
* fun.y 表示指定对y的汇总函数,同样是输入数字向量,返回单个数字,这里的y通常会被分组,汇总后是每组返回1个数字
* fun.ymin 表示取y的最小值,输入数字向量,每组返回1个数字
* fun.ymax 表示取y的最大值,输入数字向量,每组返回1个数字
library(ggplot2)
library(Hmisc)

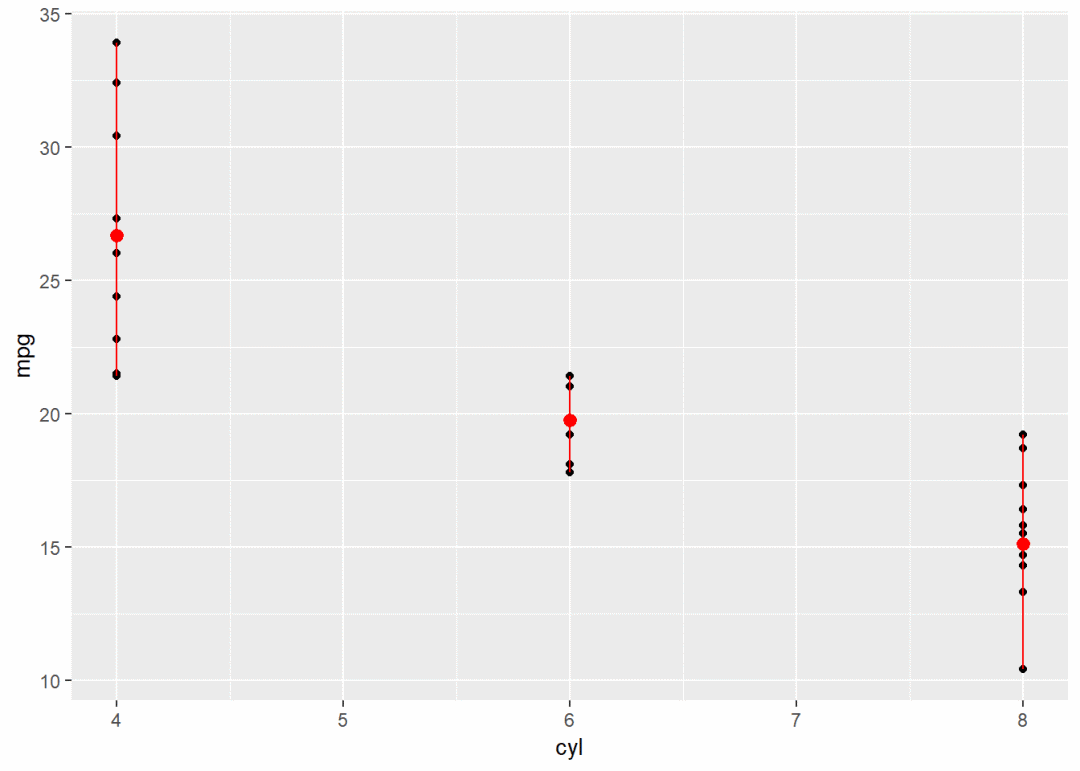
g <- ggplot(mtcars, aes(cyl, mpg)) + geom_point()
g + stat_summary(fun.data = "mean_cl_boot", color = "red", size = 2)  # 用mean_cl_bool对mpg进行运算,返回均值,最大值,最小值3个向量组成的矩阵

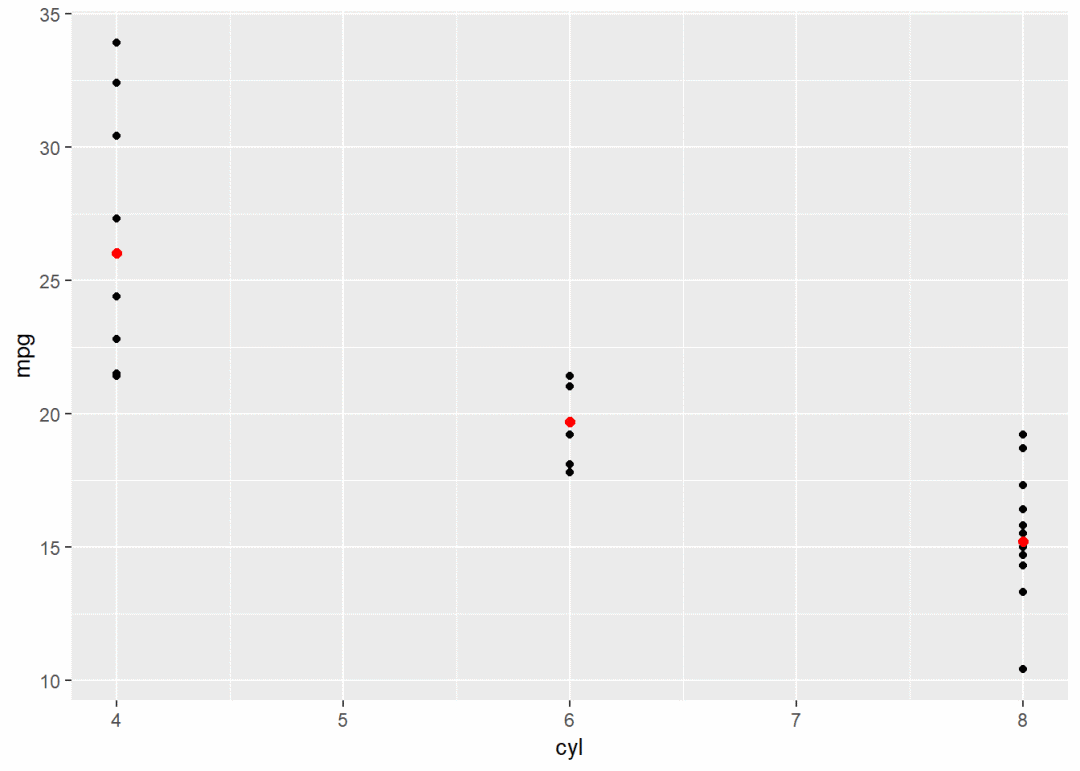
g + stat_summary(fun.y = "median", color = "red", size = 2, geom = "point")  # 计算各组中位数
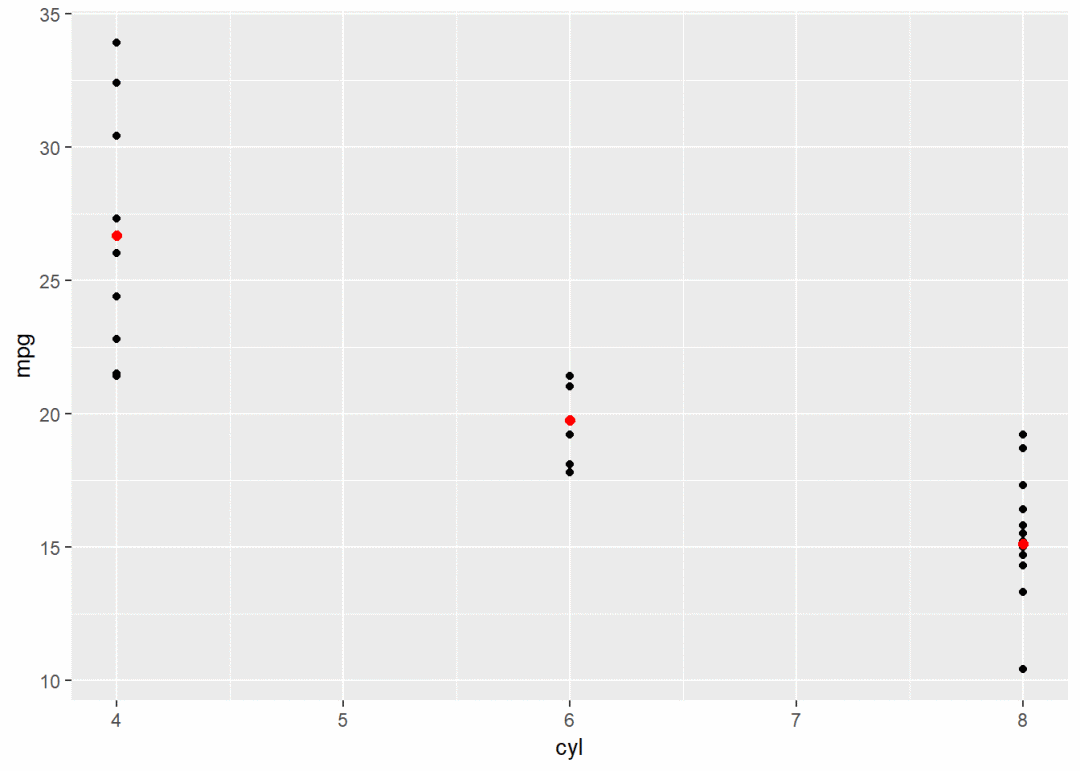
g + stat_summary(fun.y = "mean", color = "red", size = 2, geom = "point")  # 计算各组均值
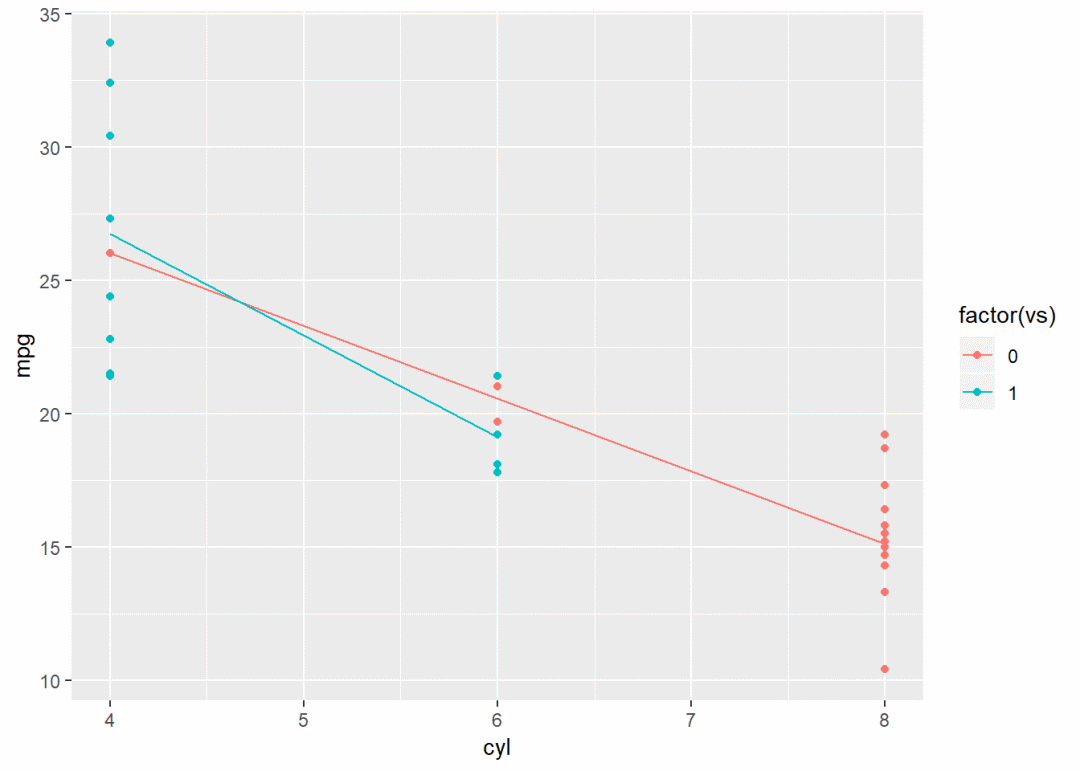
g + aes(color = factor(vs)) + stat_summary(fun.y = mean, geom = "line")  # 增加1组颜色变量映射,然后求均值并连线
g + stat_summary(fun.y = mean, fun.ymin = min, fun.ymax = max, color = "red")  # 计算各组均值,最值

# stat_summary_bin
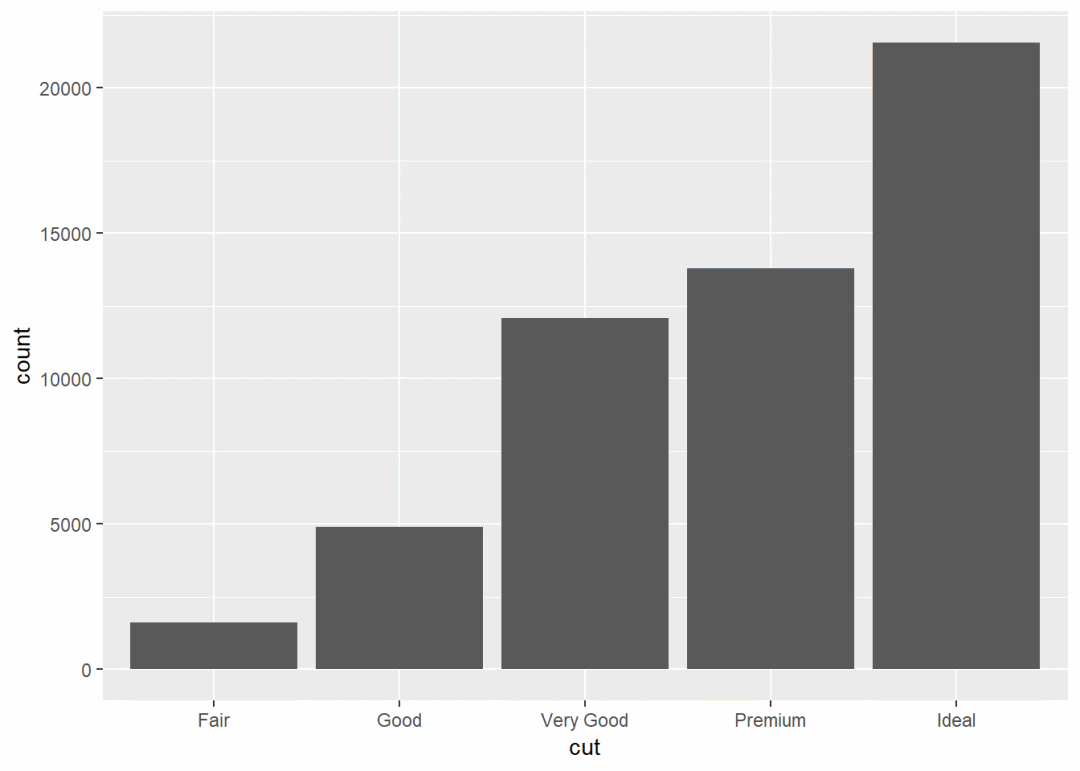
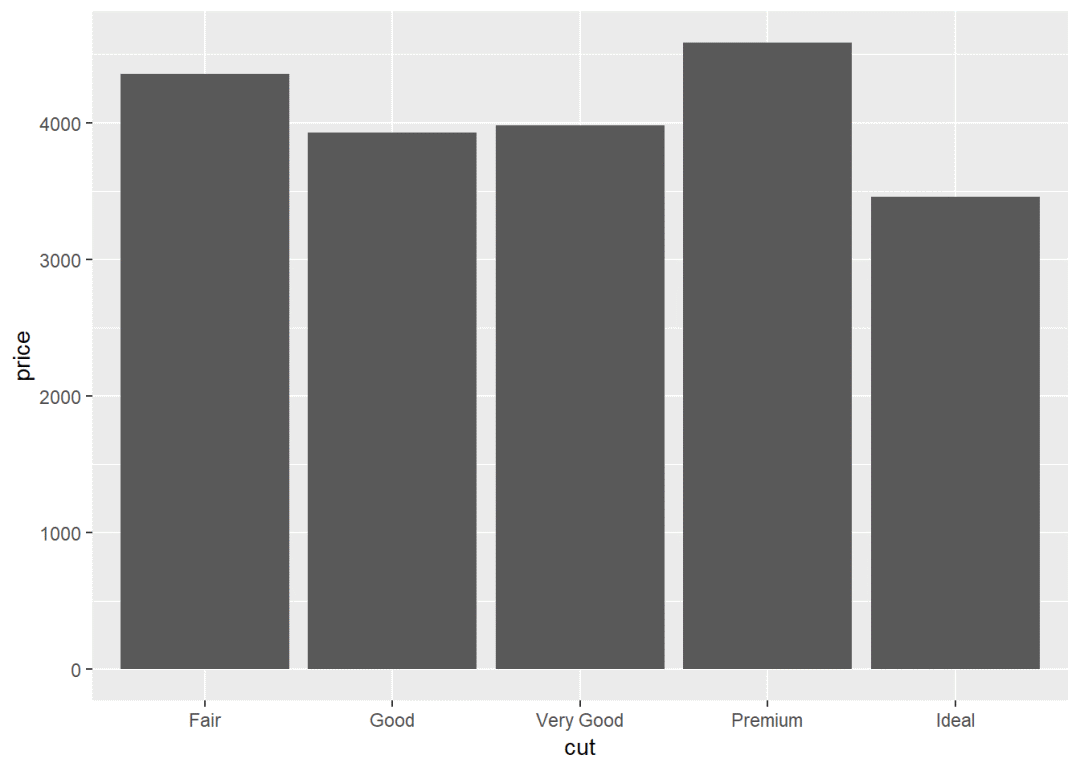
g1 <- ggplot(diamonds, aes(cut))
g1 + geom_bar()  # 条形图 ,只有1个映射的时候默认为计数
g1 + stat_summary_bin(aes(y = price), fun.y = "mean", geom = "bar")  # 分组计算均值

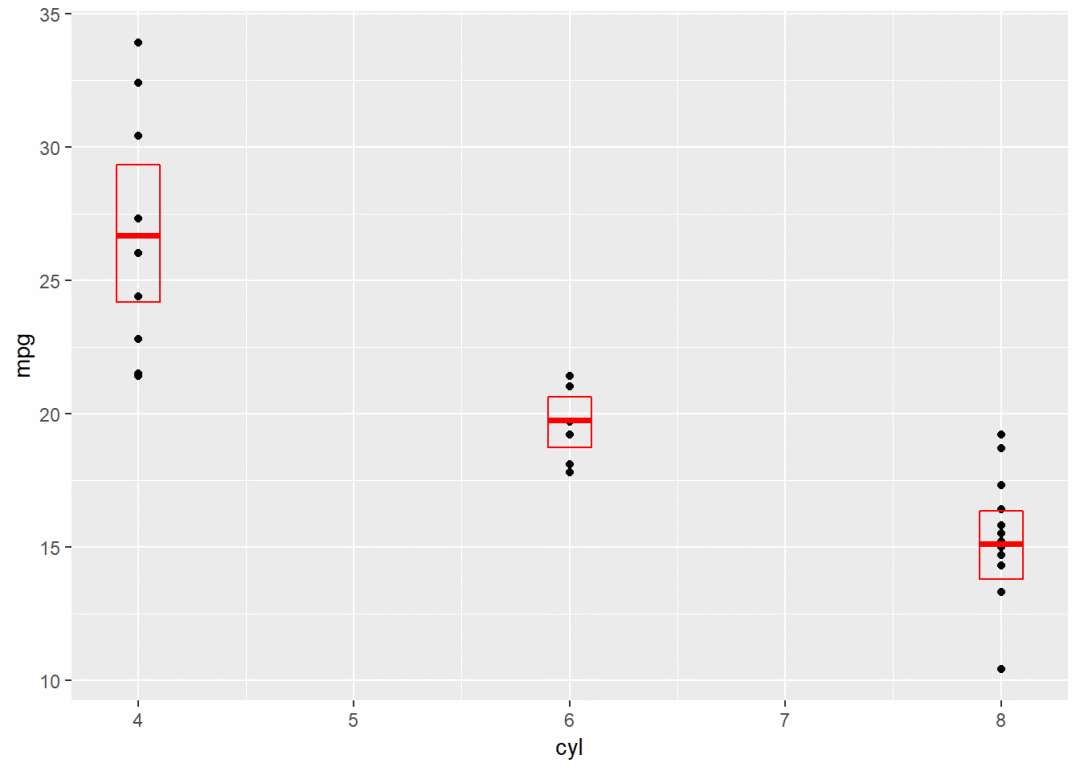
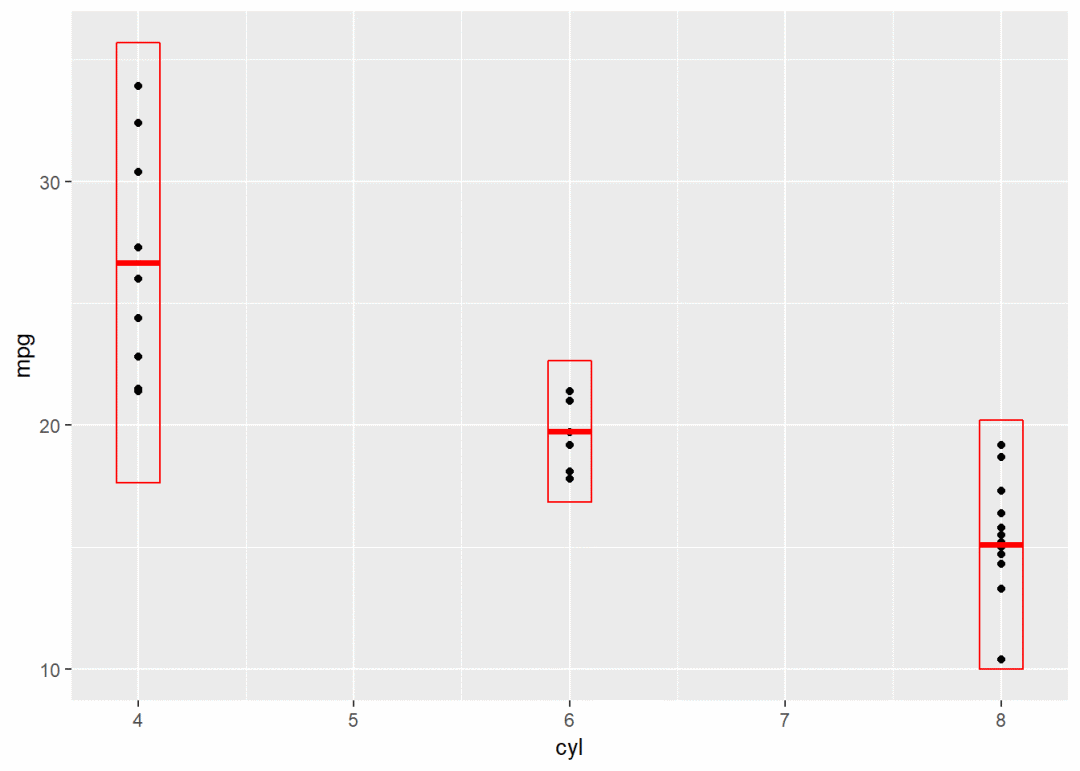
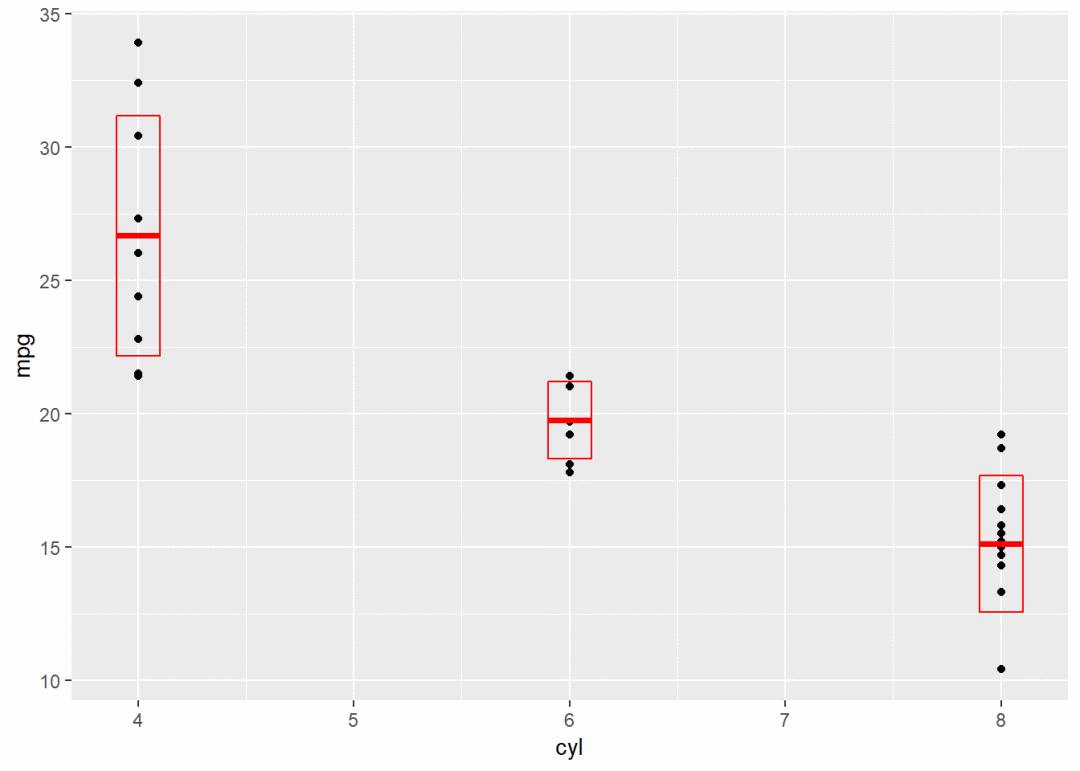
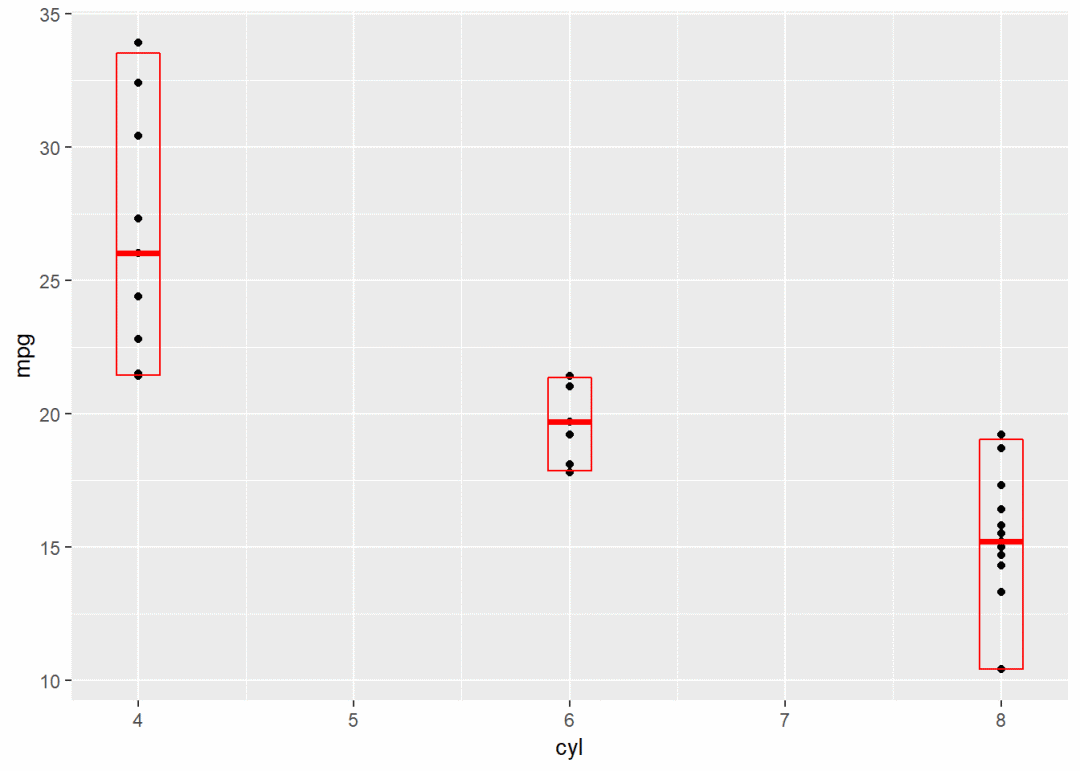
# stat_sum_df用矩形将最值与均值框起来
stat_sum_df <- function(fun, geom = "crossbar", ...) {
    stat_summary(fun.data = fun, color = "red", geom = geom, width = 0.2, ...)
}
g2 <- ggplot(mtcars, aes(cyl, mpg)) + geom_point()
g2 + stat_sum_df("mean_cl_boot", mapping = aes(group = cyl))  # 增加1个分组映射
g2 + stat_sum_df("mean_sdl", mapping = aes(group = cyl))
g2 + stat_sum_df("mean_sdl", fun.args = list(mult = 1), mapping = aes(group = cyl))
g2 + stat_sum_df("median_hilow", mapping = aes(group = cyl))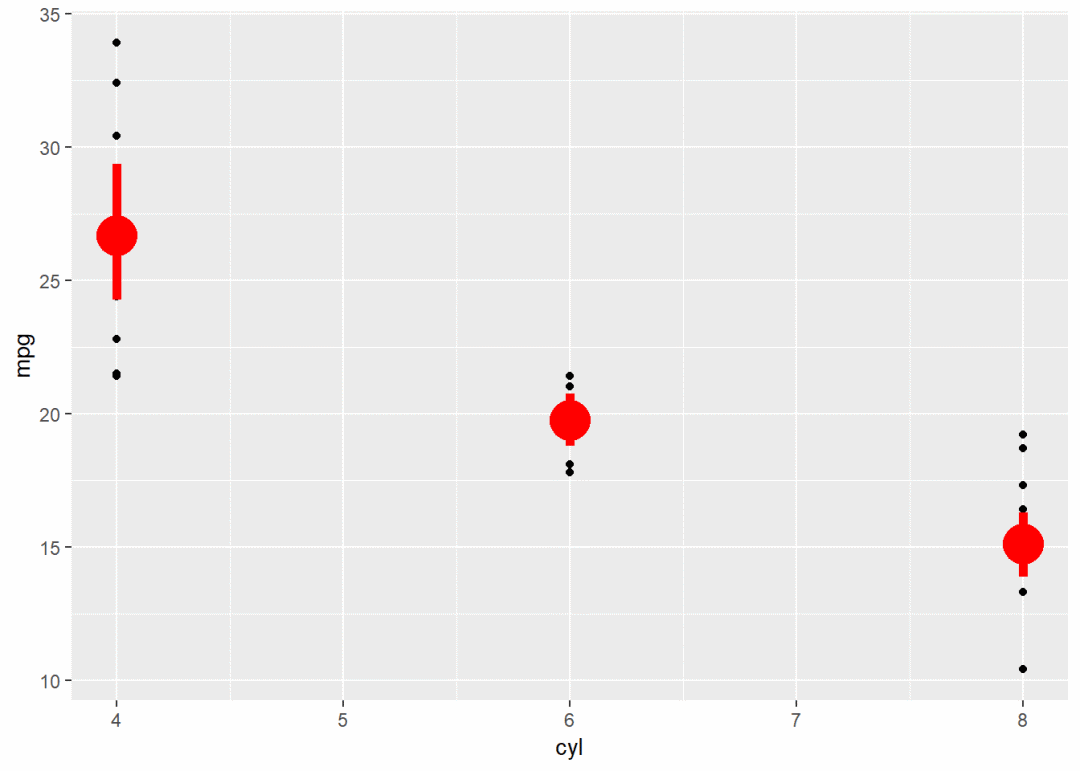
5.2 stat_function
需要2个映射变量aes(group = , y = )
stat_function(mapping = NULL, data = NULL, geom = "path", position = "identity",
    ..., fun, xlim = NULL, n = 101, args = list(), na.rm = FALSE,
    show.legend = NA, inherit.aes = TRUE)
参数解释:
* fun 表示要绘图的函数表达式
* xlim 表示要显示的x范围
* n 表示要差值的点数目
* args 表示其它要传递给fun的参数
library(ggplot2)
set.seed(1492)
df <- data.frame(
  x = rnorm(100)
)
x <- df$x
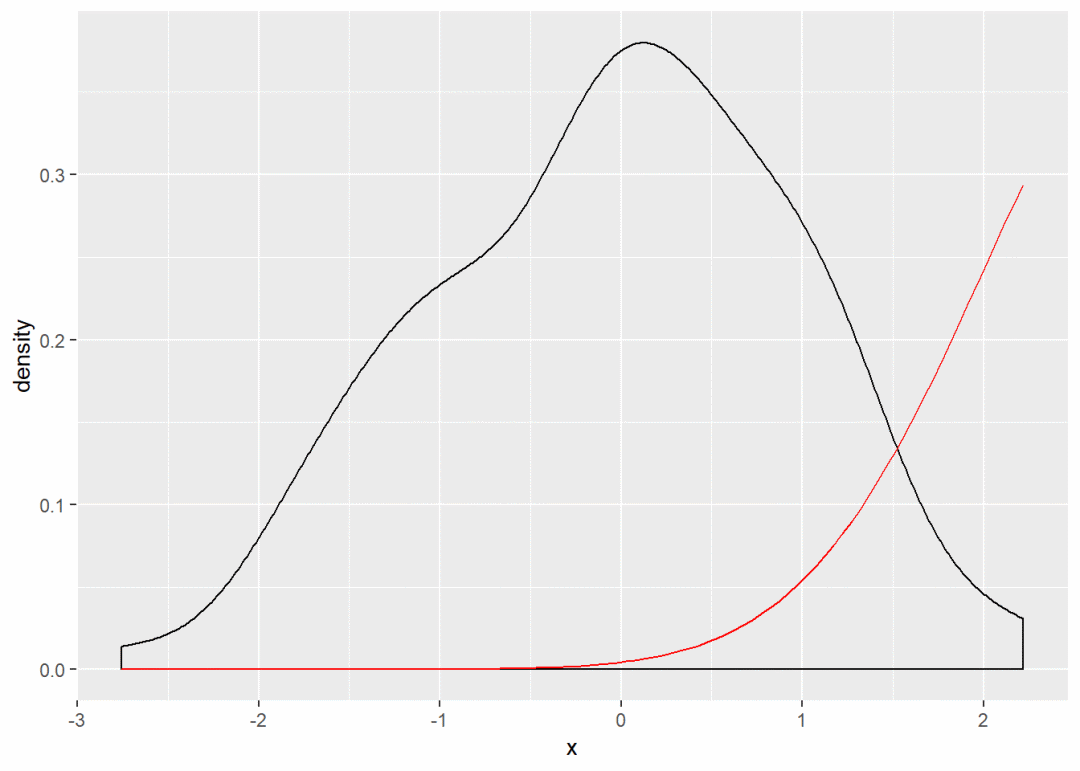
base <- ggplot(df, aes(x)) + geom_density() # 核密度图,展示变量分布规律,与频率分布直方图原理相同
base + stat_function(fun = dnorm, color = "red") # dnorm表示正态分布密度函数
base + stat_function(fun = dnorm, colour = "red", args = list(mean = 3)) # args传参给fun,生成均值为3的正态分布密度图

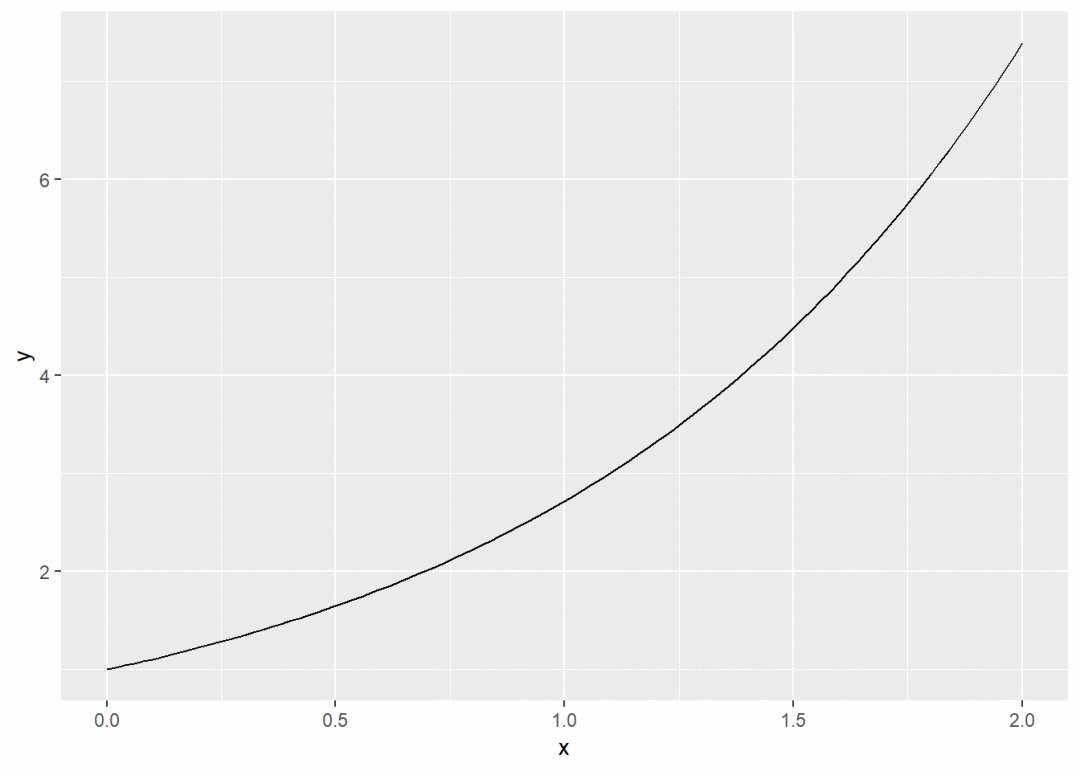
ggplot(data.frame(x = c(0, 2)), aes(x)) +
  stat_function(fun = exp, geom = "line") # 画e^x在(0, 2)区间的函数图形,数据点由插值产生
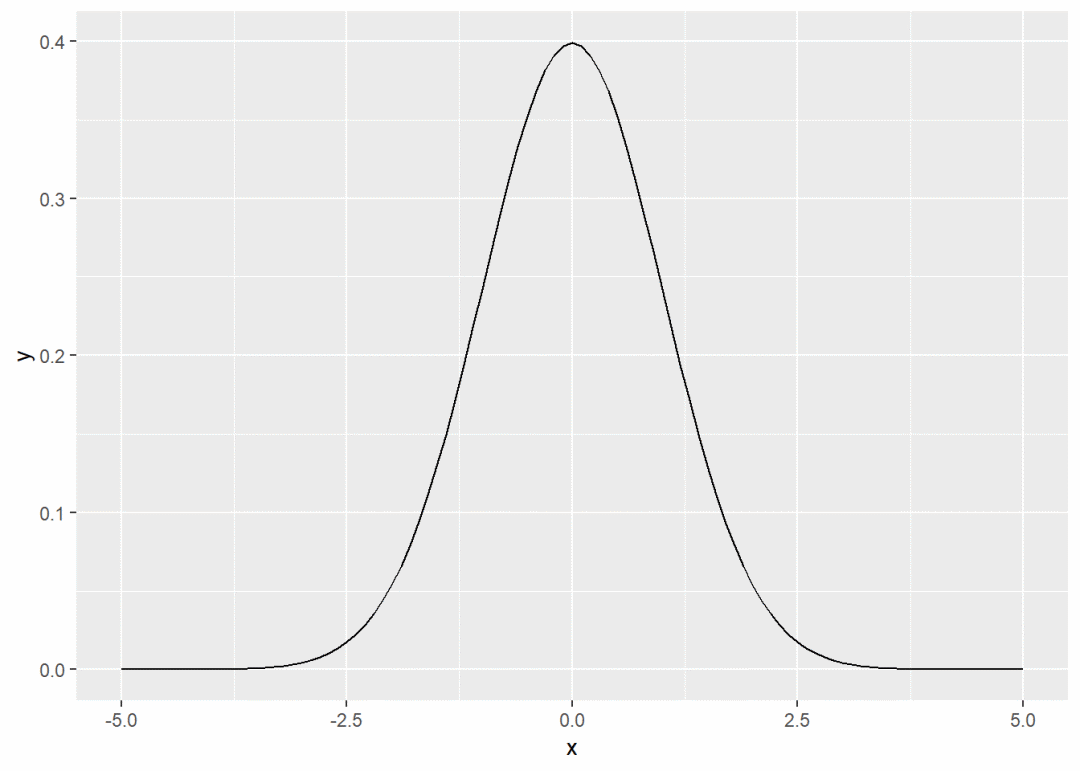
ggplot(data.frame(x = c(-5, 5)), aes(x)) +
  stat_function(fun = dnorm) # 画在区间(-5, 5)区间的正态分布密度图,数据点由插值产生
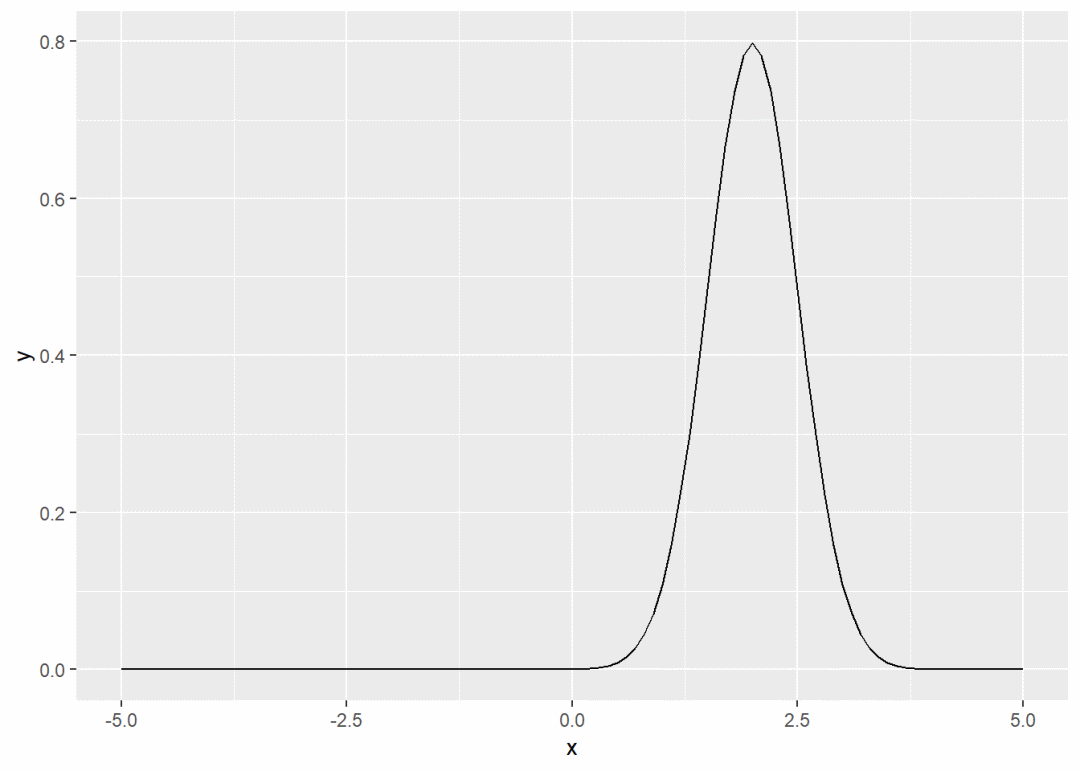
ggplot(data.frame(x = c(-5, 5)), aes(x)) +
  stat_function(fun = dnorm, args = list(mean = 2, sd = .5)) # 画均值为2,标准差为0.5的正态分布密度图

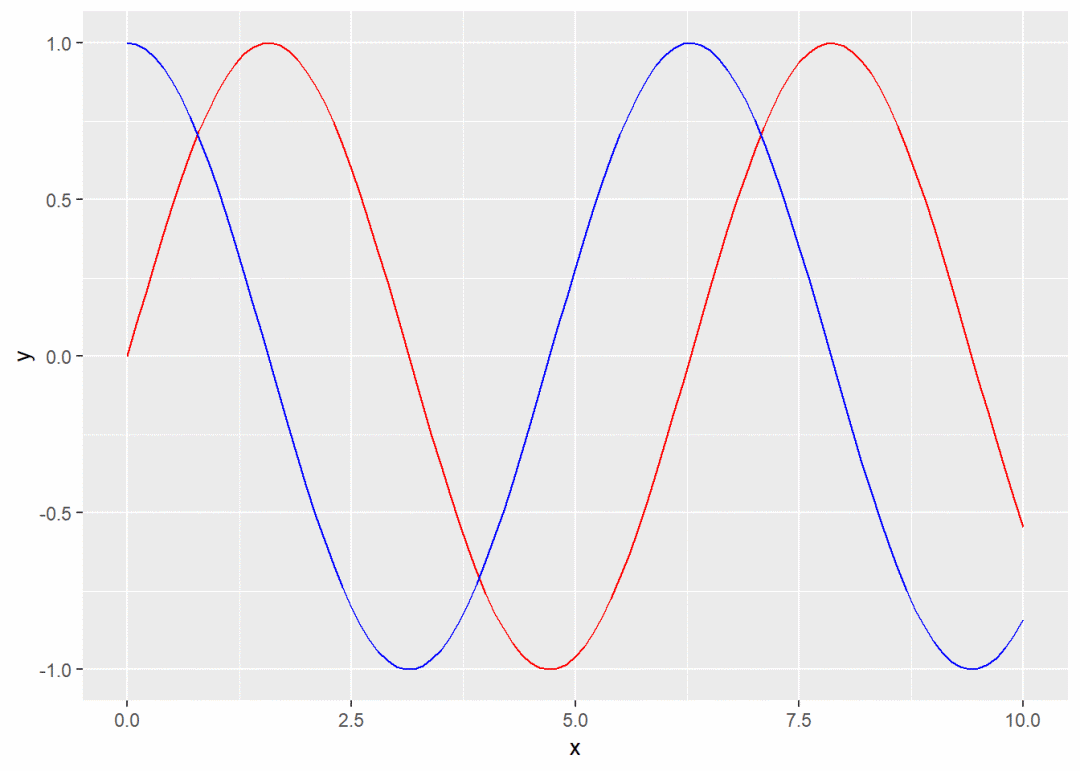
f <- ggplot(data.frame(x = c(0, 10)), aes(x))
f + stat_function(fun = sin, color = "red") + # 绘制(0, 10)区间的正弦函数图形
  stat_function(fun = cos, color = "blue") # 绘制(0, 10)区间的余弦函数图形

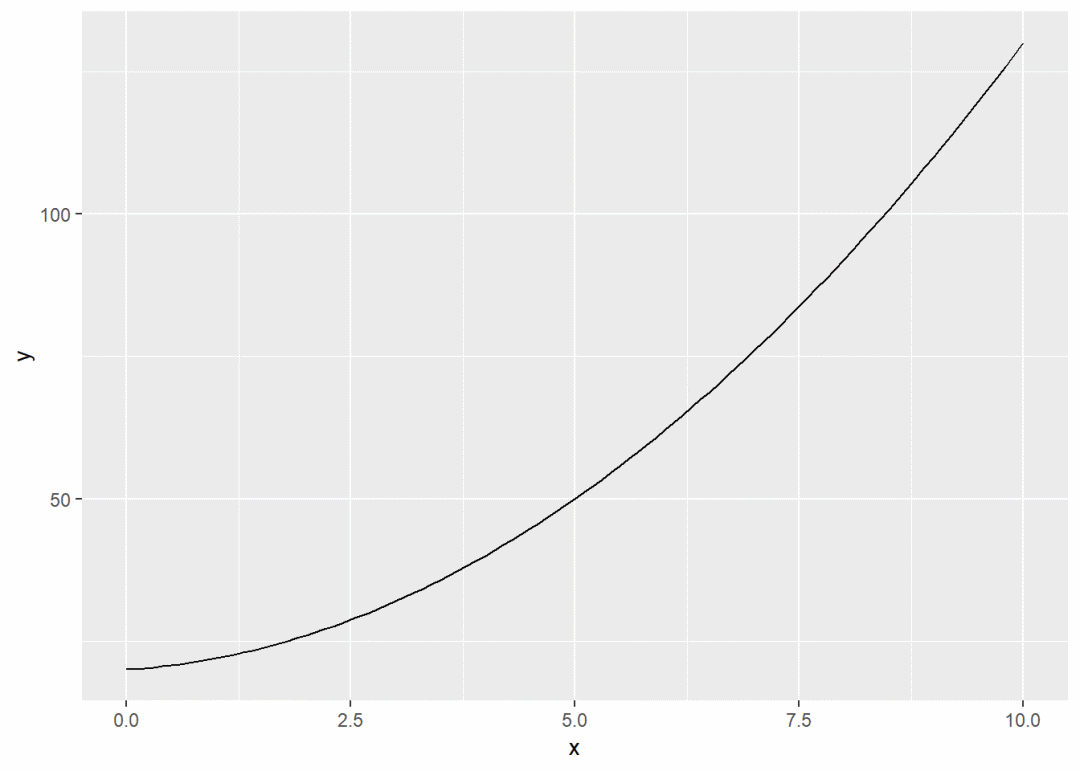
myfunction <- function(x) {x^2 + x + 20}
f + stat_function(fun = myfunction) # 画自定义函数图像

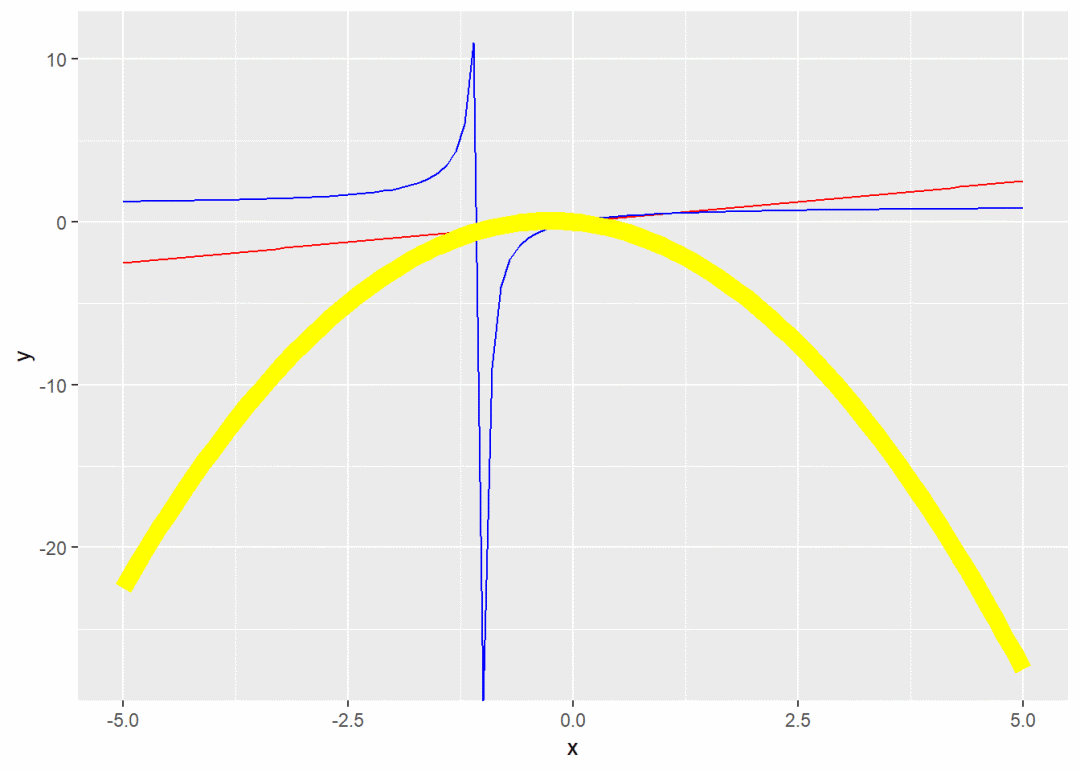
fun1 <- function(x) {0.5 * x}
fun2 <- function(x) {x / (x +1)}
fun3 <- function(x) {0.5 * x - x*(x + 1)}
ggplot(data.frame(x = -5:5), aes(x)) + stat_function(fun = fun1, color = "red") +
  stat_function(fun = fun2, color = "blue") +
  stat_function(fun = fun3, color = "yellow", size = 4)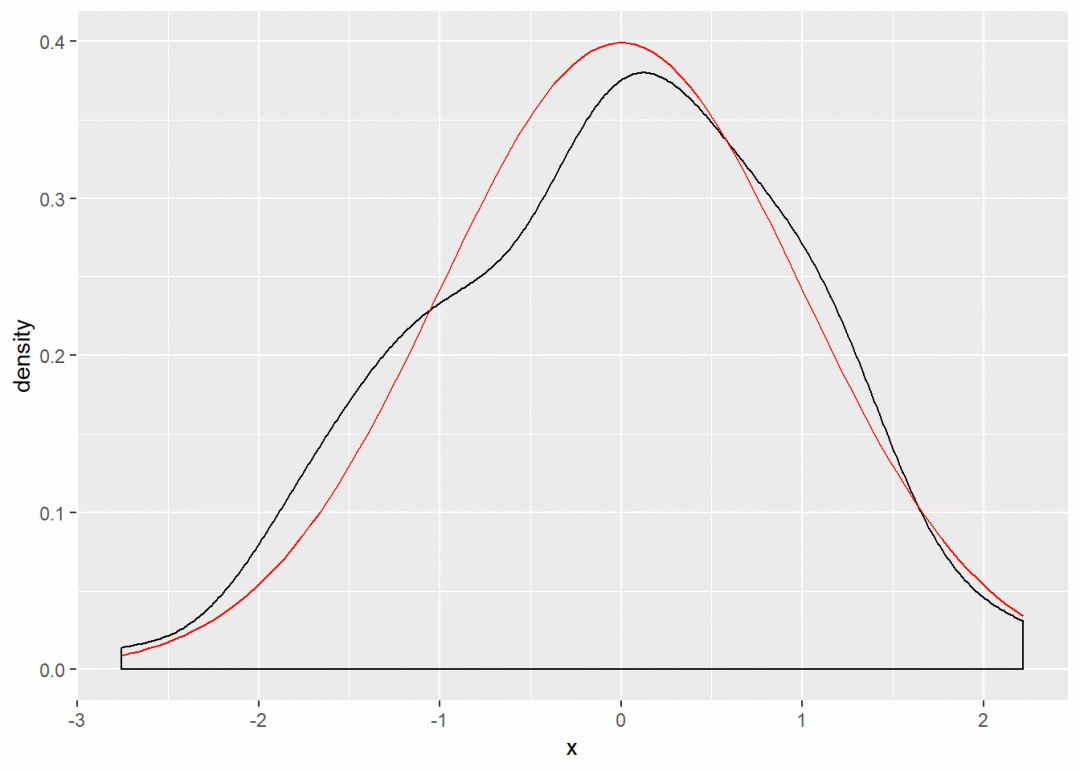
5.3 stat_smooth
stat_smooth (mapping = NULL, data = NULL, geom = "smooth", position = "identity",
    ..., method = "auto", formula = y ~ x, se = TRUE, n = 80,
    span = 0.75, fullrange = FALSE, level = 0.95, method.args = list(),
    na.rm = FALSE, show.legend = NA, inherit.aes = TRUE)
参数解释:
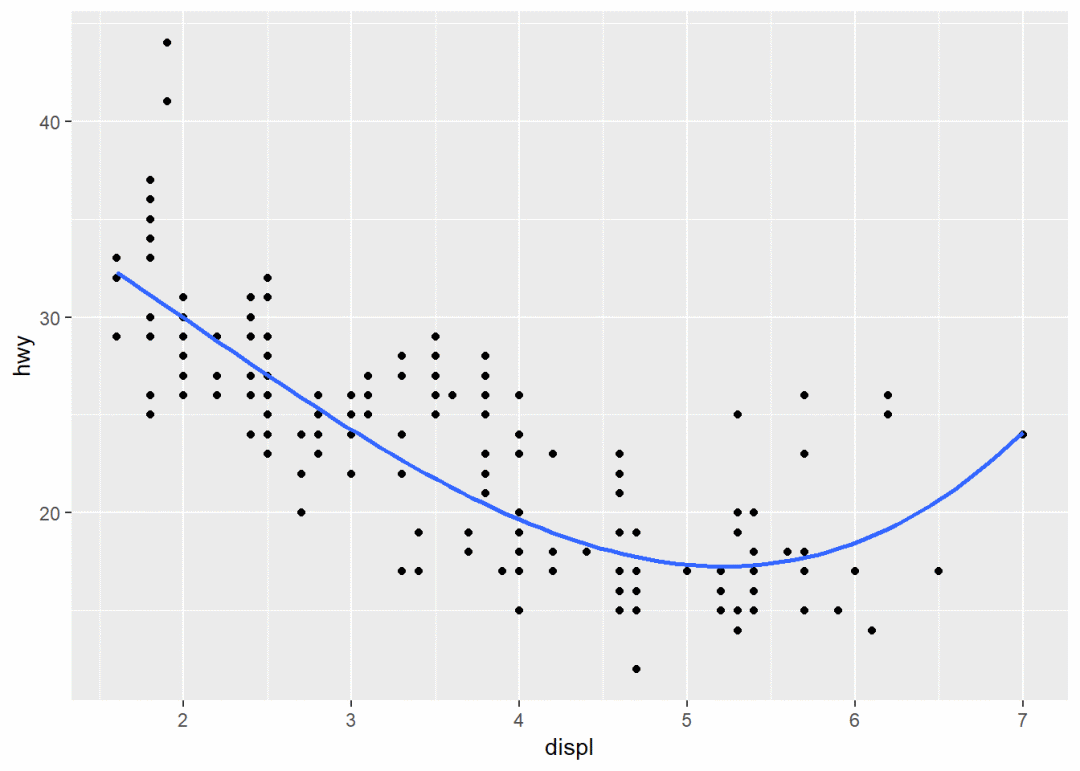
* method 表示指定平滑曲线的统计函数,如lm线性回归, glm广义线性回归, loess多项式回归, gam广义相加模型(mgcv包), rlm稳健回归(MASS包)
* formula 表示指定平滑曲线的方程,如 y~x, y~poly(x, 2), y~log(2) ,需要与method参数搭配使用
* se 表示是否显示平滑曲线的置信区间,默认TRUE显示
* n 表示产生平滑点的基点数
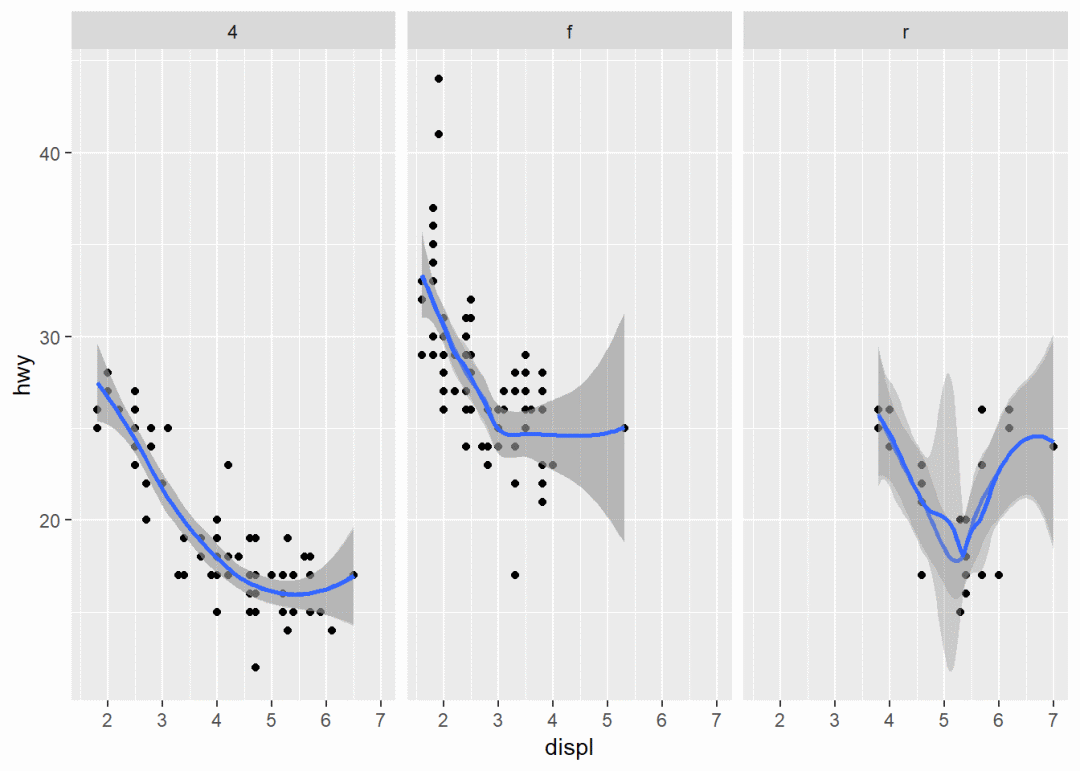
* span 表示多项式回归中的段数,段数越多约平滑
* level 表示置信区间水平
library(ggplot2)

ggplot(mpg, aes(displ, hwy)) + geom_point() + geom_smooth() + stat_smooth(method = lm,
    se = FALSE)  # 不显示置信区间

ggplot(mpg, aes(displ, hwy)) + geom_point() + geom_smooth(method = lm, formula = y ~
    splines::bs(x, 3), se = FALSE)

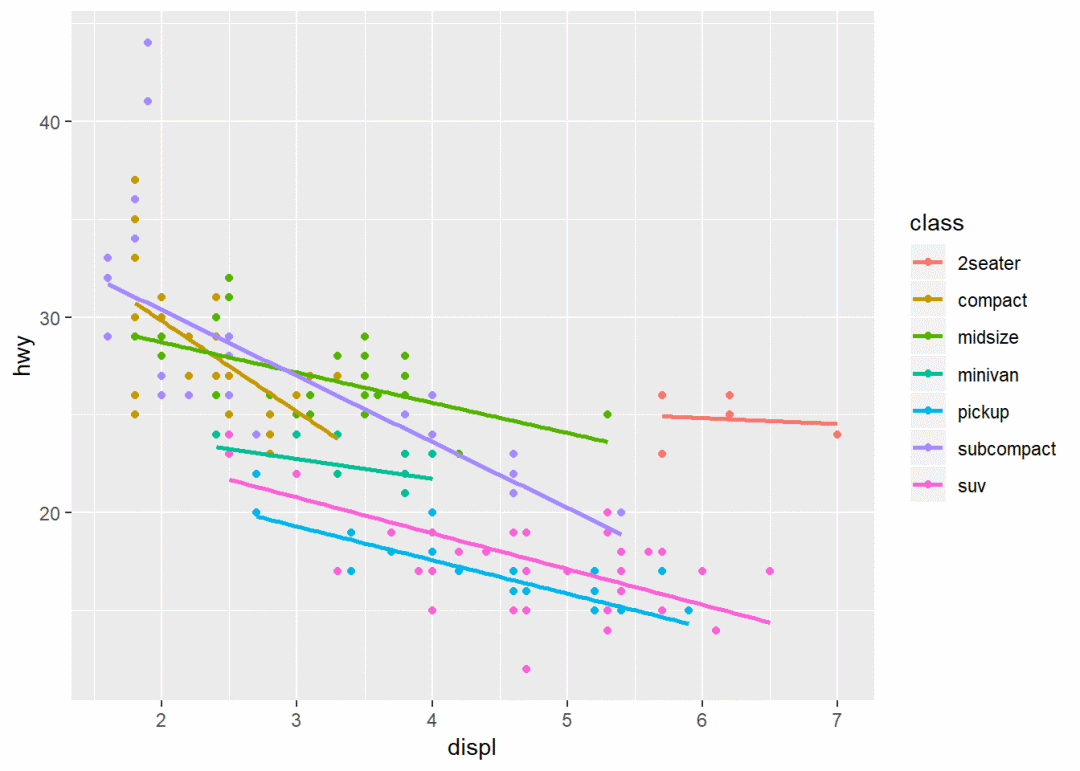
ggplot(mpg, aes(displ, hwy, color = class)) + geom_point() + geom_smooth(se = FALSE,
    method = lm)

ggplot(mpg, aes(displ, hwy)) + geom_point() + geom_smooth(span = 0.8) + geom_smooth(method = loess,
    formula = y ~ x) + facet_wrap(~drv)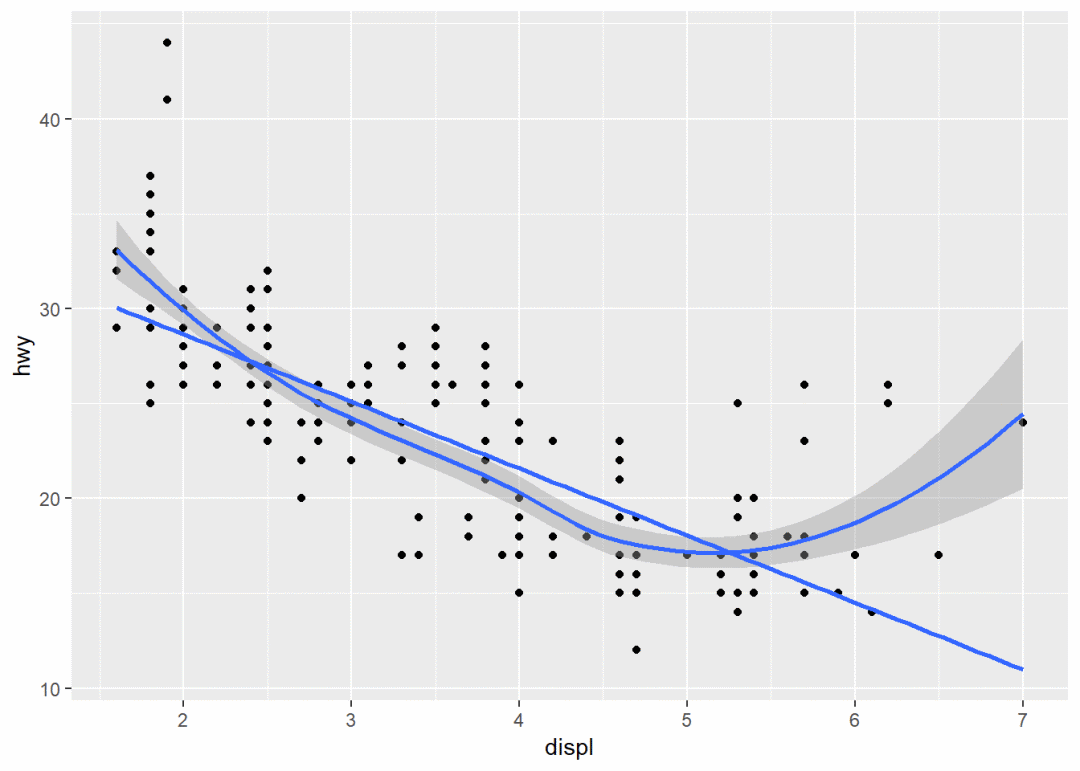
6 coor_xxx()坐标系变换
ggplot2默认为cartesian笛卡尔坐标系,其它坐标系都是通过笛卡尔坐标系画图,然后变换过来的,坐标函数如下:
| 坐标变换函数 | 描述 |
|---|---|
coord_cartesian() | 笛卡尔坐标系 |
coord_fixed() | 固定纵横比笛卡尔坐标系 |
coord_flip() | 翻转坐标系 |
coord_polar() | 极坐标投影坐标系 |
coord_map(), coord_quickmap() | 地图投影(球面投影) |
coord_trans() | 变比例笛卡尔坐标系 |
6.1 coord_cartesian()笛卡尔坐标系
注: 默认为笛卡尔坐标系,以下参数几乎用不上,可略过coord_cartesian(xlim = NULL, ylim = NULL, expand = TRUE, default = FALSE, clip = "on")
参数解释:
* xlim, ylim 表示设定x轴和y轴的绘图范围,如果同时设定clip=“off”则表示将不绘制在范围外的数据点,通常不进行设置,
而是后期从标度中更改显示范围
* expand 表示是否将扩展xlim和ylim,默认扩展以绘制可能出现在绘图范围以外的数据
* default 表示是否更改默认坐标系,默认FALSE不更改,TRUE则会变成另一个坐标系
6.2 coord_fixed()修改纵横比坐标系
coord_cartesian()为纵横比没有固定的坐标系,表示纵轴和横轴的相对单位长度没有固定,
增加数据,则原图形的比例会变,背景都是正方形格子
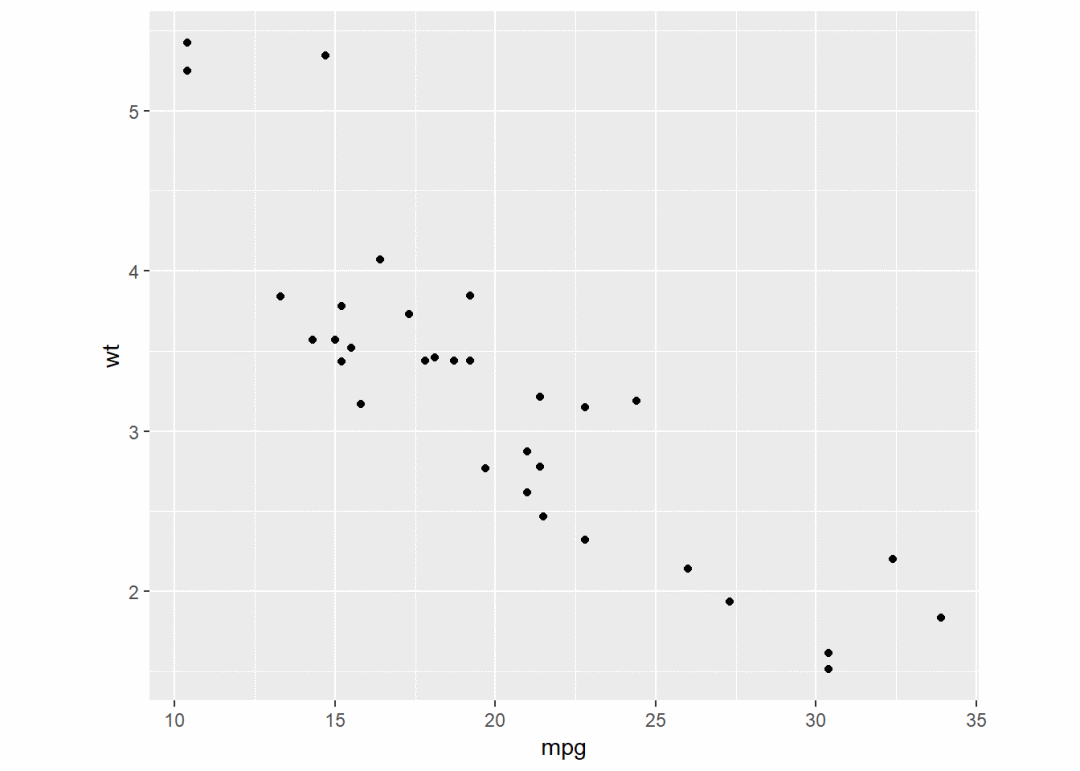
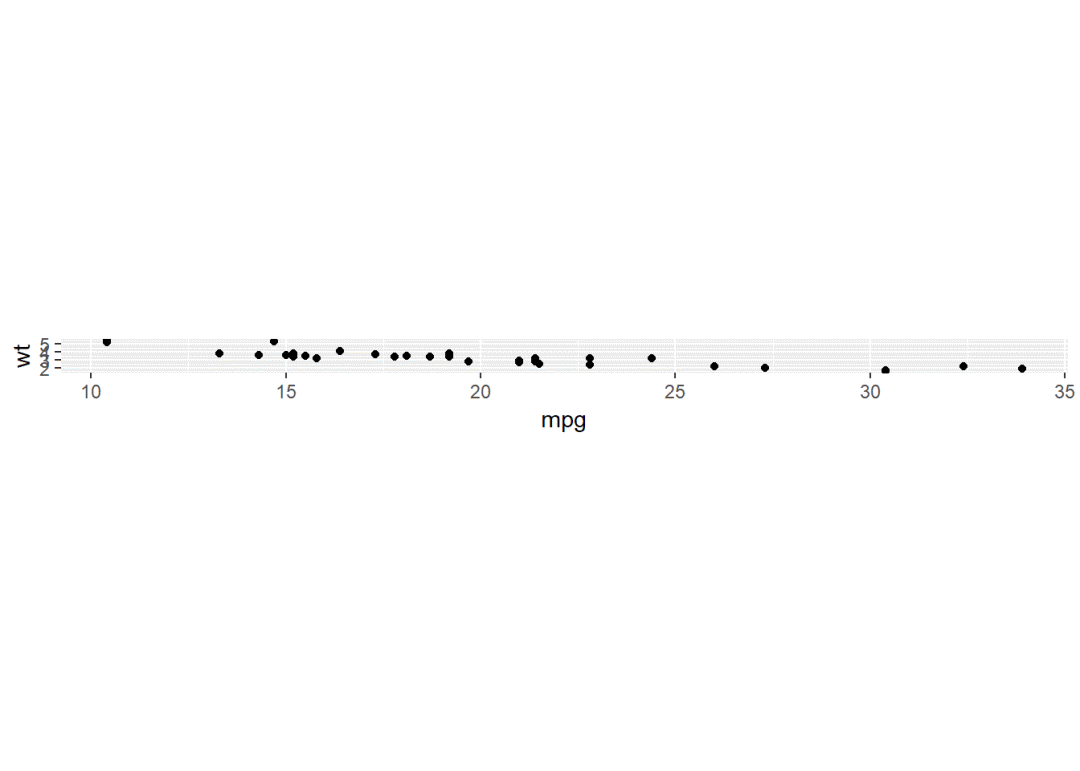
而coord_fixed()坐标系纵横比可以设置固定,纵横比可以用参数ratio自定义,背景为矩形格子,
固定纵横比后,无论什么图形,其比例都是一样的,常用于横轴,纵轴都是数字的情况
语法:coord_fixed(ratio = 1, xlim = NULL, ylim = NULL, expand = TRUE, clip = "on")
参数ratio表示指定纵横比,默认为1表示固定纵横比为1, 纵横比越大,则同样尺寸,其纵轴视觉长度越长
library(ggplot2)
p <- ggplot(mtcars, aes(mpg, wt)) + geom_point()

p + coord_fixed(ratio = 1)  # 固定纵横比为1
p + coord_fixed(ratio = 5)  # 固定纵横比为5,变高变窄
p + coord_fixed(ratio = 1/5)  # 纵横比小于1,变矮变宽
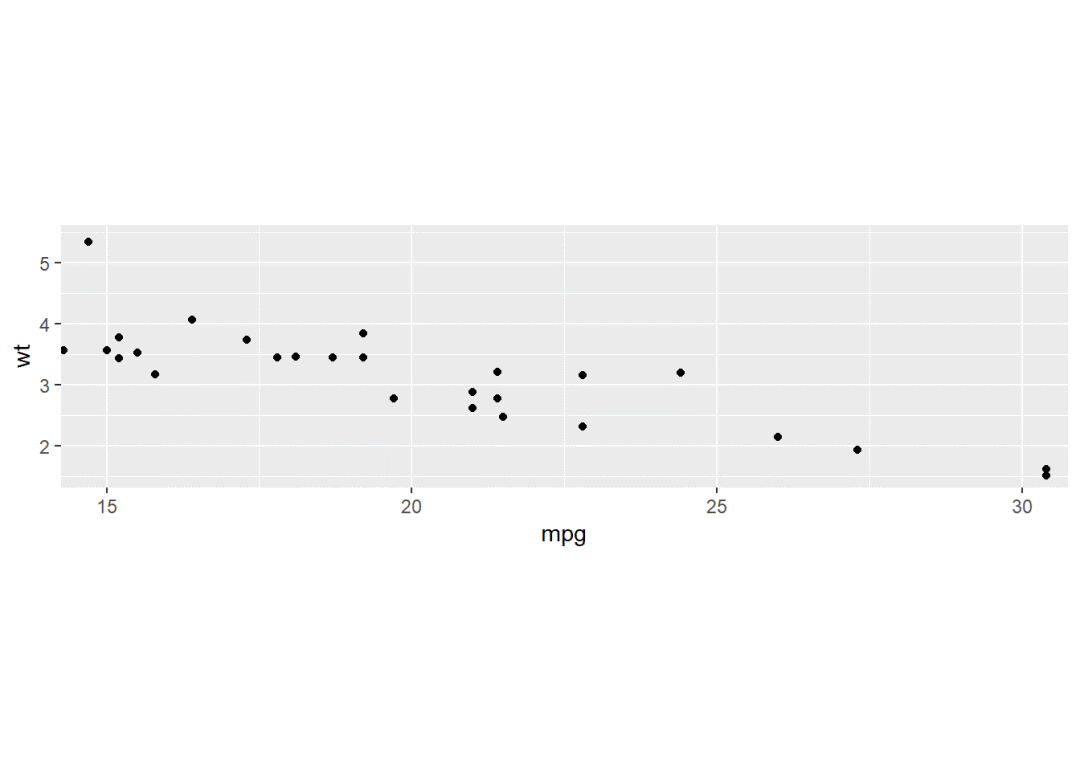
p + coord_fixed(xlim = c(15, 30))  # 默认纵横比为1,设定x轴显示范围为15到30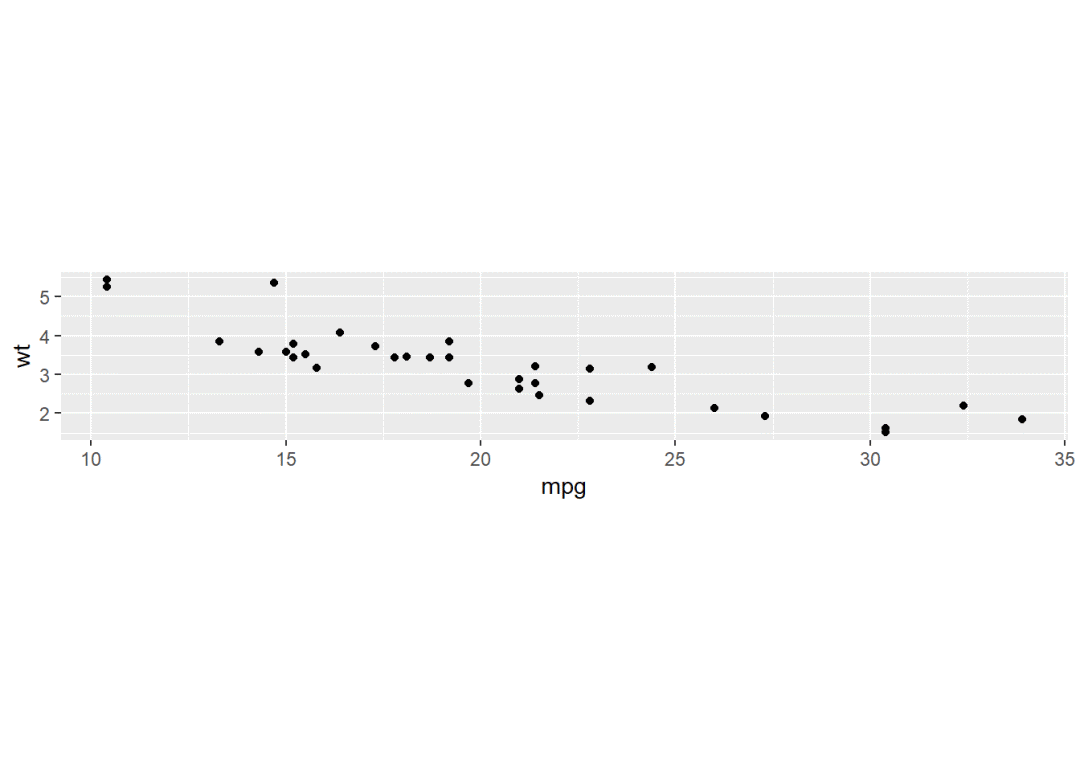
6.3 coord_flip()翻转坐标系
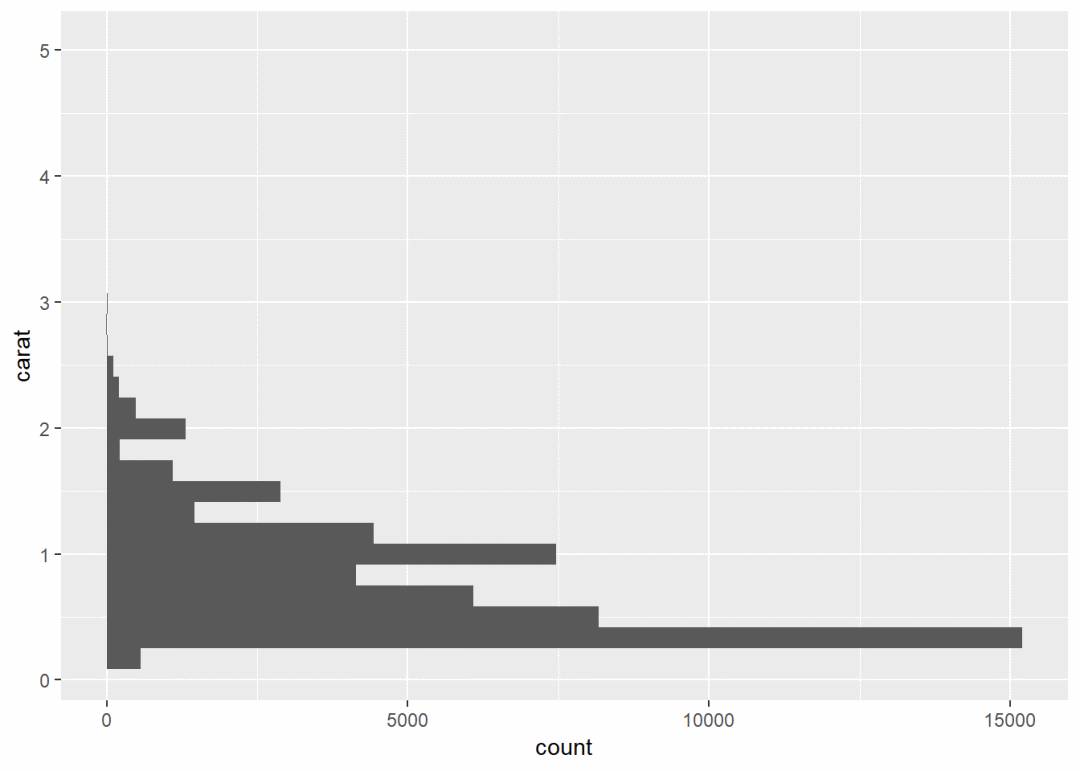
翻转坐标系指翻转笛卡尔坐标的横轴和纵轴位置,翻转后柱形图变成条形图coord_flip(xlim = NULL, ylim = NULL, expand = TRUE, clip = "on") 内部参数与标准笛卡尔坐标系一样,不用介绍
翻转后横轴为y轴,纵轴为x轴
h <- ggplot(diamonds, aes(carat)) + geom_histogram()
h
h + coord_flip()  # 翻转坐标系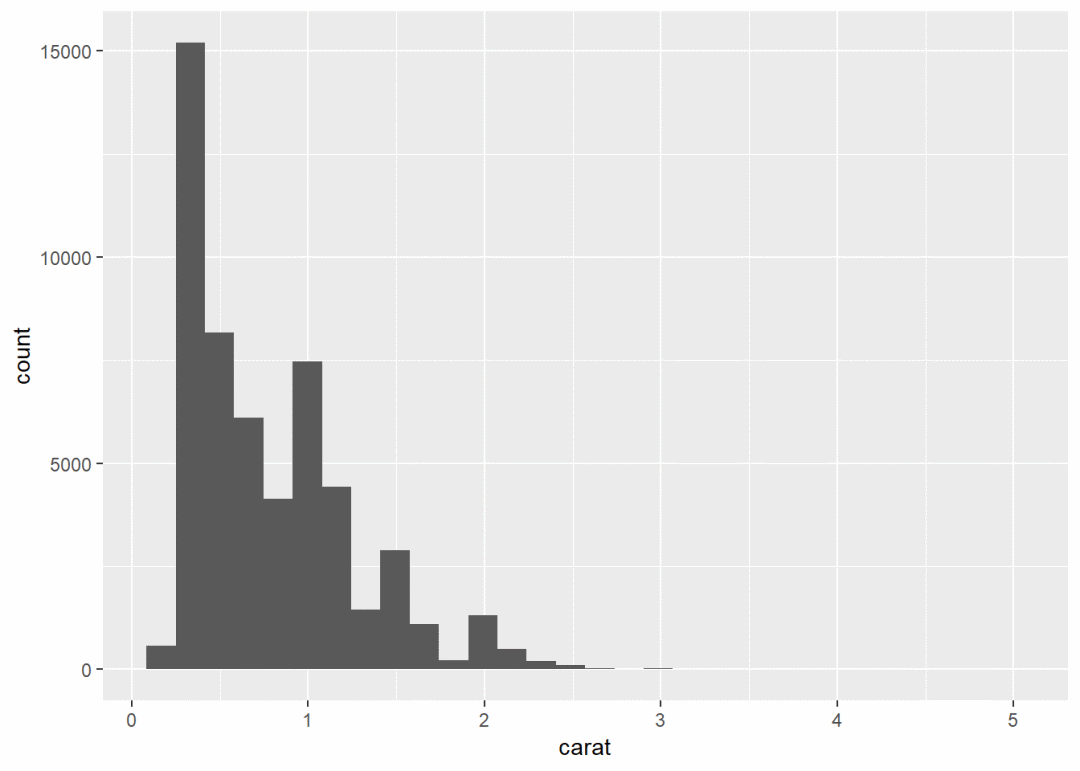
6.4 coord_polar()极坐标投影
能将笛卡尔坐标, coord_polar(theta = "x", start = 0, direction = 1, clip = "on")
参数解释:
* theta 表示要极坐标化的中心轴,即该轴转化为圆周,另一个轴转化为半径
* direction 表示排列方向,direction=1表示顺时针,direction=-1表示逆时针
* start 表示起始角度,以距离12点针的弧度衡量,具体位置与direction参数有关,
若direction为1则在顺时针start角度处,若direction为-1则在逆时针start角度处
极坐标转化比较耗费计算机资源,最好先用rm(list = ls()); gc()清空内存
rm(list = ls())
gc()  # 清空内存
library(ggplot2)

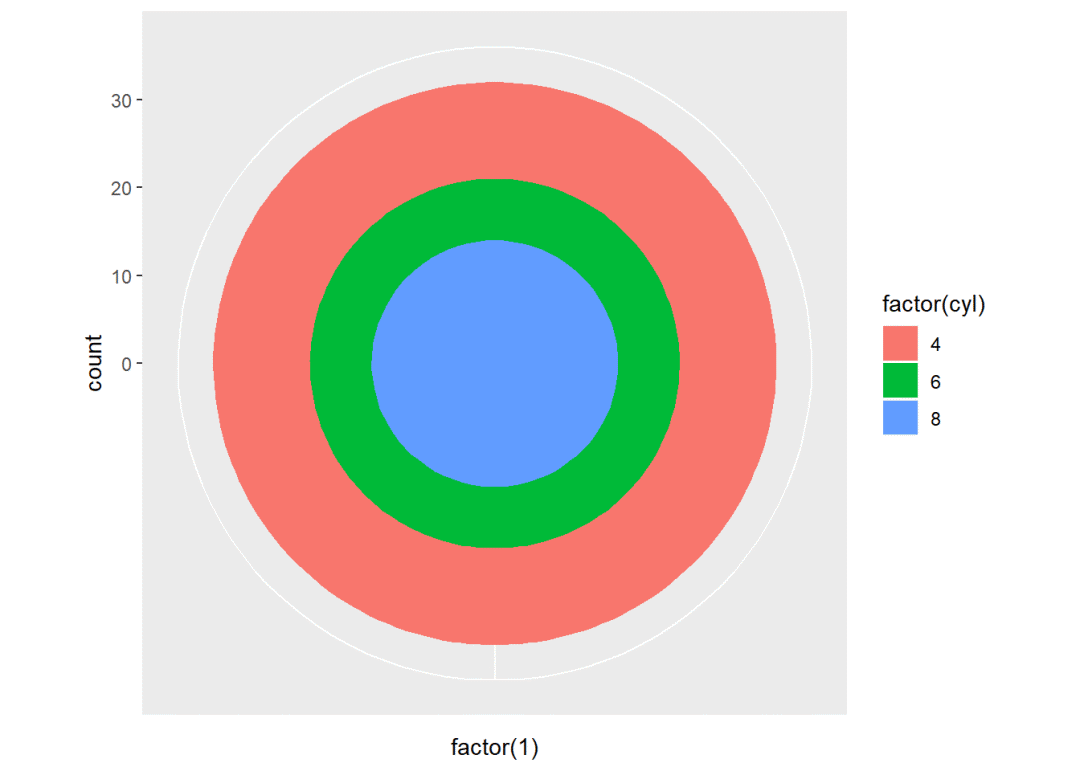
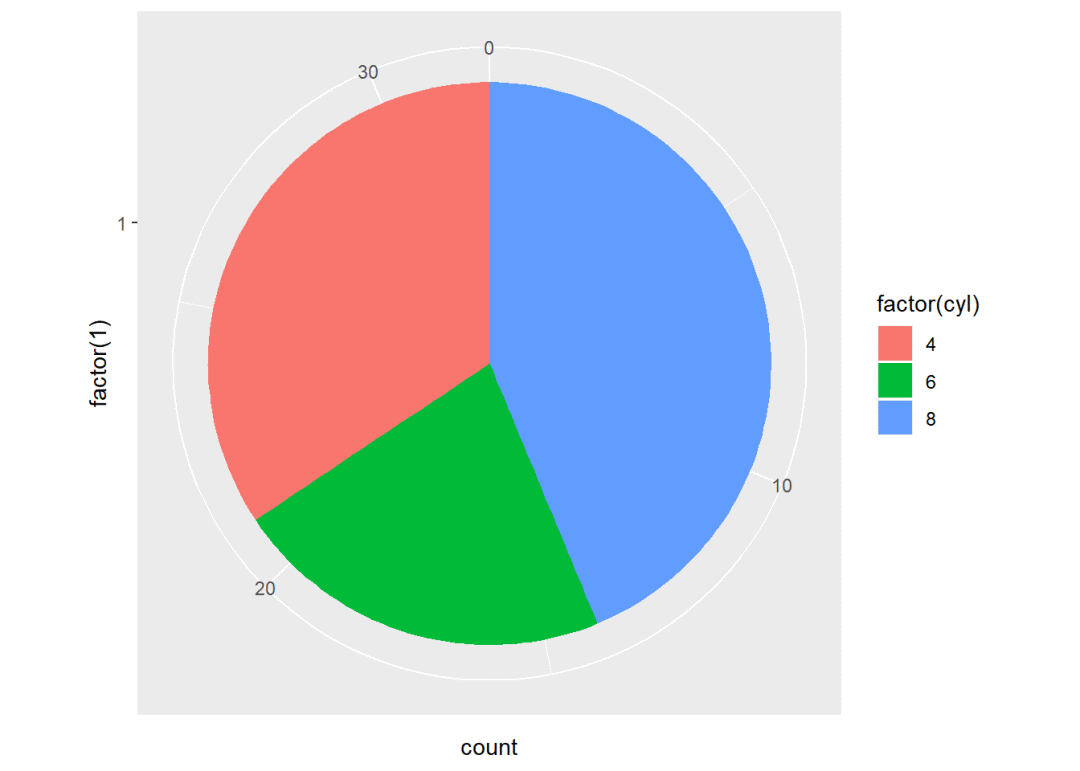
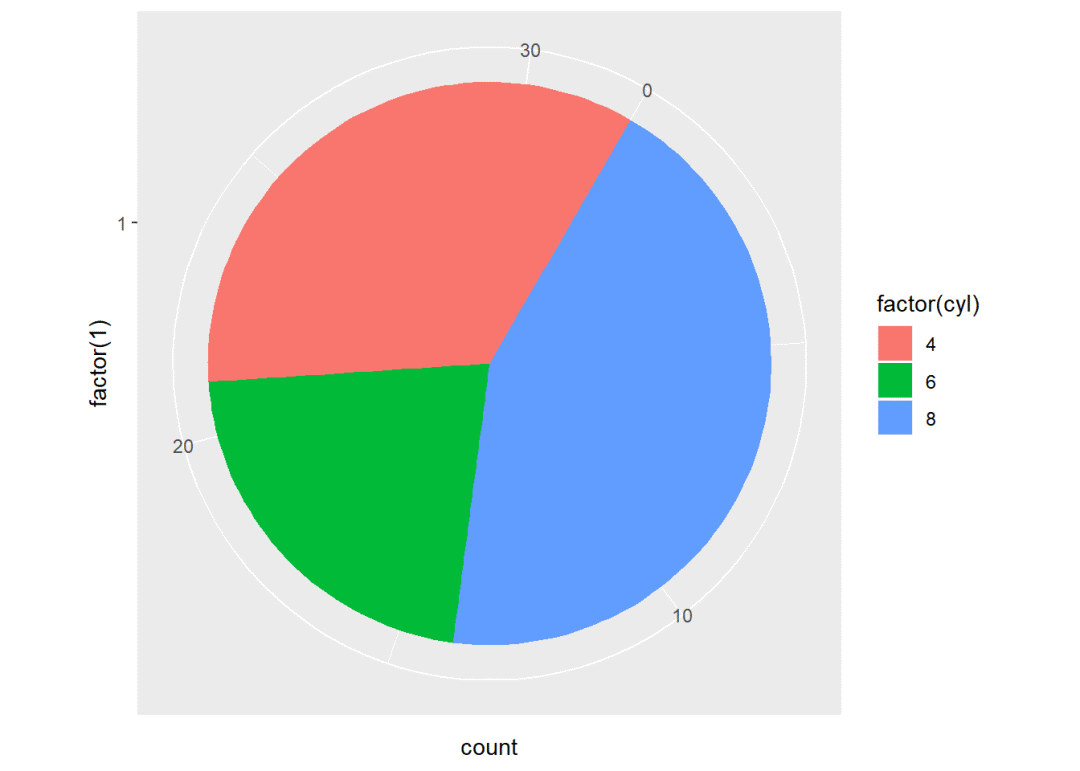
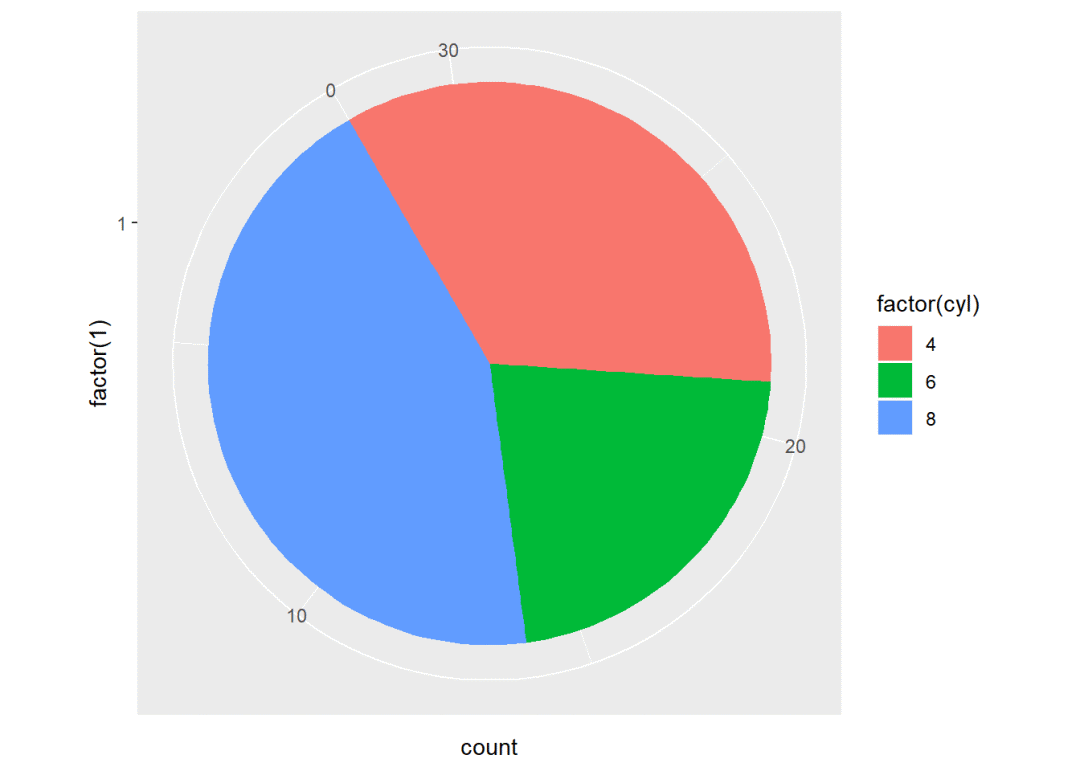
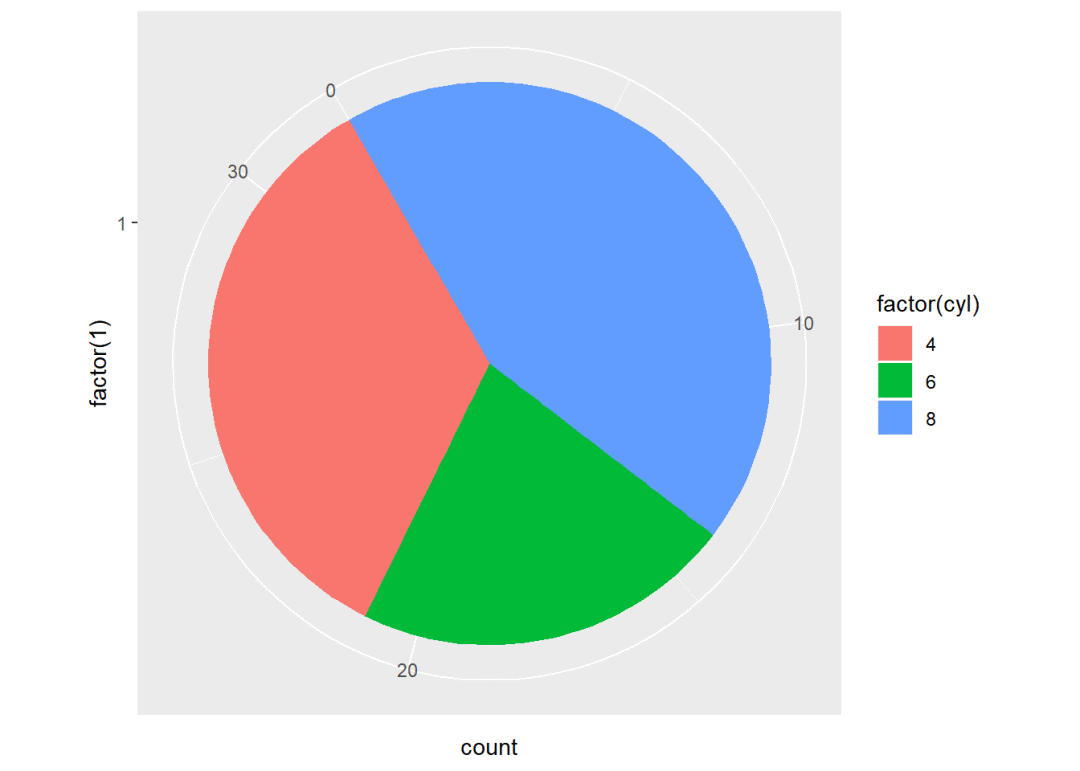
pie <- ggplot(mtcars, aes(x = factor(1), fill = factor(cyl))) + geom_bar(width = 1)
pie
pie + coord_polar(theta = "x")  # x轴极化, x刻度值都一样,所以变成多层圆环,y轴刻度值对应圆环半径
pie + coord_polar(theta = "y")  # y轴极化, y轴刻度值对应扇形弧度,x轴长度对应扇形半径
pie + coord_polar(theta = "y", start = pi/6, direction = 1)  # 起始位置为距离12点针方向30度,顺时针排列
pie + coord_polar(theta = "y", start = pi/6, direction = -1)  # 逆时针排列,起始位置与上面不一样
pie + coord_polar(theta = "y", start = -pi/6, direction = 1) # 起始位置与上面一样,但排列顺序不一样 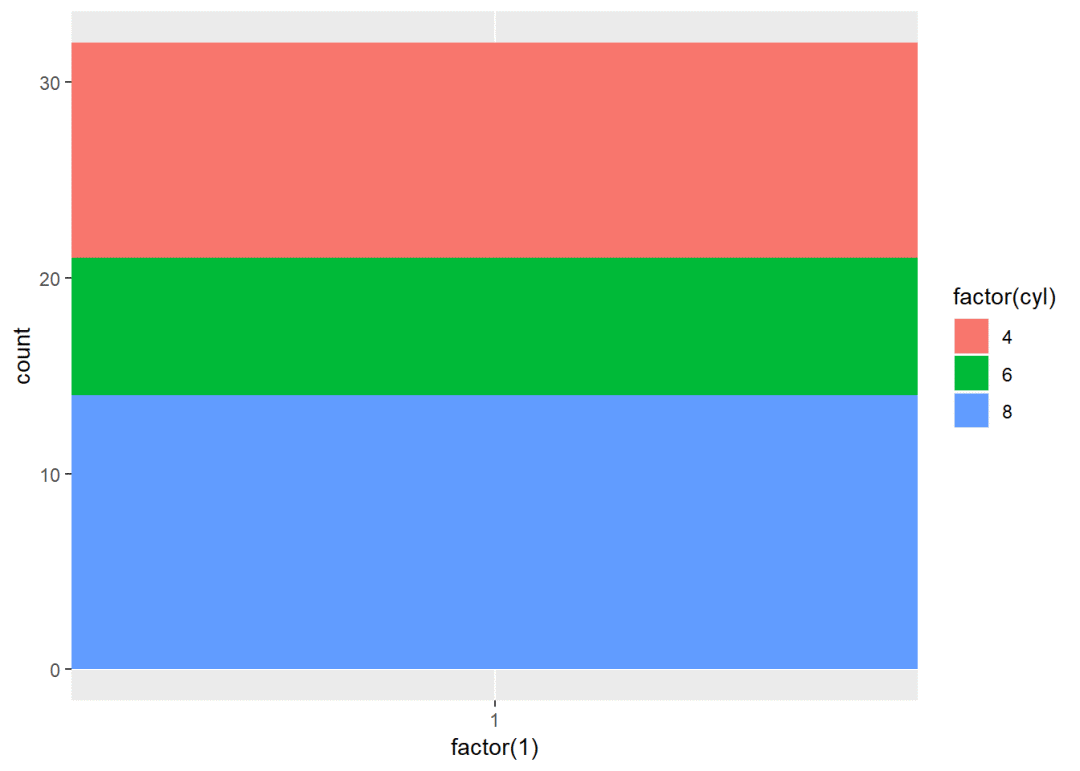
6.4.1 风玫瑰图(一种常见的极坐标图形)
rm(list = ls())
gc()  # 清空内存
library(ggplot2)
set.seed(42)
small <- diamonds[sample(nrow(diamonds), 1000), ]

ggplot(data = small) + geom_bar(aes(x = clarity, fill = cut)) + coord_polar() +
    scale_fill_brewer(type = "qual", palette = "Set2", direction = -1)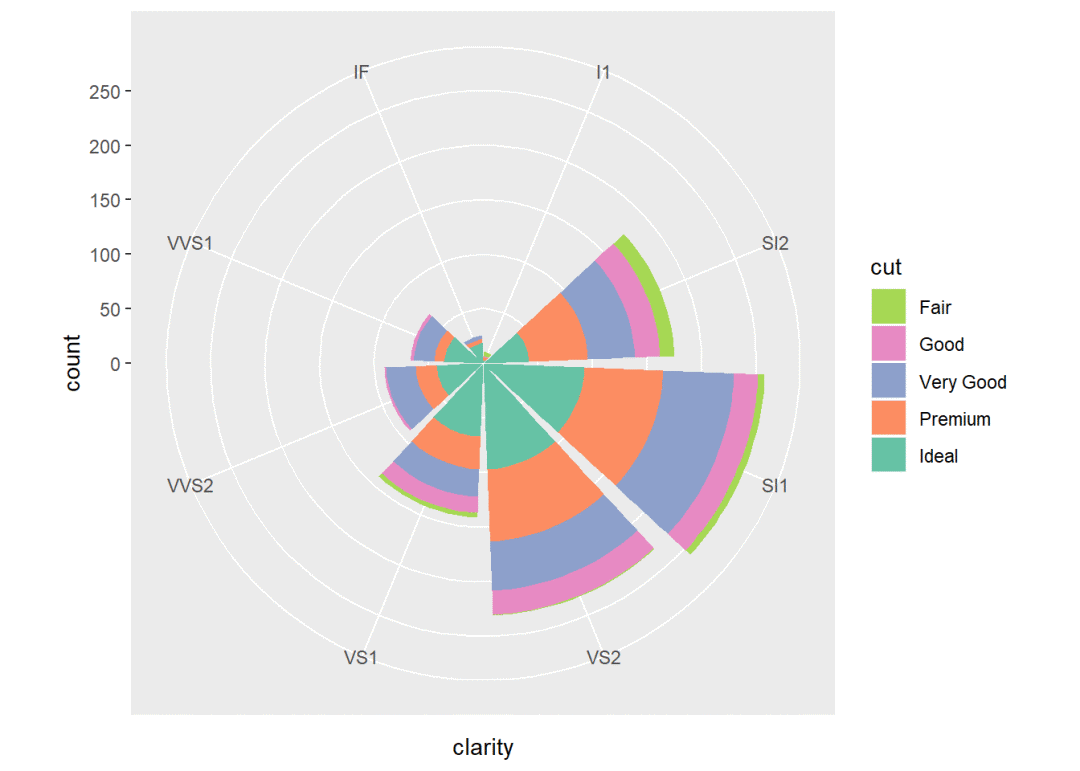
6.4.2 雷达图
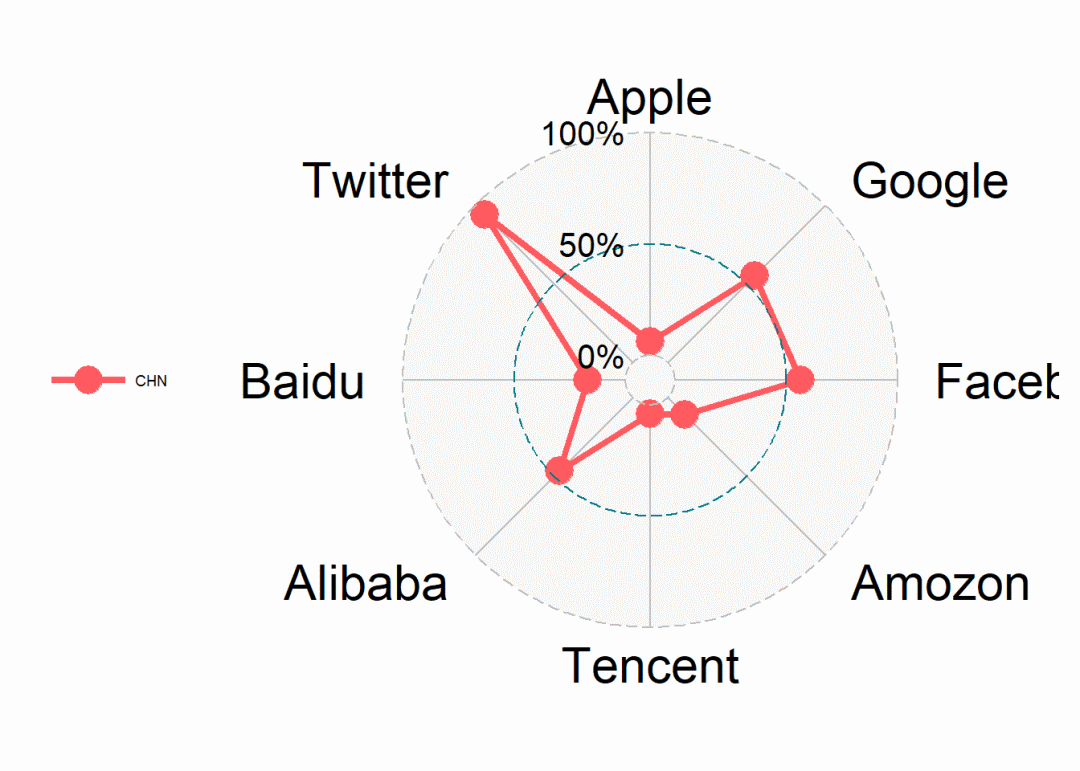
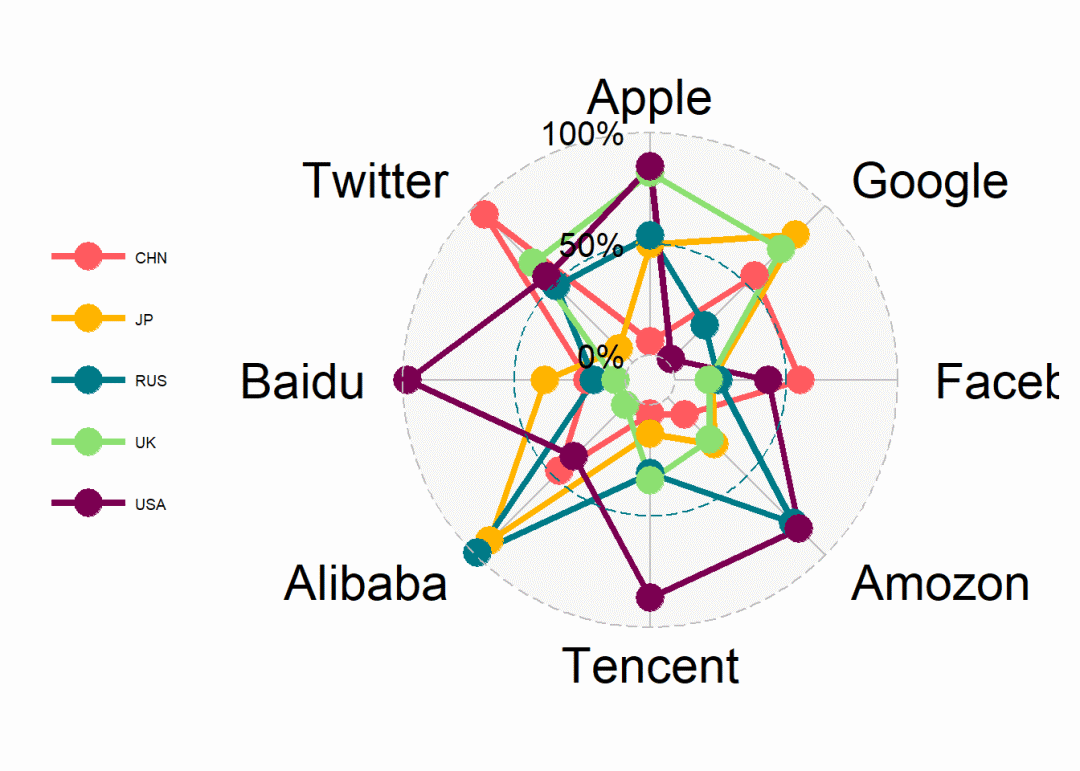
ggplot2极坐标转化不能制作雷达图,可以用ggradar包,安装方法devtools::install_github("ricardo-bion/ggradar")
ggradar支持的数据形式与ggplot2有些区别,采用行分类,宽数据最好,好在雷达图的数据量都比较小
ggradar智能化程度非常高,导入适合的数据就能出图,后期美化可以慢慢来
rm(list = ls())
gc()  # 清空内存
library(ggradar)

mydata <- matrix(runif(40, 0, 1), 5, 8)  # 构造数据集,5行8列的矩阵
rownames(mydata) <- LETTERS[1:5]  # 大写字母为矩阵行命名
colnames(mydata) <- c("Apple", "Google", "Facebook", "Amozon", "Tencent", "Alibaba",
    "Baidu", "Twitter")  # 矩阵列命名
mynewdata <- data.frame(mydata)  # 将矩阵转化为数据框

Name <- c("USA", "CHN", "UK", "RUS", "JP")
mynewdata <- data.frame(Name, mynewdata)  # 增加一列字符串数据
mynewdata
# 单序列:
ggradar(mynewdata[2, ])  # 以列名为变量,对第2行数据进行绘图,显示各个公司在中国的业务

# 多序列:
ggradar(mynewdata)  # 对所有行同时作图
| Name <fctr> | Apple <dbl> | <dbl> | <dbl> | Amozon <dbl> | Tencent <dbl> | Alibaba <dbl> | Baidu <dbl> | |
|---|---|---|---|---|---|---|---|---|---|
| A | USA | 0.84829322 | 0.02222732 | 0.4214739 | 0.8351096 | 0.86756875 | 0.37383448 | 0.97939015 | |
| B | CHN | 0.06274633 | 0.55409313 | 0.5649106 | 0.1110784 | 0.03942325 | 0.46496563 | 0.17047221 | |
| C | UK | 0.81984509 | 0.71989760 | 0.1516908 | 0.2680701 | 0.33982351 | 0.04660819 | 0.04273437 | |
| D | RUS | 0.53936029 | 0.23571523 | 0.1947924 | 0.7984810 | 0.30959610 | 0.98751620 | 0.14283236 | |
| E | JP | 0.49902010 | 0.81187968 | 0.1667830 | 0.2989294 | 0.12945369 | 0.90845233 | 0.36058084 |
5 rows | 1-9 of 10 columns
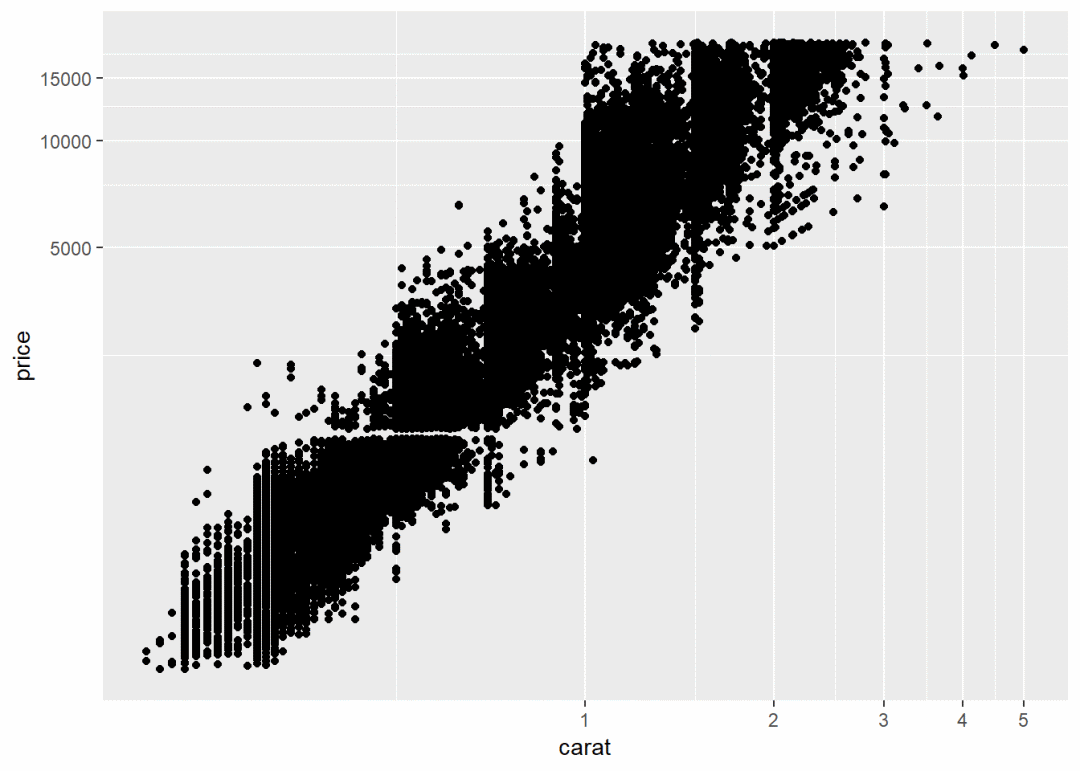
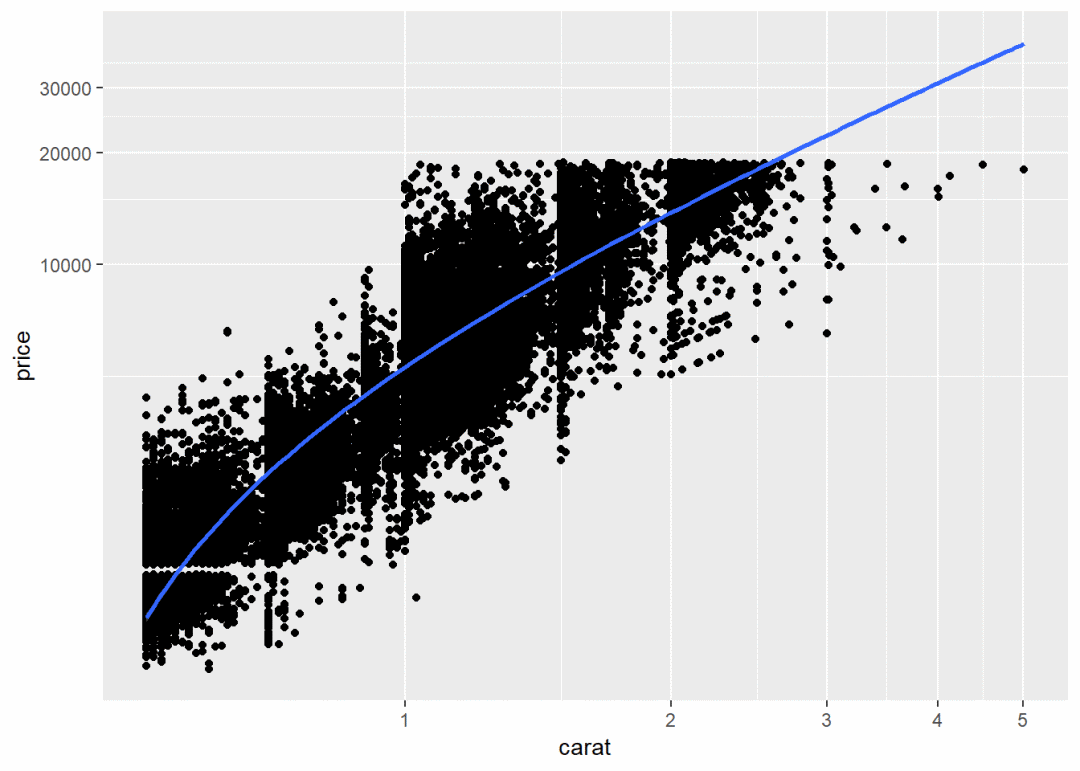
6.5 coord_trans()变换笛卡尔坐标
原始的笛卡尔坐标上,坐标轴上的刻度比例尺是不变的,而coord_trans轴上刻度比例尺是变化的,
这种坐标系应用很少,但不是没用, 可以将曲线变成直线显示, 如果数据点在某个轴方向的密集程度是变化的,这样不便于观察,可以通过改变比例尺来调节,使数据点集中显示,更加方便观察
语法: coord_trans(x = "identity", y = "identity", limx = NULL, limy = NULL, clip = "on", xtrans, ytrans)
参数解释:
* x,y 表示指定坐标轴比例尺变换的方式,默认identity不变化 *
library(ggplot2)

ggplot(diamonds, aes(log10(carat), log10(price))) +
  geom_point() # 正常笛卡尔坐标系

# 通过设置坐标轴标度,使坐标轴比例尺渐变
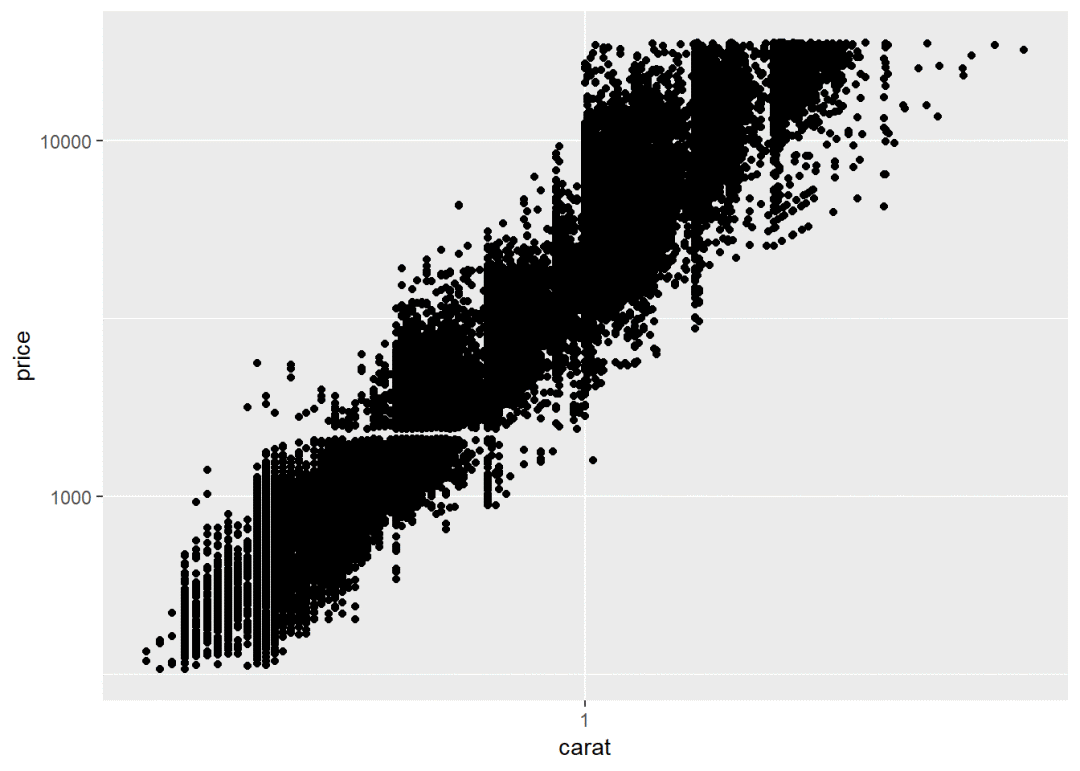
ggplot(diamonds, aes(carat, price)) +
  geom_point() +
  scale_x_log10() + # 坐标轴刻度对数变换
  scale_y_log10()

# 采用变换笛卡尔坐标轴,结果与上面一样
ggplot(diamonds, aes(carat, price)) +
  geom_point() +
  coord_trans(x = "log10", y = "log10")

# 线性拟合
d <- subset(diamonds, carat > 0.5)
ggplot(d, aes(carat, price)) +
  geom_point() +
  geom_smooth(method = "lm") +
  coord_trans(x = "log10", y = "log10") # lm线性拟合结果为直线,但变换坐标轴后变成了曲线

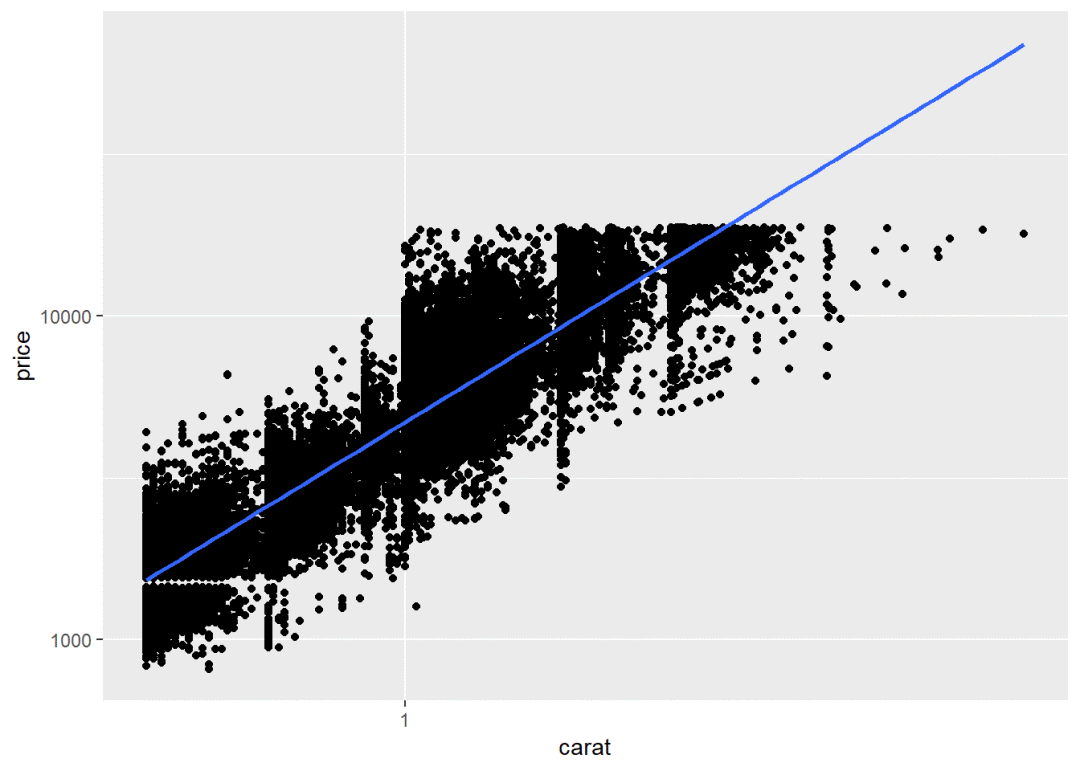
ggplot(d, aes(carat, price)) +
  geom_point() +
  geom_smooth(method = "lm") +
  scale_x_log10() +
  scale_y_log10() # 通过调整标度的方式,仍然为直线,点的位置并没有发生改变

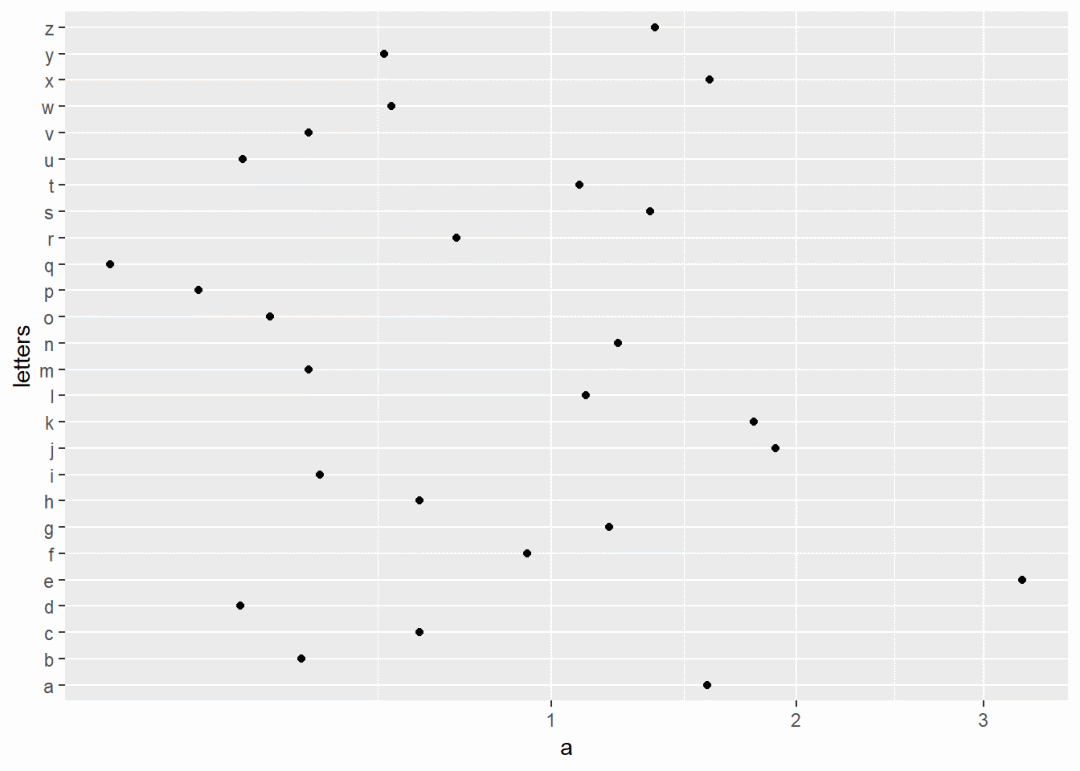
df <- data.frame(a = abs(rnorm(26)),letters)
plot <- ggplot(df,aes(a,letters)) + geom_point()

plot + coord_trans(x = "log10") # 对x坐标轴比例尺对数运算
plot + coord_trans(x = "sqrt") # 对x轴坐标轴比例尺开方运算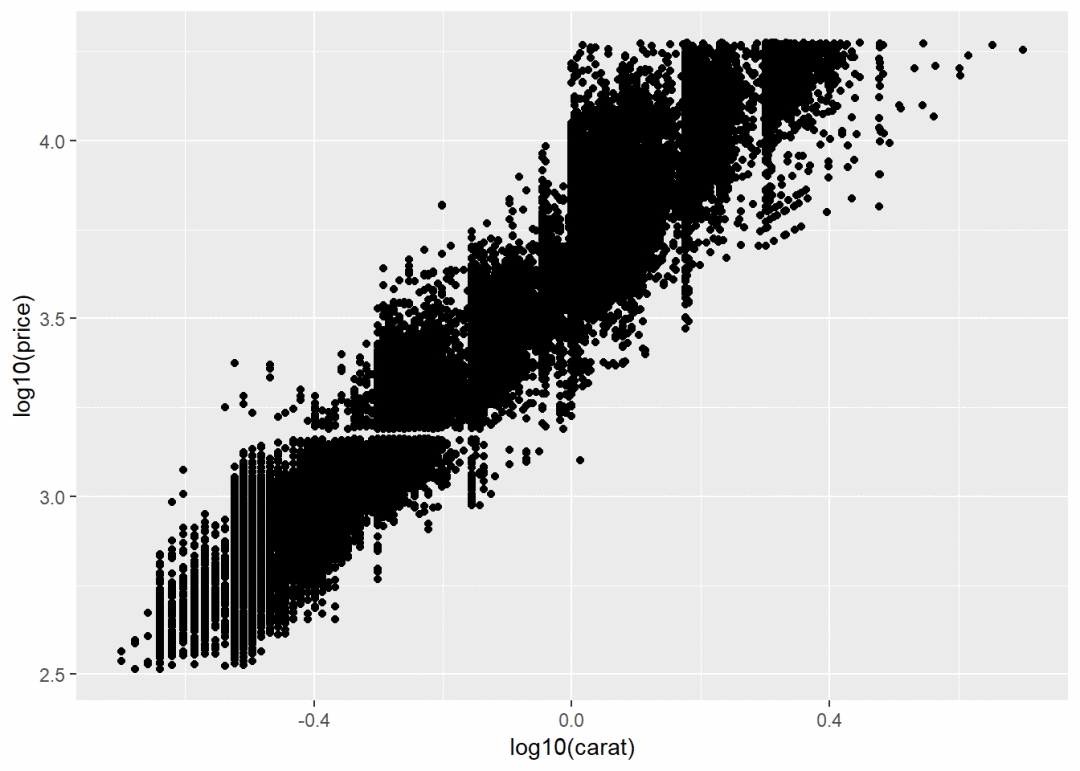
6.6 coord_map()球面投影坐标系
地图投影需要特殊的数据源和很多扩展包,会在其它章节单独演示

 往期回顾
●
R_插值_拟合_回归_样条
●
R_circlize包_和弦图(一)
●
R_circlize包_和弦图(二)

公众号后台回复关键字即可学习
回复 爬虫 爬虫三大案例实战
回复 Python 1小时破冰入门回复 数据挖掘 R语言入门及数据挖掘
回复 人工智能 三个月入门人工智能
回复 数据分析师 数据分析师成长之路
回复 机器学习 机器学习的商业应用
回复 数据科学 数据科学实战
回复 常用算法 常用数据挖掘算法
最后
以上就是无奈哑铃最近收集整理的关于R_ggplot2基础(二)5 stat_xxx()统计变换6 coor_xxx()坐标系变换的全部内容,更多相关R_ggplot2基础(二)5 stat_xxx()统计变换6 coor_xxx()坐标系变换内容请搜索靠谱客的其他文章。


发表评论 取消回复