一、引入
import pandas as pd
pd.plotting.register_matplotlib_converters()
import matplotlib.pyplot as plt
%matplotlib inline
import seaborn as sns
print("Setup Complete")
# Path of the file to read
fifa_filepath = "../input/fifa.csv"
# Read the file into a variable fifa_data
fifa_data = pd.read_csv(fifa_filepath, index_col="Date", parse_dates=True)
# Print the first 5 rows of the data
fifa_data.head()
# Set the width and height of the figure
plt.figure(figsize=(16,6))
# Line chart showing how FIFA rankings evolved over time
sns.lineplot(data=fifa_data)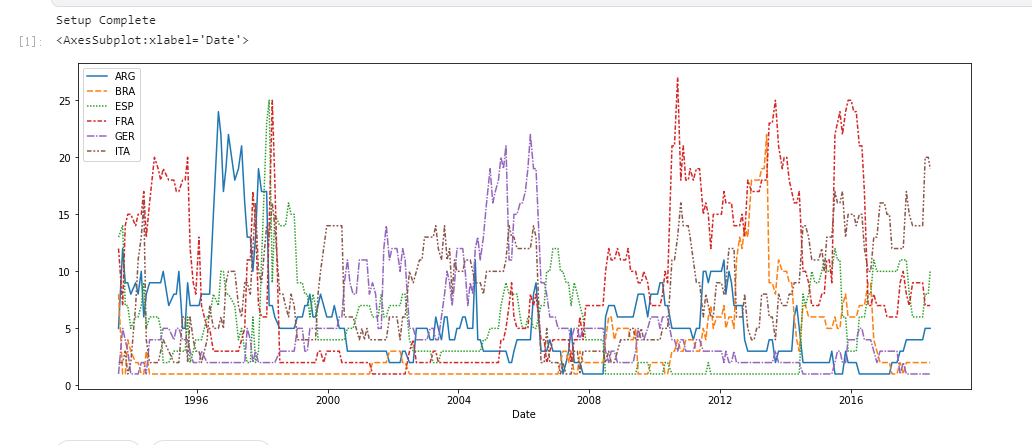
二、折线图
import pandas as pd
pd.plotting.register_matplotlib_converters()
import matplotlib.pyplot as plt
%matplotlib inline
import seaborn as sns
print("Setup Complete")
# Path of the file to read
spotify_filepath = "../input/spotify.csv"
# Read the file into a variable spotify_data
spotify_data = pd.read_csv(spotify_filepath, index_col="Date", parse_dates=True)
# Print the first 5 rows of the data
spotify_data.head()
# Print the last five rows of the data
spotify_data.tail()

#第一张图
# Line chart showing daily global streams of each song
sns.lineplot(data=spotify_data)

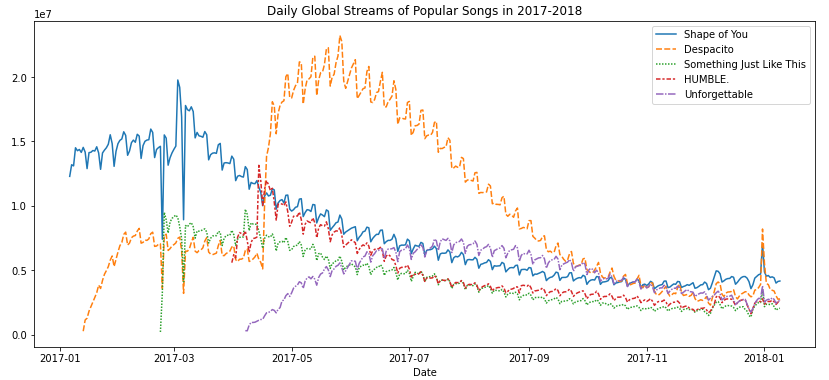
#第二张图:图片大小和标题设置
# Set the width and height of the figure
plt.figure(figsize=(14,6))
# Add title
plt.title("Daily Global Streams of Popular Songs in 2017-2018")
# Line chart showing daily global streams of each song
sns.lineplot(data=spotify_data)

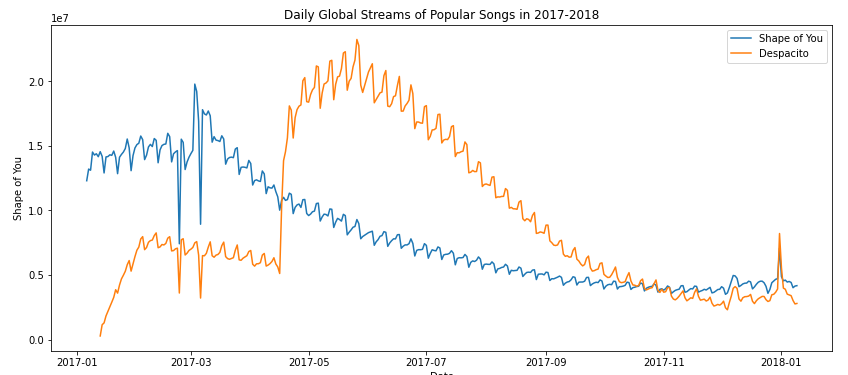
#第三张图:只绘制前两列数据的折线图
list(spotify_data.columns)
# Set the width and height of the figure
plt.figure(figsize=(14,6))
# Add title
plt.title("Daily Global Streams of Popular Songs in 2017-2018")
# Line chart showing daily global streams of 'Shape of You'
sns.lineplot(data=spotify_data['Shape of You'], label="Shape of You")
# Line chart showing daily global streams of 'Despacito'
sns.lineplot(data=spotify_data['Despacito'], label="Despacito")
# Add label for horizontal axis
plt.xlabel("Date")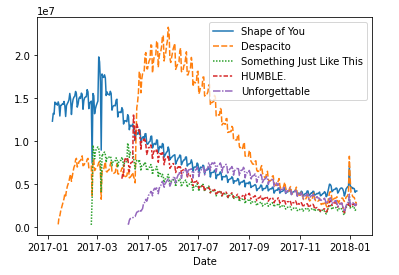
三、条形图和热力图
import pandas as pd
pd.plotting.register_matplotlib_converters()
import matplotlib.pyplot as plt
%matplotlib inline
import seaborn as sns
print("Setup Complete")

#载入数据
# Path of the file to read
flight_filepath = "../input/flight_delays.csv"
# Read the file into a variable flight_data
flight_data = pd.read_csv(flight_filepath, index_col="Month")
# Print the data
flight_data

#绘制柱状图
# Set the width and height of the figure
plt.figure(figsize=(10,6))
# Add title
plt.title("Average Arrival Delay for Spirit Airlines Flights, by Month")
# Bar chart showing average arrival delay for Spirit Airlines flights by month
sns.barplot(x=flight_data.index, y=flight_data['NK'])
# Add label for vertical axis
plt.ylabel("Arrival delay (in minutes)")

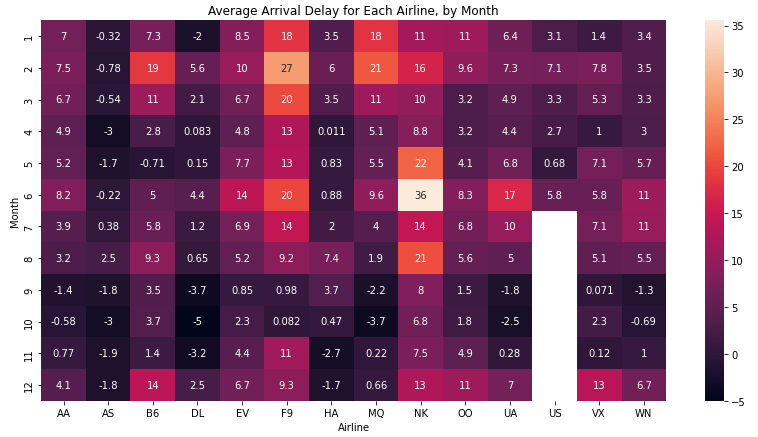
#绘制热力图
# Set the width and height of the figure
plt.figure(figsize=(14,7))
# Add title
plt.title("Average Arrival Delay for Each Airline, by Month
# Heatmap showing average arrival delay for each airline by month
sns.heatmap(data=flight_data, annot=True)
# Add label for horizontal axis
plt.xlabel("Airline")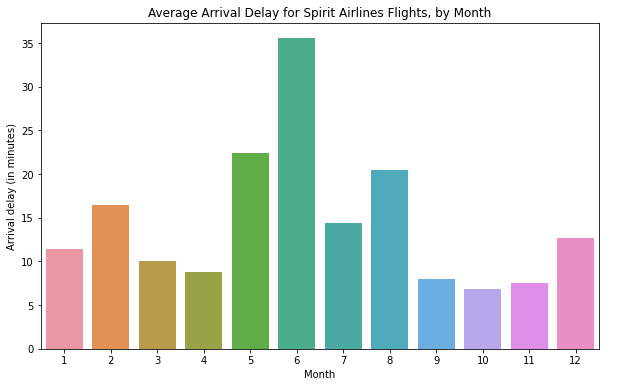
四、散点图
#配置环境
import pandas as pd
pd.plotting.register_matplotlib_converters()
import matplotlib.pyplot as plt
%matplotlib inline
import seaborn as sns
print("Setup Complete")

#加载数据
# Path of the file to read
insurance_filepath = "../input/insurance.csv"
# Read the file into a variable insurance_data
insurance_data = pd.read_csv(insurance_filepath)

#测试数据
insurance_data.head()

#1. 绘制散点图
sns.scatterplot(x=insurance_data['bmi'], y=insurance_data['charges'])

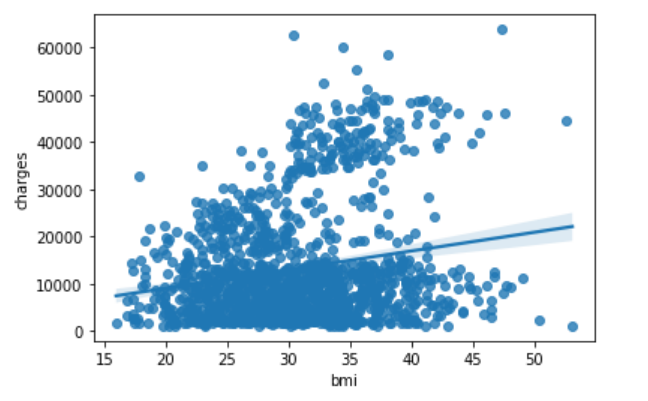
#2.绘制带回归线的散点图
sns.regplot(x=insurance_data['bmi'], y=insurance_data['charges'])

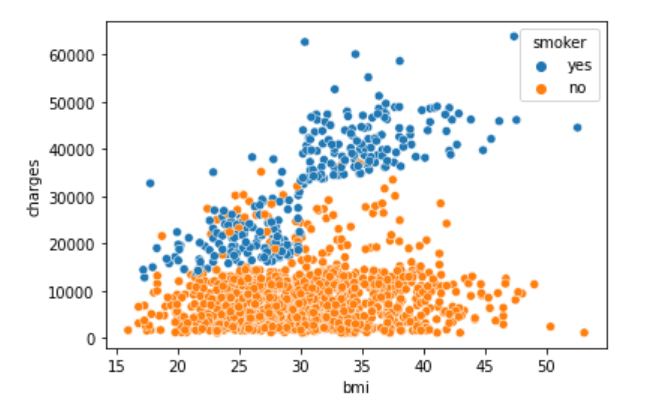
#3. 绘制标记颜色的散点图
sns.scatterplot(x=insurance_data['bmi'], y=insurance_data['charges'], hue=insurance_data['smoker'])

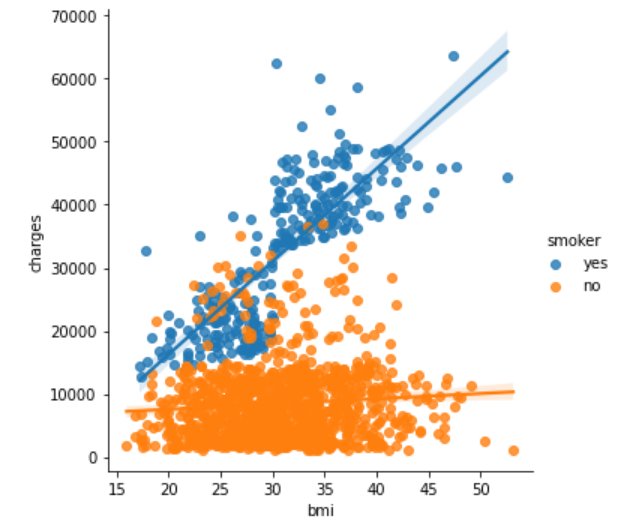
#4. 标记颜色带回归的散点图
sns.lmplot(x="bmi", y="charges", hue="smoker", data=insurance_data)

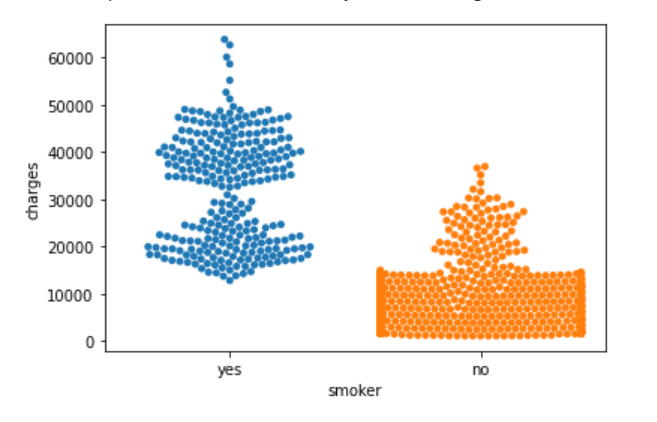
#5. 分类散点图
sns.swarmplot(x=insurance_data['smoker'],
              y=insurance_data['charges'])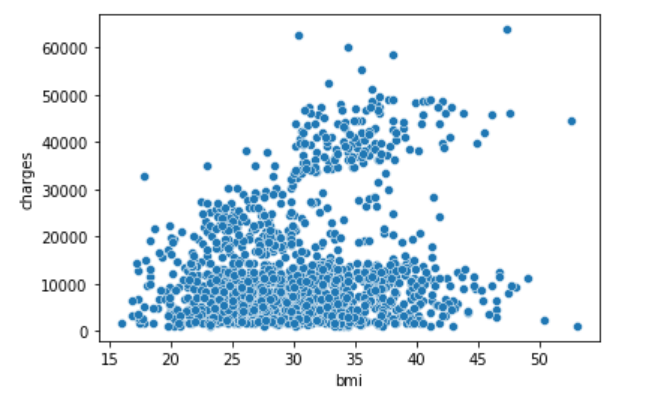
五、直方图和KDE图
#环境配置
import pandas as pd
pd.plotting.register_matplotlib_converters()
import matplotlib.pyplot as plt
%matplotlib inline
import seaborn as sns
print("Setup Complete")

#加载和验证数据
# Path of the file to read
iris_filepath = "../input/iris.csv"
# Read the file into a variable iris_data
iris_data = pd.read_csv(iris_filepath, index_col="Id")
# Print the first 5 rows of the data
iris_data.head()

#直方图
# Histogram
sns.histplot(iris_data['Petal Length (cm)'])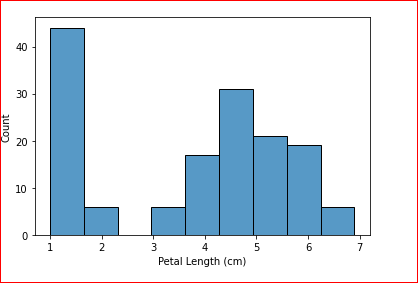
# KDE plot
sns.kdeplot(data=iris_data['Petal Length (cm)'], shade=True)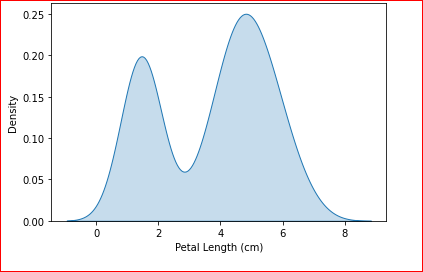
# 2D KDE plot 不填充
sns.jointplot(x=iris_data['Petal Length (cm)'], y=iris_data['Sepal Width (cm)'], kind="kde")
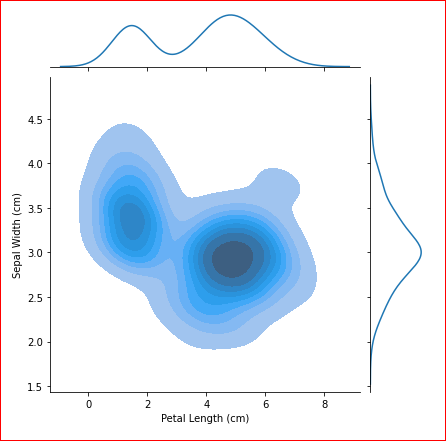
#2d KDE 填充
sns.jointplot(x=iris_data['Petal Length (cm)'], y=iris_data['Sepal Width (cm)'], kind="kde",shade=True)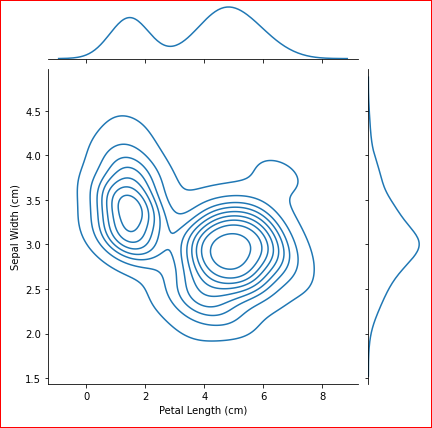
#直方图分类填充颜色
# Histograms for each species
sns.histplot(data=iris_data, x='Petal Length (cm)', hue='Species')
# Add title
plt.title("Histogram of Petal Lengths, by Species") 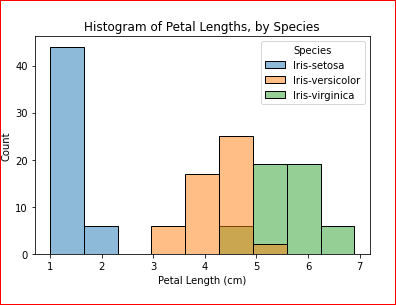
#KDE分类填充颜色
# KDE plots for each species
sns.kdeplot(data=iris_data, x='Petal Length (cm)', hue='Species', shade=True)
# Add title
plt.title("Distribution of Petal Lengths, by Species") 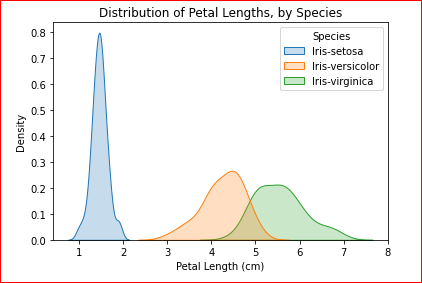
最后
以上就是重要铅笔最近收集整理的关于python seaborn绘图一、引入二、折线图三、条形图和热力图 四、散点图 五、直方图和KDE图的全部内容,更多相关python内容请搜索靠谱客的其他文章。
本图文内容来源于网友提供,作为学习参考使用,或来自网络收集整理,版权属于原作者所有。


发表评论 取消回复