1、线图上添加文字和箭头注释
x = linspace(0,3);
y = x.^2.*sin(x);           %x是向量,此处有关x的运算用点运算
plot(x,y);
line([2,2],[0,2^2*sin(2)]);     %画一条线
% $$-表示LaTex的开始和结束位置
% int - 表示积分符号
% _{0} - 积分的下标起始值为0
% ^{2} - 积分的上标终止位置为2
str = '$$ int_{0}^{2} x^2sin(x) dx $$';
text(0.25,2.5,str,'Interpreter','latex');   %显示文本,有坐标位置和内容
annotation('arrow','X',[0.32,0.5],'Y',[0.6,0.4]);   %注释箭头,箭头的起止坐标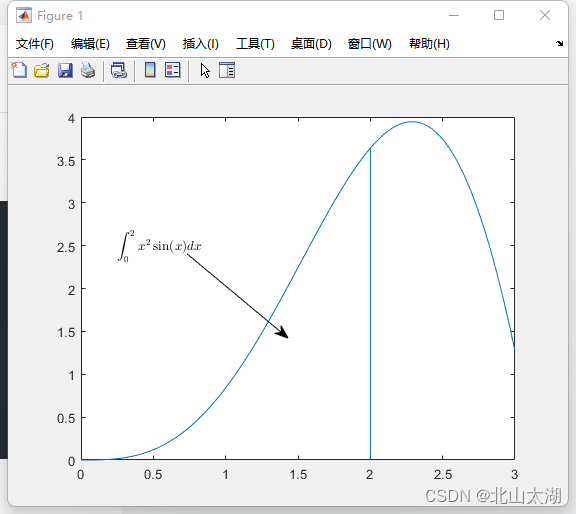
annotation用法可参考:annotation
使用annotation添加箭头注释时需要注意,annotation的坐标和所画的图的坐标没关系,annotation的坐标归化为[0,1],其坐标范围为整个画图窗口,原点在窗口的左下角,如画一个左下角到右上角的箭头注释:
annotation('arrow','X',[0,1],'Y',[0,1]); 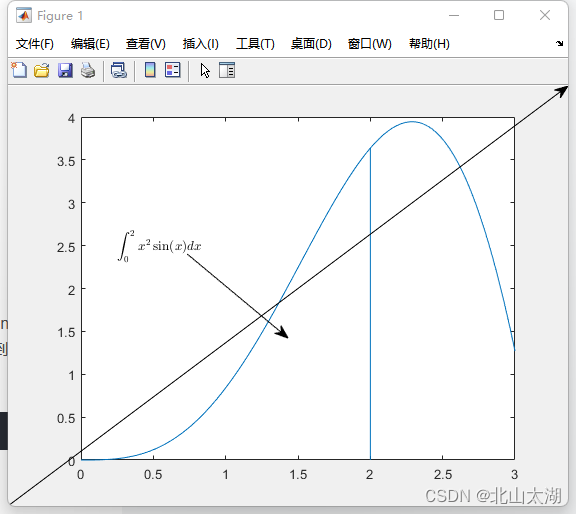
2、属性设置
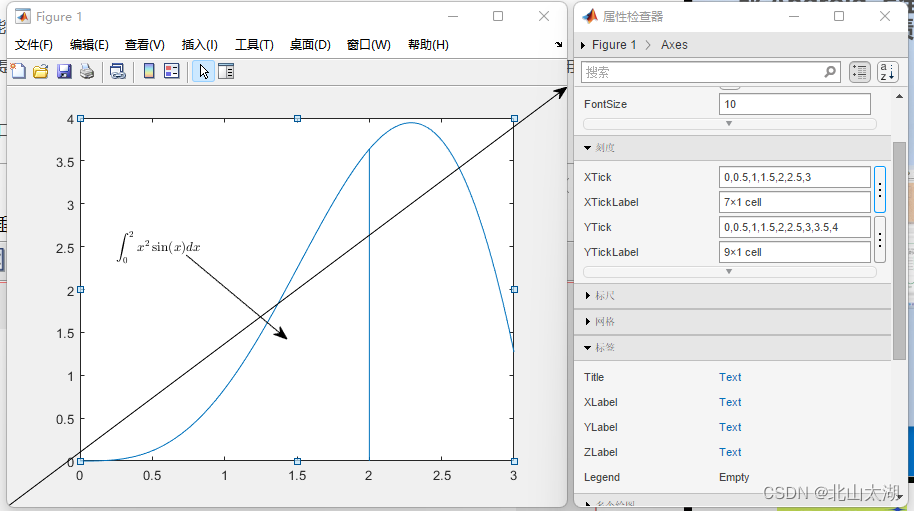
可在绘图界面的“编辑-属性”窗口编辑所绘图的坐标Tick、字体、颜色、标签等信息属性:
3、get(gca)查看所绘图形属性
get(gca)
ALim: [0 1]
ALimMode: 'auto'
ActivePositionProperty: 'outerposition'
AlphaScale: 'linear'
Alphamap: [1×64 double]
AmbientLightColor: [1 1 1]
BeingDeleted: 'off'
Box: 'on'
BoxStyle: 'back'
BusyAction: 'queue'
ButtonDownFcn: ''
CLim: [0 1]
CLimMode: 'auto'
CameraPosition: [1.5000 2 17.3205]
CameraPositionMode: 'auto'
CameraTarget: [1.5000 2 0]
CameraTargetMode: 'auto'
CameraUpVector: [0 1 0]
CameraUpVectorMode: 'auto'
CameraViewAngle: 6.6086
CameraViewAngleMode: 'auto'
Children: [3×1 Graphics]
Clipping: 'on'
ClippingStyle: '3dbox'
Color: [1 1 1]
ColorOrder: [7×3 double]
ColorOrderIndex: 2
ColorScale: 'linear'
Colormap: [64×3 double]
CreateFcn: ''
CurrentPoint: [2×3 double]
DataAspectRatio: [1.5000 2 1]
DataAspectRatioMode: 'auto'
DeleteFcn: ''
FontAngle: 'normal'
FontName: 'Helvetica'
FontSize: 10
FontSizeMode: 'auto'
FontSmoothing: 'on'
FontUnits: 'points'
FontWeight: 'normal'
GridAlpha: 0.1500
GridAlphaMode: 'auto'
GridColor: [0.1500 0.1500 0.1500]
GridColorMode: 'auto'
GridLineStyle: '-'
HandleVisibility: 'on'
HitTest: 'on'
Interactions: [1×1 matlab.graphics.interaction.interface.DefaultAxesInteractionSet]
Interruptible: 'on'
LabelFontSizeMultiplier: 1.1000
Layer: 'bottom'
Legend: [0×0 GraphicsPlaceholder]
LineStyleOrder: '-'
LineStyleOrderIndex: 1
LineWidth: 0.5000
MinorGridAlpha: 0.2500
MinorGridAlphaMode: 'auto'
MinorGridColor: [0.1000 0.1000 0.1000]
MinorGridColorMode: 'auto'
MinorGridLineStyle: ':'
NextPlot: 'replace'
OuterPosition: [0 0 1 1]
Parent: [1×1 Figure]
PickableParts: 'visible'
PlotBoxAspectRatio: [1 0.7903 0.7903]
PlotBoxAspectRatioMode: 'auto'
Position: [0.1300 0.1100 0.7750 0.8150]
Projection: 'orthographic'
Selected: 'on'
SelectionHighlight: 'on'
SortMethod: 'childorder'
Tag: ''
TickDir: 'in'
TickDirMode: 'auto'
TickLabelInterpreter: 'tex'
TickLength: [0.0100 0.0250]
TightInset: [0.0435 0.0532 0.0170 0.0202]
Title: [1×1 Text]
TitleFontSizeMultiplier: 1.1000
TitleFontWeight: 'normal'
Toolbar: [1×1 AxesToolbar]
Type: 'axes'
UIContextMenu: [0×0 GraphicsPlaceholder]
Units: 'normalized'
UserData: []
View: [0 90]
Visible: 'on'
XAxis: [1×1 NumericRuler]
XAxisLocation: 'bottom'
XColor: [0.1500 0.1500 0.1500]
XColorMode: 'auto'
XDir: 'normal'
XGrid: 'off'
XLabel: [1×1 Text]
XLim: [0 3]
XLimMode: 'auto'
XMinorGrid: 'off'
XMinorTick: 'off'
XScale: 'linear'
XTick: [0 0.5000 1 1.5000 2 2.5000 3]
XTickLabel: {7×1 cell}
XTickLabelMode: 'auto'
XTickLabelRotation: 0
XTickMode: 'manual'
YAxis: [1×1 NumericRuler]
YAxisLocation: 'left'
YColor: [0.1500 0.1500 0.1500]
YColorMode: 'auto'
YDir: 'normal'
YGrid: 'off'
YLabel: [1×1 Text]
YLim: [0 4]
YLimMode: 'auto'
YMinorGrid: 'off'
YMinorTick: 'off'
YScale: 'linear'
YTick: [0 0.5000 1 1.5000 2 2.5000 3 3.5000 4]
YTickLabel: {9×1 cell}
YTickLabelMode: 'auto'
YTickLabelRotation: 0
YTickMode: 'auto'
ZAxis: [1×1 NumericRuler]
ZColor: [0.1500 0.1500 0.1500]
ZColorMode: 'auto'
ZDir: 'normal'
ZGrid: 'off'
ZLabel: [1×1 Text]
ZLim: [-1 1]
ZLimMode: 'auto'
ZMinorGrid: 'off'
ZMinorTick: 'off'
ZScale: 'linear'
ZTick: [-1 0 1]
ZTickLabel: ''
ZTickLabelMode: 'auto'
ZTickLabelRotation: 0
ZTickMode: 'auto'
4、用set()设置具体属性值
如设置坐标轴的的限值:
set(gca,'XLim',[0,2.5]);
set(gca,'YLim',[0,4.5]);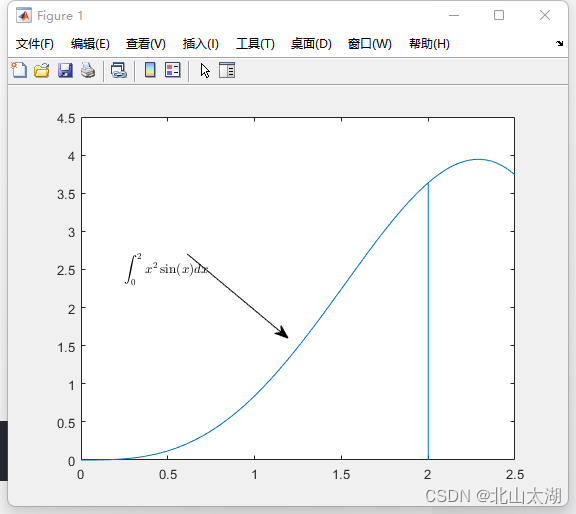
同样地,也可以设置其他属性。
将坐标值设置为符号显示:
set(gca,'XLim',[0,2*pi]);
set(gca,'XTick',0:pi/2:2*pi);
set(gca,'XTickLabel',0:90:360);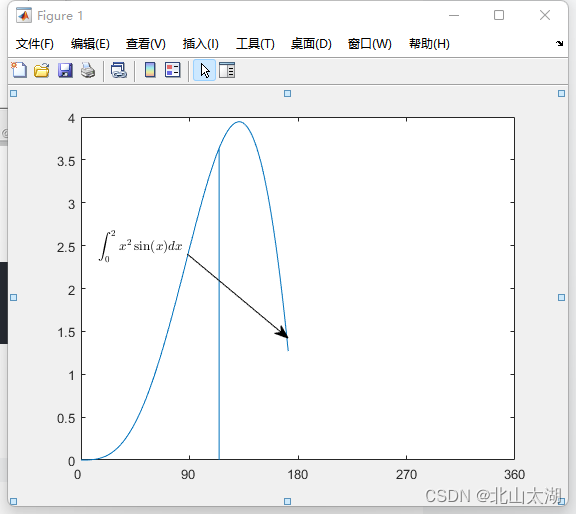
set(gca,'XTickLabel',{'0','p/2','p','3p/2','2p'});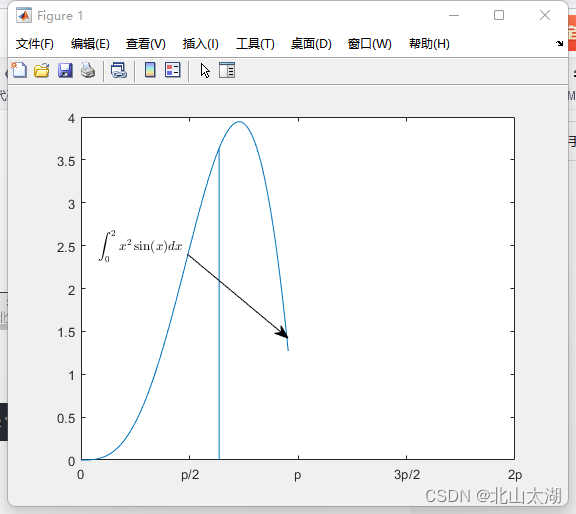
5、画多个图
当需要将曲线画在不同的图上时,可调用figure
x = -10:0.1:10;
y1 = x.^2 - 8;
y2 = exp(x);
figure,plot(x,y1);
figure,plot(x,y2);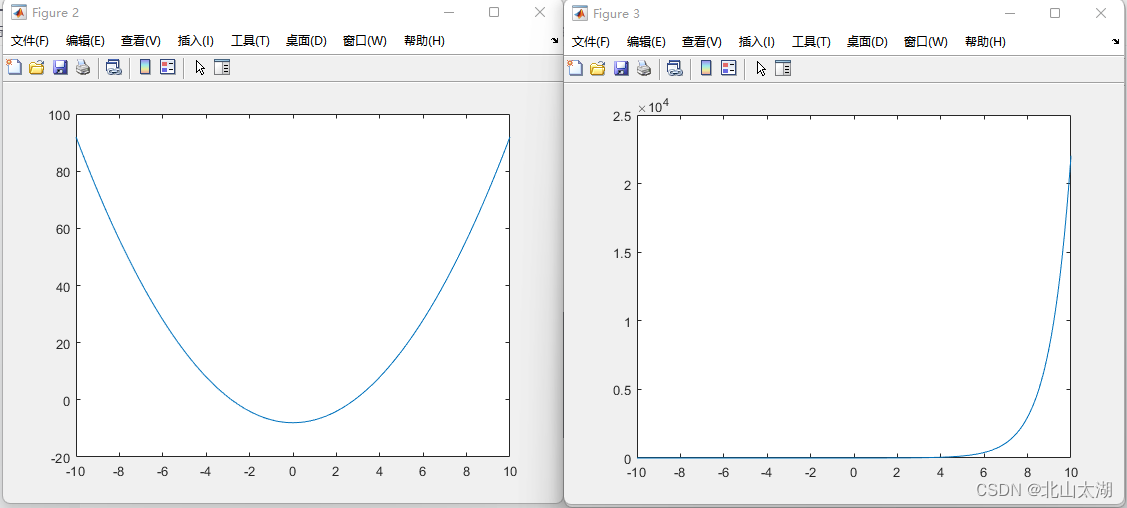
注意:当画多个图时,使用gca或gcf时,操作的时最新的图。
6、多个图画在同一张图上
使用subplot,具体参考:subplot
t = 0:0.1:2*pi;
x = 3*cos(t);
y = sin(t);
subplot(2,2,1);plot(x,y);axis normal
subplot(2,2,2);plot(x,y);axis square
subplot(2,2,3);plot(x,y);axis equal
subplot(2,2,4);plot(x,y);axis equal tight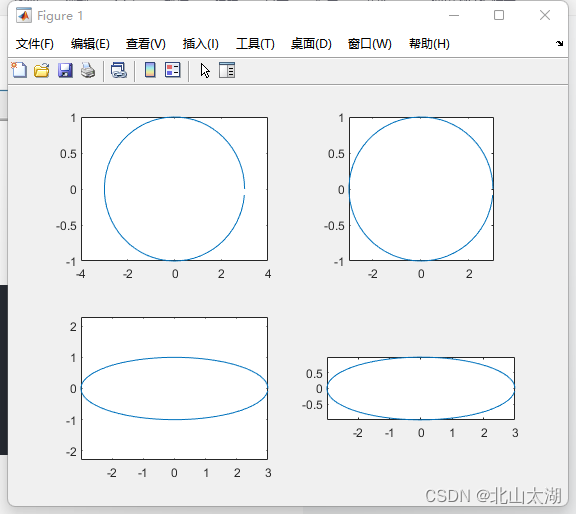
最后
以上就是追寻母鸡最近收集整理的关于【MATLAB学习笔记】二维线图绘制练习1、线图上添加文字和箭头注释 2、属性设置 3、get(gca)查看所绘图形属性4、用set()设置具体属性值 5、画多个图6、多个图画在同一张图上的全部内容,更多相关【MATLAB学习笔记】二维线图绘制练习1、线图上添加文字和箭头注释 2、属性设置 3、get(gca)查看所绘图形属性4、用set()设置具体属性值 5、画多个图6、多个图画在同一张图上内容请搜索靠谱客的其他文章。


发表评论 取消回复