clc,close all;
file_path='pictures/';
image_name1='t1.jpg';
ref = imread(strcat(file_path,image_name1));
[rows,cols,depth] = size(ref);
figure;
set (gcf,'Position',[100,100,cols,rows]);
imshow(ref,'border','tight','initialmagnification','fit');
x1=50;y1=50;width1=150;height1=150;
x2=450;y2=100;width2=150;height2=150;
x3=350;y3=350;width3=150;height3=150;
hold on
rectangle('Position',[x1,y1,width1,height1],'LineWidth',2,'EdgeColor','r');
text(x1+width1-15,y1+height1-10,'I','Color', 'y','fontsize',15);
rectangle('Position',[x2,y2,width2,height2],'LineWidth',2,'EdgeColor','r');
text(x2+width2-15,y2+height2-10,'II','Color', 'y','fontsize',15);
rectangle('Position',[x3,y3,width3,height3],'LineWidth',2,'EdgeColor','r');
text(x3+width3-15,y3+height3-10,'II','Color', 'y','fontsize',15);
frame=getframe(gcf);
result=frame2im(frame);
imwrite(result,strcat(file_path,'result_rect.bmp'));
hold off;
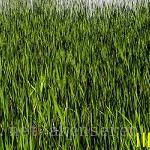
part_1 = get_rect(ref,x1,y1,width1,height1,'I');
imwrite(part_1,strcat(file_path,'part_1.bmp'));
part_2 = get_rect(ref,x2,y2,width2,height2,'II');
imwrite(part_2,strcat(file_path,'part_2.bmp'));
part_3 = get_rect(ref,x3,y3,width3,height3,'III');
imwrite(part_3,strcat(file_path,'part_3.bmp'));
function res = get_rect(ref,x,y,width,height,flag)
% 获取原图的局部矩形区域,并返回
im = ref(y:y+height-1,x:x+width-1,:);
figure;
set (gcf,'Position',[300,300,width,height]);
imshow(im,'border','tight','initialmagnification','fit');
text(width-15,height-10,flag,'Color', 'y','fontsize',15);
frame=getframe(gcf);
res=frame2im(frame);
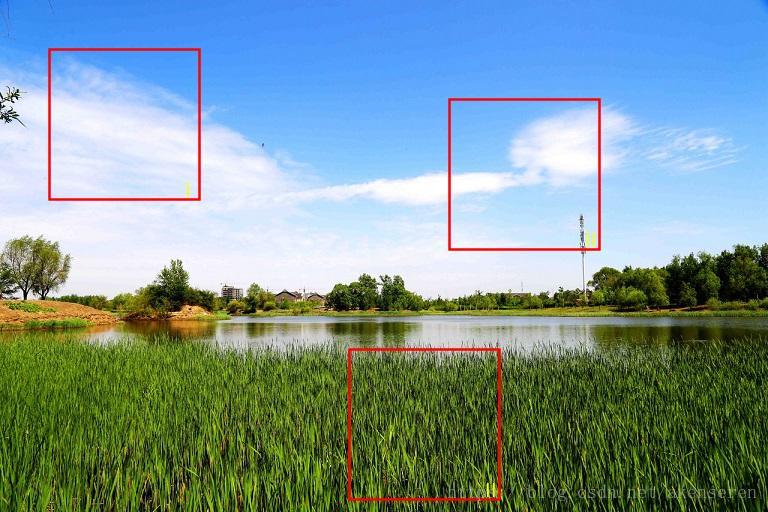
end效果如下:


最后
以上就是寂寞蜻蜓最近收集整理的关于matlab在图像上画矩形框并保存的全部内容,更多相关matlab在图像上画矩形框并保存内容请搜索靠谱客的其他文章。
本图文内容来源于网友提供,作为学习参考使用,或来自网络收集整理,版权属于原作者所有。


![matlab图片rectangle,科学网—[转载]Matlab中对图像应用plot或者rectangle后的图像保存问题 - 范凯波的博文...](https://www.shuijiaxian.com/files_image/reation/bcimg27.png)


发表评论 取消回复