Did you mean to scroll? Press the mouse scroll wheel and drag to pan. Use Preferences to switch scroll wheel mode from zooming to scrolling。
Trigger
在子系统或模型中添加触发端口
- 库:
- Simulink / Ports & Subsystems
使用 Trigger 模块,可以通过外部信号来控制子系统或模型的执行。要启用此功能,可在 Subsystem 模块中添加此模块,或在 Model 模块所引用模型的根级别添加此模块。
然后,对 Trigger 模块进行配置,以按下列方式之一执行子系统或模型:
- 当触发信号的值以您指定的方式更改时,在每个时间步执行一次。
- 当触发信号是来自 Stateflow® 图、Function-Call Generator 模块或 S-Function 模块的函数调用时,在一个时间步执行多次。
Stateflow是与Simulink一起运行的图形设计和发展工具,非常适合在Simulink中队控制和操作实际系统的逻辑进行建模。Stateflow是根据有限状态机(finite state machine)理论发展而来的,是有限状态机各个状态之间的转换。
有限状态机系统——事件驱动系统:事件、状态。
状态转换图:State Transition Diagrams,是有限状态机的基本表达方式。
状态:state,代表一个系统模型,具有相应的布尔(boolean)行为,即有active和inactive两个行为状态,可以相互转换。
转移:transitions,定义系统中的逻辑信号流向(logic flow),从inactive→active。首次转换得到的状态由default transitions表示。
同一时刻,只能有一个状态处于启动状态。Default transitions表示第一次启动状态。转移表示激活状态的不断转移。
事件(events)控制激活状态的转移,只有在事件发生后激活状态才回变为非激活状态,反之依然。
2 运行Stateflow
目标的行为取决于目标的状态和控制目标的状态变化。
用Stateflow来表示模型的控制部分:可以在MATLAB的命令窗口中输入Stateflow命令,也可以直接在Simulink中嵌入Stateflow模块。
状态工具——系统的状态就是系统运行的模态。单击状态工具,可以在图形编辑窗口绘制一个状态的示意模块,允许我们填写状态的名称和动作描述。当状态在active下就可以编写相应的执行程序,且在激活状态下可被执行。
通过迁移来改变Stateflow状态:为激活状态的变换提供路径。
状态迁移——在一个状态的边界单击,并拖动到另一个状态处释放,则可以绘制出从一个状态迁移到另外一个状态的连线。右击转移状态线,则会弹出一个窗口,其中空白迁移需要单击窗口坐标的空白迁移按钮来绘制。
通过事件来激活Stateflow:事件为模型中状态间的转化提供了驱动。事件可以在Stateflow中表示,图形中可通过事件触发器来查看事件。
event触发有三种方式,分别
- local 状态图内部发挥作用,
- Input from simulink,从simulink框图输入到statflow中,也就是stateflow外部触发事件。
- Output to simulink,是从stateflow框图输出到simulink中的,即利用stateflow定义的时间驱动或触发其他stateflow框图或子系统动作
User-definable block. Blocks can be written in C, MATLAB (Level-1), and Fortran and must conform to S-function standards. The variables t, x, u, and flag are automatically passed to the S-function by Simulink. You can specify additional parameters in the 'S-function parameters' field. If the S-function block requires additional source files for building generated code, specify the filenames in the 'S-function modules' field. Enter the filenames only; do not use extensions or full pathnames, e.g., enter 'src src1', not 'src.c src1.c'.
用户可定义块。块可以用C、MATLAB(Level-1)和Fortran编写,并且必须符合S函数标准。simulx和S被函数自动传递到simulx。您可以在“S函数参数”字段中指定其他参数。如果S-function块需要其他源文件来生成代码,请在“S-function modules”字段中指定文件名。只输入文件名;不要使用扩展名或完整路径名,例如,输入“src src1”,而不是“src.c src1.c”。
Simulink建模与仿真 使用链接模块(库链接Library Link),有一些功能模块比较稳定,做好后可以封装到库模型文件里面,以供其他模型调用。
Link to Selection in MATLAB
链接到MATLAB中的选择
link to Current Test Case
链接到当前测试用例
Link to Selection in Word
链接到Word中的选定内容
Link to Selection in Excel
链接到Excel中的选定内容
Select for Linking with Simulink
选择与Simulink链接
Add Link to Selected Object ( s )
向选定对象添加链接
Open Outgoing Links dialog
“打开传出链接”对话框
Copy URL to Clipboard
将URL复制到剪贴板
CAN Pack
CAN Pack 模块在仿真期间以指定的间隔将信号数据加载到一条报文中。
CAN Pack 模块默认有一个输入端口。模块输入的数量是动态的,取决于您为模块指定的信号数量。例如,如果您的模块有四个信号,则它有四个模块输入。
该模块有一个输出端口 CAN Msg。CAN Pack 模块接受指定的输入参数并将信号打包到一条报文中。

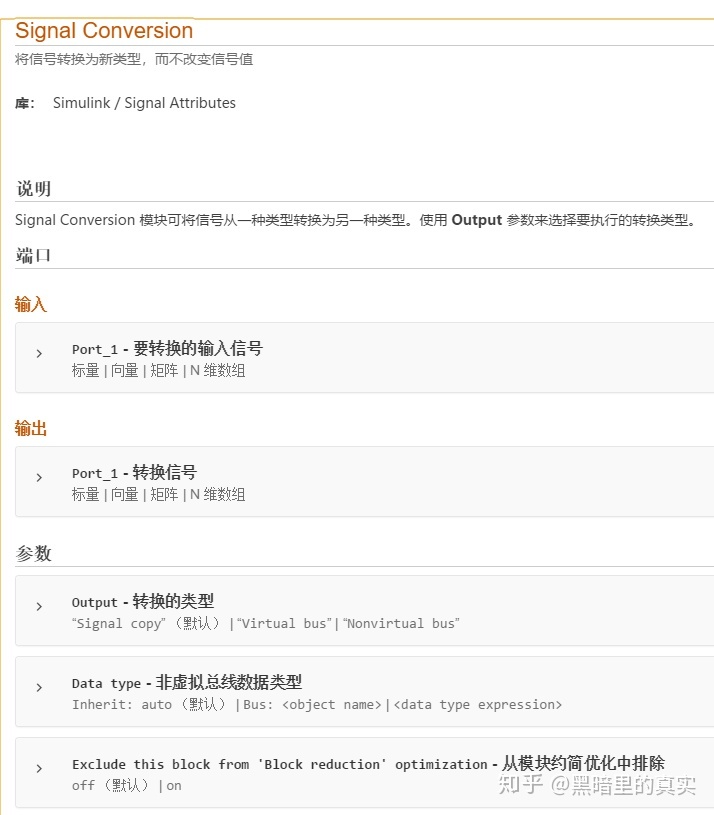
Convert a signal to a new type without altering signal values.
在不改变信号值的情况下将信号转换为新类型。
a) If the incoming signal is not a bus, the 'Signal copy' option creates a contiguous segment of memory to store a copy of an input signal. If the incoming signal is a bus, the 'Signal copy' option outputs a copy of the incoming bus.
a) 如果输入信号不是总线,“信号复制”选项会创建一个连续的内存段来存储输入信号的副本。如果输入信号是总线,“信号复制”选项输出输入总线的副本。
b) The 'Virtual bus' option converts the input bus to a virtual bus.
b) “虚拟总线”选项将输入总线转换为虚拟总线。
c) The 'Nonvirtual bus' option converts the input bus to a nonvirtual bus.
c) “非虚拟总线”选项将输入总线转换为非虚拟总线。

Use the arrow keys to trace signals. Use the "L" key to toggle port value labels on. For more information see Highlight Signal Sources and Destinations. Click on the editor to continue. Do not show this message again.
使用箭头键跟踪信号。使用“L”键打开端口值标签。有关详细信息,请参见突出显示信号源和目标。单击编辑器继续。不再显示此消息。
Unit Delay
将信号延迟一个采样期间
Unit Delay 模块按指定的采样期间保持和延迟输入。当放置于迭代子系统中时,该模块将其输入保持并延迟一个迭代。此模块相当于 z-1 离散时间运算符。此模块接受一个输入并生成一个输出。每个信号可以是标量,也可以是向量。如果输入为向量,模块会按相同的采样期间保持和延迟向量中的所有元素。
可通过 Initial conditions 参数指定第一个采样期间的模块输出。仔细选择此参数可以最大程度地减少不需要的输出行为。可通过 Sample time 参数指定样本之间的时间间隔。设置为 -1 表示模块将继承 Sample time。
Initial condition - 第一个采样期间输出0 (默认) | 标量 | 向量
Input processing - 指定基于样本或基于帧的处理“Elements as channels (sample based)” (默认) | “Columns as channels (frame based)”
Sample time (-1 for inherited) - 采样时间点之间的离散间隔-1 (默认) | scalar
Represent Operating Modes Using States
使用状态表示操作模式
Create a State
创建状态
You create states by drawing them in the editor for a particular chart (block). Follow these steps:
通过在编辑器中为特定图表(块)绘制状态来创建状态。请执行以下步骤:
Select the State tool:
选择状态工具:
Move your pointer into the drawing area.
将指针移到绘图区域。
In the drawing area, the pointer becomes state-shaped (rectangular with oval corners).
在绘图区域中,指针将变为状态形状(带椭圆角的矩形)。
Click in a particular location to create a state.
在特定位置单击以创建状态。
The created state appears with a question mark (?) label in its upper left-hand corner.
创建的状态会出现问号(?)标签在其左上角。
Click the question mark.
单击问号。
A text cursor appears in place of the question mark.
文本光标将出现在问号的位置。
Enter a name for the state and click outside of the state when finished.
输入状态的名称,完成后单击状态外部。
The label for a state specifies its required name and optional actions. See Label States for more detail.
状态的标签指定其必需的名称和可选操作。有关详细信息,请参见标签状态。
Create Substates and Superstates
创建子状态和超状态
A substate is a state that can be active only when another state, called its parent, is active. States that have substates are known as superstates. To create a substate, click the State tool and drag a new state into the state you want to be the superstate. A Stateflow® chart creates the substate in the specified parent state. You can nest states in this way to any depth. To change the parentage of a substate, drag it from its current parent in the chart and drop it in its new parent.
子状态是一种只有在另一种状态(称为其父状态)处于活动状态时才能处于活动状态的状态。有子态的状态称为超态。要创建子状态,请单击“状态”工具并将新状态拖动到要成为超级状态的状态中。Stateflow®图表在指定的父状态下创建子状态。您可以用这种方式将状态嵌套到任何深度。若要更改子状态的父级,请将其从图表中的当前父级中拖动,然后将其放到新父级中。
When to Group a State
何时将状态分组
Group a state to move all graphical objects inside a state together. When you group a state, the chart treats the state and its contents as a single graphical unit. This behavior simplifies editing of a chart. For example, moving a grouped state moves all substates and functions inside that state.
将状态分组以将状态内的所有图形对象一起移动。将状态分组时,图表将状态及其内容视为单个图形单元。此行为简化了图表的编辑。例如,移动分组状态会将所有子状态和函数移动到该状态中。
How to Group a State
如何将状态分组
You can group a state by right-clicking it and then selecting Group & Subchart > Group in the context menu. The state appears shaded in gray to indicate that it is now grouped.
通过右键单击状态,然后在上下文菜单中选择“组和子图表”>“组”,可以对状态进行分组。状态显示为灰色,表示它现在已分组。
最后
以上就是耍酷蚂蚁最近收集整理的关于matlab function_又要学习matlab了的全部内容,更多相关matlab内容请搜索靠谱客的其他文章。


发表评论 取消回复