1.Vocabulary:
- plot 绘图
- surface 曲面
- mesh 网格
- grid 格子
- illustrate 图解
- region 区域
- polygon 多边形
- peak 顶点
- tick 记号
- helix 螺旋
- magenta 洋红色
- cyan 青色
- gray 灰色
- aquamarine碧绿色
2.一般步骤
Z = peaks(20); % 1. Prepare your data.
figure(1) % 2.Select window and position plot region within window.
subplot(2,1,2)
h = surf(Z); % 3.Call 3-D graphing function.
colormap hot % 4.Set colormap and shading algorithm.
shading interp
set(h,'EdgeColor','k')
light('Position',[-2,2,20])  %5.Add lighting.
lighting phong
material([0.4,0.6,0.5,30])
set(h,'FaceColor',[0.7 0.7 0],'BackFaceLighting','lit')
view([30,25]) %6.Set viewpoint.
set(gca,'CameraViewAngleMode','Manual')
axis([5 15 5 15 -8 8]) % 7. Set axis limits and tick marks.
set(gca,'ZTickLabel','Negative||Positive')
set(gca,'PlotBoxAspectRatio',[2.5 2.5 1]) %8.Set aspect ratio.
xlabel('X Axis') %9.Annotate the graph with axis labels, legend, and text.
ylabel('Y Axis')
zlabel('Function Value')
title('Peaks')
set(gcf,'PaperPositionMode','auto')% 10.Print graph.
3.Line Plots of 3-D Data
clf;t = 0:pi/50:10*pi;
plot3(sin(t),cos(t),t, '*-b')
axis square; grid on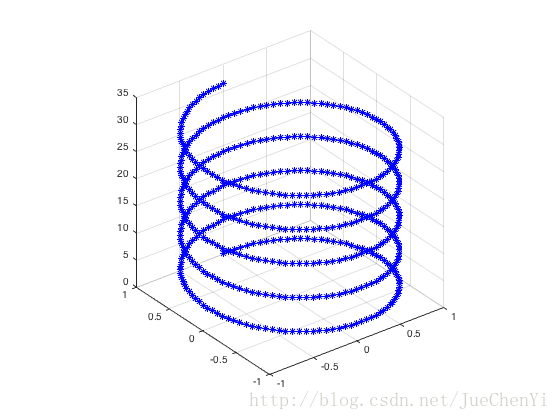
t=-20*pi:pi/50:20*pi;
comet3(sin(t), cos(t),t)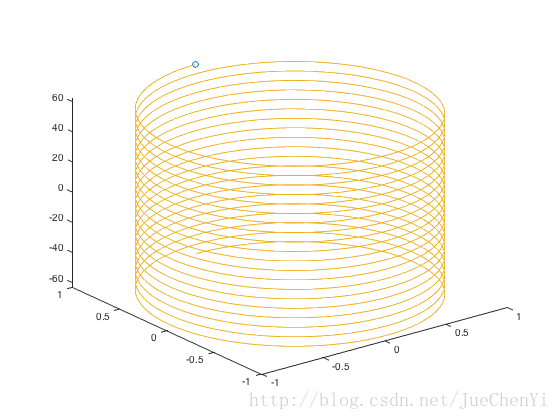
4.Mesh and Surface Plots
[X,Y] = meshgrid(-3:.125:3);
Z = peaks(X,Y);
meshc(X,Y,Z);
axis([-3 3 -3 3 -10 5])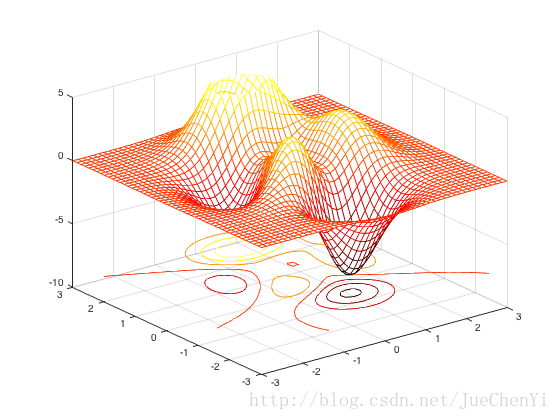
[X,Y] = meshgrid(-8:.5:8);
R = sqrt(X.^2 + Y.^2) + eps;   %prevents the divide by zero
Z = sin(R)./R;
surf(X,Y,Z)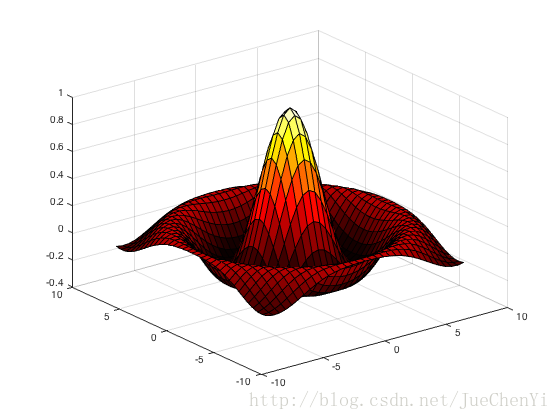
clf;
x = rand(100,1)*16 - 8;
y = rand(100,1)*16 - 8;
r = sqrt(x.^2 + y.^2) + eps;
z = sin(r)./r;
xlin = linspace(min(x),max(x),33);
ylin = linspace(min(y),max(y),33);
[X,Y] = meshgrid(xlin,ylin);    %generate a uniformly spaced grid.
Z = griddata(x,y,z,X,Y,'cubic');    %uses a triangle-based cubic interpolation to …
                                       %generate the new data.
mesh(X,Y,Z)                 % Plotting the interpolated and the nonuniform …
                               % data produces
axis tight;
hold on;
plot3(x,y,z,'.','MarkerSize',15)    %nonuniform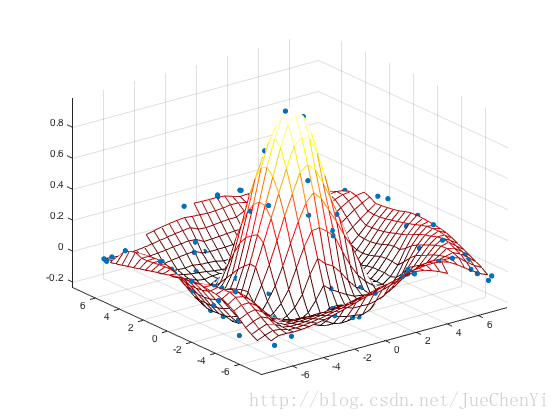
%Surface of Rotation
clf;
z=0:20;
R=(60*z).^(1/2);
[X,Y,Z]=cylinder(R,40);
mesh(X,Y,Z);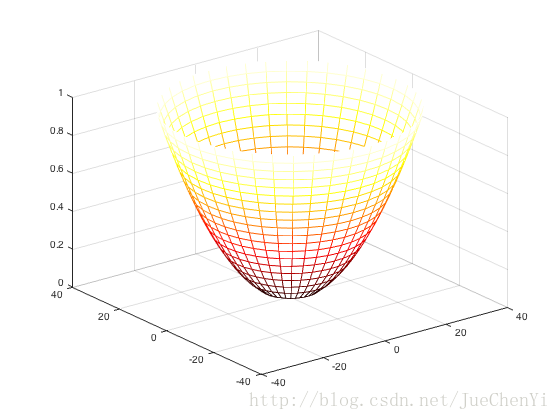
%Surface of Sphere
[X,Y,Z]=sphere;
mesh(X,Y,Z)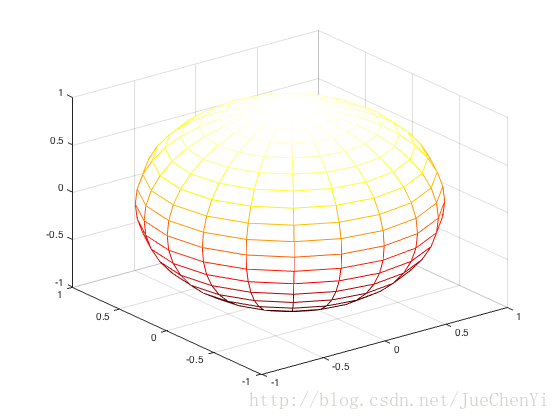
最后
以上就是饱满吐司最近收集整理的关于MATLAB Graphics -Surface 绘图的全部内容,更多相关MATLAB内容请搜索靠谱客的其他文章。
本图文内容来源于网友提供,作为学习参考使用,或来自网络收集整理,版权属于原作者所有。


发表评论 取消回复