ns-3的统计模块——Statistical Framework
ns-3的统计模块stats为用户提供了一个数据收集的统计框架,不仅可以方便用户使用,还可以提高仿真性能。
1.目标
统计框架的主要目标:
- 提供记录、计算和呈现数据和统计数据的功能,以便对网络模拟进行分析。
- 通过减少为收集数据而生成大量跟踪日志的需要,提高了模拟性能。
- 通过在线统计启用模拟控制,例如终止、模拟或重复试验。
衍生子目标和其他目标的特征:
- 与现有的NS-3跟踪系统集成,作为内部模拟引擎的基本仪器框架,例如网络堆栈、网络设备和通道。
- 允许用户使用统计框架而不需要使用跟踪系统。
- 帮助用户在多个测试中创建、汇总和分析数据。
- 支持用户创建的工具,例如特定于应用程序的事件和度量。
- 当分组不使用时,减小内存和CPU开销。
- 尽可能利用现有的分析和输出工具。该框架可能提供一些基本的统计数据,但重点是收集数据并使其可在已建立的工具中进行操作。
2.概述
统计框架包括以下功能:
- 核心框架和两个基本的数据收集器:一个计数器和一个最小/最大/平均/总观察者。
- 随着时间和数据分组的变化很容易扩展。
- 为OMNET++格式化的纯文本输出。
- 数据库输出使用SQLite,一个独立的、轻量级的、高性能的SQL引擎。
- 强制性和开放式元数据来描述工作运行。
后面要提到的一个基于概念性实验、研究了ns-3的默认ad hoc WiFi的性能的例子包括以下内容:
- 构造一个双节点的ad hoc WiFi网络,每个节点之间有一个参数化的距离。
- UDP流量源和接收器应用程序相比较,stock类稍有不同。
- 通过现有跟踪信号从ns-3核心收集数据,尤其是在数据帧上传输和WiFi MAC对象上接收的数据。
- 通过将新的跟踪信号连接到统计模块以及通过直接更新来检测自定义应用程序。记录有关发送和接收的数据包总数、传输的字节数和端到端延迟的信息。
- 一个简单的控制脚本,它在不同的距离上运行大量实验,并查询结果数据库,以使用GNUPlot生成一个图。
3.方法
该框架基于以下核心原则:
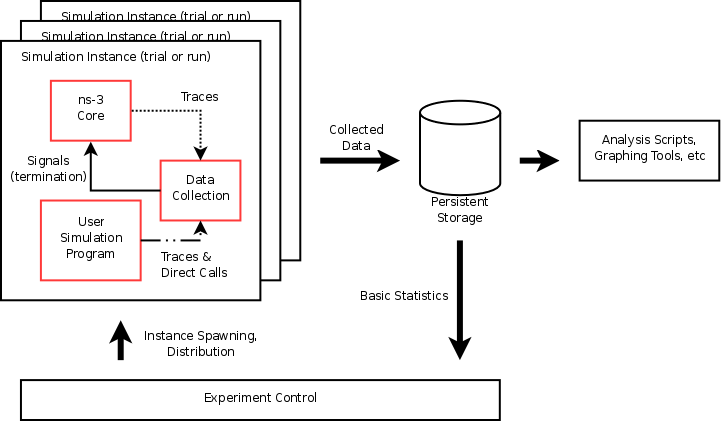
- 模拟程序的一个实例进行一次试验试验,无论是并行还是串行。
- 控制脚本执行模拟实例,根据需要更改参数。
- 使用外部脚本和现有工具收集和存储数据,以便进行绘图和分析。
- 通过将stat框架连接到现有跟踪信号,可以在ns-3核心内采取措施。
- 跟踪信号或框架的直接操作可用于仪器自定义模拟代码。
框架的基本组件及其相互作用如下图所示。

4.实例
这部分将在框架中构建一个实验,并从中生成用于分析的数据(图),同时演示结构和API。
1)问题
ns-3的无线网络设备WiFi NetDevices(使用默认设置)的(模拟)性能如何?
在模拟中,无线节点之间的距离有多远才能实现可靠的通信?”
- 假设:基于现实生活的常识,至少100m内的节点可以很好地进行交流,超过200米的通信应该是不可行的。
2)仿真程序
首先要做的是开发仿真程序。这个例子中的代码可以在examples/stats/wifi-example-sim.cc中找到。它主要有以下几个步骤。
①声明参数和使用ns3::CommandLine解析命令行。
double distance = 50.0;
string format ("omnet");
string experiment ("wifi-distance-test");
string strategy ("wifi-default");
string input;
string runID;
{
stringstream sstr;
sstr << "run-" << time (NULL);
runID = sstr.str ();
}
// Set up command line parameters used to control the experiment.
CommandLine cmd;
cmd.AddValue ("distance", "Distance apart to place nodes (in meters).",
distance);
cmd.AddValue ("format", "Format to use for data output.",
format);
cmd.AddValue ("experiment", "Identifier for experiment.",
experiment);
cmd.AddValue ("strategy", "Identifier for strategy.",
strategy);
cmd.AddValue ("run", "Identifier for run.",
runID);
cmd.Parse (argc, argv);
if (format != "omnet" && format != "db") {
NS_LOG_ERROR ("Unknown output format '" << format << "'");
return -1;
}
#ifndef STATS_HAS_SQLITE3
if (format == "db") {
NS_LOG_ERROR ("sqlite support not compiled in.");
return -1;
}
#endif
{
stringstream sstr ("");
sstr << distance;
input = sstr.str ();
}
使用ns3::NodeContainer, ns3::WiFiHelper, 和ns3::InternetStackHelper创建节点和网络堆栈。
//------------------------------------------------------------
//-- Create nodes and network stacks
//--------------------------------------------
NS_LOG_INFO ("Creating nodes.");
NodeContainer nodes;
nodes.Create (2);
NS_LOG_INFO ("Installing WiFi and Internet stack.");
WifiHelper wifi;
WifiMacHelper wifiMac;
wifiMac.SetType ("ns3::AdhocWifiMac");
YansWifiPhyHelper wifiPhy = YansWifiPhyHelper::Default ();
YansWifiChannelHelper wifiChannel = YansWifiChannelHelper::Default ();
wifiPhy.SetChannel (wifiChannel.Create ());
NetDeviceContainer nodeDevices = wifi.Install (wifiPhy, wifiMac, nodes);
InternetStackHelper internet;
internet.Install (nodes);
Ipv4AddressHelper ipAddrs;
ipAddrs.SetBase ("192.168.0.0", "255.255.255.0");
ipAddrs.Assign (nodeDevices);
②使用ns3::MobilityHelper定位节点。默认情况下,节点具有静态移动性,不会移动,但必须以给定的距离放置。有几种方法可以做到这一点;这里使用ns3::ListPositionAllocator来完成这一点,它从给定的列表中绘制位置。
//------------------------------------------------------------
//-- Setup physical layout
//--------------------------------------------
NS_LOG_INFO ("Installing static mobility; distance " << distance << " .");
MobilityHelper mobility;
Ptr<ListPositionAllocator> positionAlloc =
CreateObject<ListPositionAllocator>();
positionAlloc->Add (Vector (0.0, 0.0, 0.0));
positionAlloc->Add (Vector (0.0, distance, 0.0));
mobility.SetPositionAllocator (positionAlloc);
mobility.Install (nodes);
③安装一个流量发生器和流量接收器。可以使用stock应用程序,但这个例子包括自定义对象。它们有一个简单的行为,以给定的间隔生成给定数量的数据包。因为每个分组中只有一个需要手动安装,所以对于大量的设置,可以使用ns3::ApplicationHelper类。最后两行的Config::Set行更改数据分组的目的地,在本例中默认设置为广播broadcast。请注意,一般来说,由于速率控制和MAC重传策略的不同,WiFi对于广播和单播帧可能具有不同的性能。
//------------------------------------------------------------
//-- Create a custom traffic source and sink
//--------------------------------------------
NS_LOG_INFO ("Create traffic source & sink.");
Ptr<Node> appSource = NodeList::GetNode (0);
Ptr<Sender> sender = CreateObject<Sender>();
appSource->AddApplication (sender);
sender->SetStartTime (Seconds (1));
Ptr<Node> appSink = NodeList::GetNode (1);
Ptr<Receiver> receiver = CreateObject<Receiver>();
appSink->AddApplication (receiver);
receiver->SetStartTime (Seconds (0));
Config::Set ("/NodeList/*/ApplicationList/*/$Sender/Destination",
Ipv4AddressValue ("192.168.0.2"));
配置要收集的数据和统计信息。基本的模式是创建一个ns3::DataCollector对象来保存有关此特定运行的信息,观察员和计算器将附加到该运行以实际生成数据。更重要的是,运行信息包括标签为“experiment(实验)”、“strategy(策略)”、“input(输入)”和“run(运行)”。这些用于以后识别和轻松分组来自多个试验的数据。
- 实验是这项研究的对象,这里是研究WiFi性能和距离。
- 策略是本试验中被检查的代码或参数。在本例中,它是固定的,但明显,它可扩展为研究不同的WiFi比特率,每个比特率都是不同的策略。
- 输入是这个实验的具体问题。这里简单认为是两个节点之间的距离。
- 运行ID是这项实验的唯一标识符,识别它的信息被标记,以便在以后的分析中识别。如果没有给出运行ID,则示例程序使用当前时间生成(弱)运行ID。
这四块的元数据是必需的,但可能需要更多。可以使用ns3::DataCollector::AddMetadata() 方法将它们添加到记录中。
//------------------------------------------------------------
//-- Setup stats and data collection
//--------------------------------------------
// Create a DataCollector object to hold information about this run.
DataCollector data;
data.DescribeRun (experiment,
strategy,
input,
runID);
// Add any information we wish to record about this run.
data.AddMetadata ("author", "tjkopena");
实际的观察和计算是由ns3::DataCalculator对象创建的,其中存在几种不同的类型。这些由模拟程序创建,附加到报告或采样代码,然后随着ns3::DataCollector注册,以便稍后查询它们的输出。一种简单的观察机制是使用现有的跟踪源,例如在不更改其代码的情况下检测ns-3核心中的对象。在这里,计数器直接连接到WiFi MAC层目标节点上的一个跟踪信号。
// Create a counter to track how many frames are generated.
Updates
// are triggered by the trace signal generated by the WiFi MAC model
// object.
Here we connect the counter to the signal via the simple
// TxCallback() glue function defined above.
Ptr<CounterCalculator<uint32_t> > totalTx =
CreateObject<CounterCalculator<uint32_t> >();
totalTx->SetKey ("wifi-tx-frames");
totalTx->SetContext ("node[0]");
Config::Connect ("/NodeList/0/DeviceList/*/$ns3::WifiNetDevice/Mac/MacTx",
MakeBoundCallback (&TxCallback, totalTx));
data.AddDataCalculator (totalTx);
// This is similar, but creates a counter to track how many frames
// are received.
Instead of our own glue function, this uses a
// method of an adapter class to connect a counter directly to the
// trace signal generated by the WiFi MAC.
Ptr<PacketCounterCalculator> totalRx =
CreateObject<PacketCounterCalculator>();
totalRx->SetKey ("wifi-rx-frames");
totalRx->SetContext ("node[1]");
Config::Connect ("/NodeList/1/DeviceList/*/$ns3::WifiNetDevice/Mac/MacRx",
MakeCallback (&PacketCounterCalculator::PacketUpdate,
totalRx));
data.AddDataCalculator (totalRx);
计算器也可以直接操作。在本例中,将创建一个计数器,并将其传递给流量接收器应用程序,以便在接收数据分组时进行更新。
// This counter tracks how many packets---as opposed to frames---are
// generated.
This is connected directly to a trace signal provided
// by our Sender class.
Ptr<PacketCounterCalculator> appTx =
CreateObject<PacketCounterCalculator>();
appTx->SetKey ("sender-tx-packets");
appTx->SetContext ("node[0]");
Config::Connect ("/NodeList/0/ApplicationList/*/$Sender/Tx",
MakeCallback (&PacketCounterCalculator::PacketUpdate,
appTx));
data.AddDataCalculator (appTx);
// Here a counter for received packets is directly manipulated by
// one of the custom objects in our simulation, the Receiver
// Application.
The Receiver object is given a pointer to the
// counter and calls its Update() method whenever a packet arrives.
Ptr<CounterCalculator<> > appRx =
CreateObject<CounterCalculator<> >();
appRx->SetKey ("receiver-rx-packets");
appRx->SetContext ("node[1]");
receiver->SetCounter (appRx);
data.AddDataCalculator (appRx);
// This DataCalculator connects directly to the transmit trace
// provided by our Sender Application.
It records some basic
// statistics about the sizes of the packets received (min, max,
// avg, total # bytes), although in this scenaro they're fixed.
Ptr<PacketSizeMinMaxAvgTotalCalculator> appTxPkts =
CreateObject<PacketSizeMinMaxAvgTotalCalculator>();
appTxPkts->SetKey ("tx-pkt-size");
appTxPkts->SetContext ("node[0]");
Config::Connect ("/NodeList/0/ApplicationList/*/$Sender/Tx",
MakeCallback
(&PacketSizeMinMaxAvgTotalCalculator::PacketUpdate,
appTxPkts));
data.AddDataCalculator (appTxPkts);
// Here we directly manipulate another DataCollector tracking min,
// max, total, and average propagation delays.
Check out the Sender
// and Receiver classes to see how packets are tagged with
// timestamps to do this.
Ptr<TimeMinMaxAvgTotalCalculator> delayStat =
CreateObject<TimeMinMaxAvgTotalCalculator>();
delayStat->SetKey ("delay");
delayStat->SetContext (".");
receiver->SetDelayTracker (delayStat);
data.AddDataCalculator (delayStat);
该程序还包括其他几个例子,使用原始计算器,如ns3::countercalculator,以及那些适合观察数据包和时间的计算器。在src/test/test02 apps.(cc_h)中,它还创建了一个简单的自定义标记,用于跟踪生成的数据包的端到端延迟,并将结果报告给ns3::timeminmaxavgtotalcalculator数据计算器。
④运行仿真
//------------------------------------------------------------
//-- Run the simulation
//--------------------------------------------
NS_LOG_INFO ("Run Simulation.");
Simulator::Run ();
根据命令行参数生成OMNet++或SQLite输出。为此,将创建并配置ns3::DataOutputInterface对象。它的具体类型将决定输出格式。然后,这个对象传递给ns3::DataCollector对象以生成输出。
//------------------------------------------------------------
//-- Generate statistics output.
//--------------------------------------------
// Pick an output writer based in the requested format.
Ptr<DataOutputInterface> output = 0;
if (format == "omnet") {
NS_LOG_INFO ("Creating omnet formatted data output.");
output = CreateObject<OmnetDataOutput>();
} else if (format == "db") {
#ifdef STATS_HAS_SQLITE3
NS_LOG_INFO ("Creating sqlite formatted data output.");
output = CreateObject<SqliteDataOutput>();
#endif
} else {
NS_LOG_ERROR ("Unknown output format " << format);
}
// Finally, have that writer interrogate the DataCollector and save
// the results.
if (output != 0)
output->Output (data);
⑤释放模拟使用的内存。这应该出现在主函数的末尾。
// Free any memory here at the end of this example.
Simulator::Destroy ();
- 要详细了解示例程序、应用程序和stat框架正在做什么,可以适当地设置ns_log变量。以下内容将提供三者的丰富输出:
$export ns_log=wifidistanceexperiment:wifidistanceApps
请注意,这会极大地降低模拟的速度。
编译并简单地运行测试程序将把OMNet++格式的输出(如以下内容)附加到data-run.sca中(在ns-3.29目录下):
run run-1553764566
attr experiment "wifi-distance-test"
attr strategy "wifi-default"
attr measurement "50"
attr description ""
attr "author" "tjkopena"
scalar . measurement "50"
scalar . "author" "tjkopena"
scalar node[0] wifi-tx-frames 31
scalar node[1] wifi-rx-frames 31
scalar node[0] sender-tx-packets 30
scalar node[1] receiver-rx-packets 30
statistic node[0] tx-pkt-size
field count 30
field sum 1920
field mean 64
field min 64
field max 64
field sqrsum 122880
field stddev 0
scalar . delay-count 30
scalar . delay-total 8878312
scalar . delay-average 295943
scalar . delay-max 4629498
scalar . delay-min 108166
3)控制脚本
为了在各种输入(距离)上自动化收集数据,使用一个简单的bash脚本来执行一系列模拟。它可以在examples/stats/wifi-example-db.sh中找到。该脚本是从examples/stats/目录运行的。
该脚本运行一组距离,将结果收集到一个sqlite数据库中。在每一距离进行五次试验,以便更好地了解预期性能。整个实验只需要几十秒就可以在低端机器上运行,因为在模拟过程中没有输出,产生的流量也很小。
#!/bin/sh
DISTANCES="25 50 75 100 125 145 147 150 152 155 157 160 162 165 167 170 172 175 177 180"
TRIALS="1 2 3 4 5"
echo WiFi Experiment Example
if [ -e ../../data.db ]
then
echo "Kill data.db? (y/n)"
read ANS
if [ "$ANS" = "yes" -o "$ANS" = "y" ]
then
echo Deleting database
rm ../../data.db
fi
fi
for trial in $TRIALS
do
for distance in $DISTANCES
do
echo Trial $trial, distance $distance
../../waf --run "wifi-example-sim --format=db --distance=$distance --run=run-$distance-$trial"
done
done
4)分析和结论
一旦进行了所有的测试,脚本就使用sqlite命令行程序对数据库执行一个简单的SQL查询。查询计算与每个距离相关联的每组测试中的平均数据包丢失。它不考虑不同的策略,但数据库中存在一些信息,以便进行一些简单的扩展并执行这些扩展。然后将收集的数据传递给gnuplot进行绘图。
CMD="select exp.input,avg(100-((rx.value*100)/tx.value))
from Singletons rx, Singletons tx, Experiments exp
where rx.run = tx.run AND
rx.run = exp.run AND
rx.variable='receiver-rx-packets' AND
tx.variable='sender-tx-packets'
group by exp.input
order by abs(exp.input) ASC;"
sqlite3 -noheader data.db "$CMD" > wifi-default.data
sed -i.bak "s/|/
/" wifi-default.data
rm wifi-default.data.bak
gnuplot wifi-example.gnuplot
gnuplot脚本可以在examples/stats/wifi-example.gnuplot中找到,它只定义输出格式和图形的一些基本格式。
set terminal postscript portrait enhanced lw 2 "Helvetica" 14
set size 1.0, 0.66
#-------------------------------------------------------
set out "wifi-default.eps"
#set title "Packet Loss Over Distance"
set xlabel "Distance (m)"
set xrange [0:200]
set ylabel "% Packet Loss --- average of 5 trials per distance"
set yrange [0:110]
plot "wifi-default.data" with lines title "WiFi Defaults"
5)最终结果
运行bash脚本方法:
w@wangl:~/tarballs/ns-allinone-3.29/ns-3.29/examples/stats$ ./wifi-example-db.sh
运行完后部分截图如下:
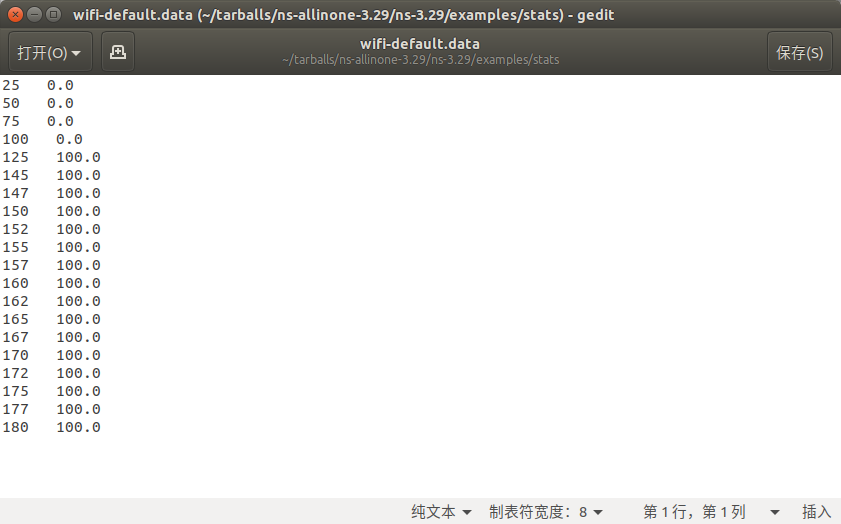
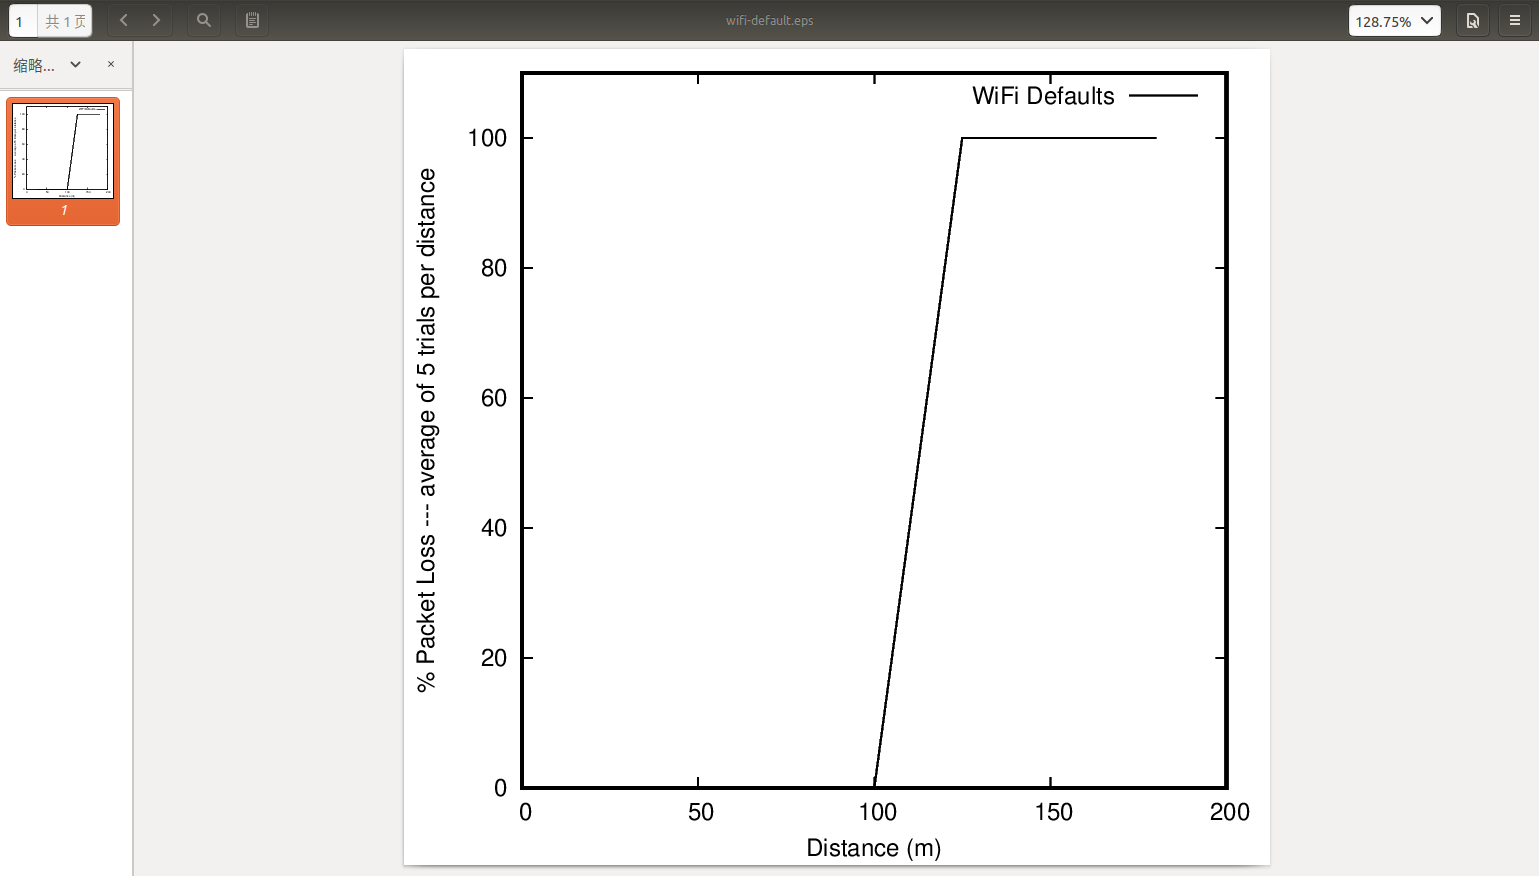
 生成了两个文件data in wifi-default.data和plot in wifi-default.eps,二者均在examples/stats/目录下。
其中,data in wifi-default.data内容如下:
 plot in wifi-default.eps内容如下:
 由此产生的图表没有提供证据证明默认WiFi模型的性能一定是不合理的,并且给至少象征性的对现实的正确性提供了一些信心。 更重要的是,这项简单的调查一直使用统计框架进行。 成功!
本文参考了ns-3Manual手册https://www.nsnam.org/docs/release/3.29/manual/html/statistics.html?highlight=stats
最后
以上就是高大睫毛最近收集整理的关于ns-3的统计模块——Statistical Framework的全部内容,更多相关ns-3的统计模块——Statistical内容请搜索靠谱客的其他文章。


发表评论 取消回复