文章目录
- 前言
- 系列文章
- 76. 交换显示图像
- 77. 矢量数据的显示
- 78. 图像分析(2)
- 79. 图像逻辑操作
- 80. 进度条的使用
- 81. MRI 数据的显示
- 82. 图像类型转换
- 83. 特殊的图像显示技术
- 84. 图像的几何操作
前言
????MATLAB是一个功能强大的软件,我们可以利用MATLAB进行绘图、算法验证、仿真实验等等。在学习MATLAB的过程中,繁多的命令与代码往往容易使我们脑容量过载????????????
????本系列将总结一些常见的MATLAB编程小技巧????????
????可能有些地方会有些错误或者是不太完善的,还请大家在评论区直接指出❤️❤️❤️
系列文章
【MATLAB100个实用小技巧】——图形应用(1-10)
【MATLAB100个实用小技巧】——图形应用(11-20)
【MATLAB100个实用小技巧】——图形应用(21-32)
【MATLAB100个实用小技巧】——界面设计(33-43)
【MATLAB100个实用小技巧】——界面设计(44-55)
【MATLAB100个实用小技巧】——界面设计(56-66)
【MATLAB100个实用小技巧】——图形处理(67-75)
【MATLAB100个实用小技巧】——图形处理(76-84)
【MATLAB100个实用小技巧】——数值分析(85-100)
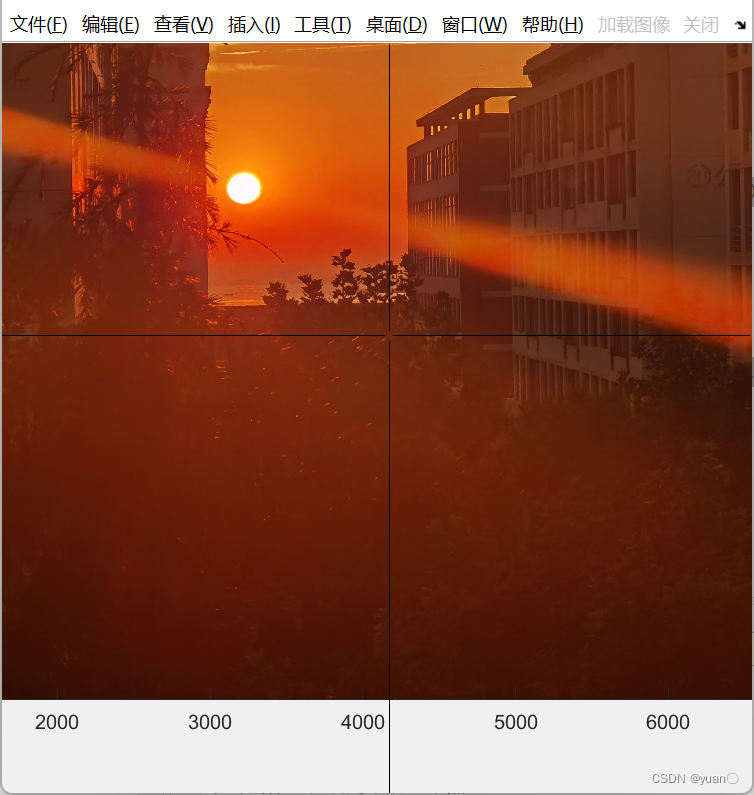
76. 交换显示图像
????代码
h0=figure('toolbar','none',...
'position',[198 56 500 500],...
'name','实例 76');
h1=axes('parent',h0,...
    'position',[0.15 0.5 0.7 0.5],...
'visible','off');
u1=uimenu('parent',h0,...
'label','加载图像',...
'Foregroundcolor',[0.753 0.753 0.753],...
'tag','u1',...
'callback',[...
'[X,map]=imread("D:opencvJPEGdataIMG_20210603_185840.jpg");,',...
'Y=imresize(X,2);,',...
'image(Y),',...
'colormap(map),',...
'axis image,',...
'camva(camva/2.5),',...
'disp(''单击鼠标左键点取需要的点''),',...
'disp(''单击鼠标右键确定最后一个点''),',...
'while 1,',...
'[x,y]=ginput(1);,',...
'if ~strcmp(get(gcf,''selectiontype''),''normal''),',...
'break,',...
'end,',...
'ct=camtarget;,',...
'dx=x-ct(1);,',...
'dy=y-ct(2);,',...
'camdolly(dx,dy,ct(3),''movetarget'',''data''),',...
'drawnow,',...
'end']);
u2=uimenu('parent',h0,...
'label','关闭',...
'Foregroundcolor',[0.753 0.753 0.753],...
'tag','u2',...
'callback','close');
????效果
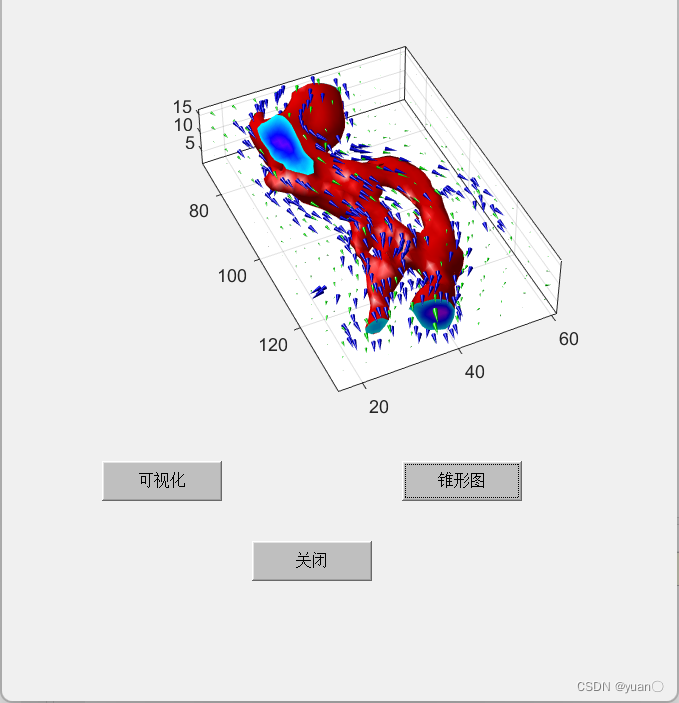
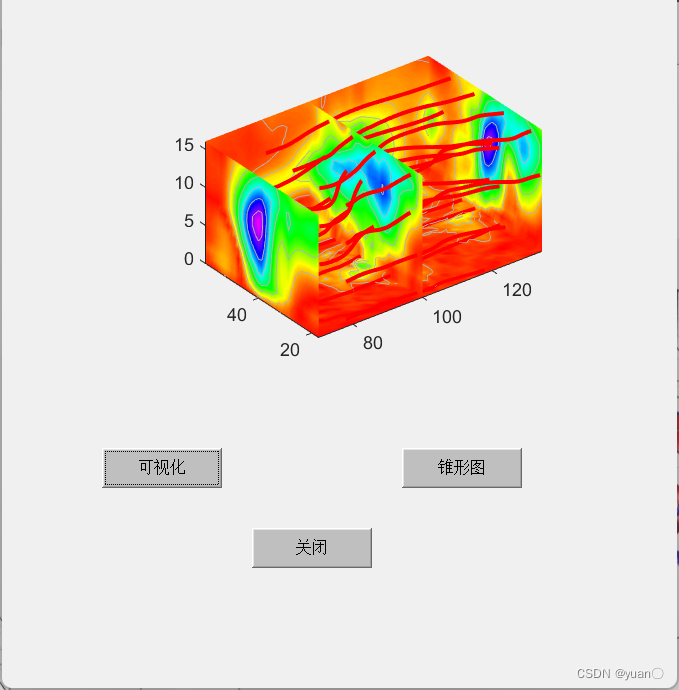
77. 矢量数据的显示
????代码
h0=figure('toolbar','none',...
'position',[198 56 450 468],...
'name','实例 77');
h1=axes('parent',h0,...
    'position',[0.3 0.45 0.5 0.5],...
'visible','off');
load wind;
b1huidiao=[...
'cla,',...
'xmin = min(x(:));,',...
'xmax = max(x(:));,',...
'ymax = max(y(:));,',...
'zmin = min(z(:));,',...
'wind_speed = sqrt(u.^2 + v.^2 + w.^2);,',...
'hsurfaces = slice(x,y,z,wind_speed,[xmin,100,xmax],ymax,zmin);,',...
'set(hsurfaces,''FaceColor'',''interp'',''EdgeColor'',''none''),',...
'hcont = contourslice(x,y,z,wind_speed,[xmin,100,xmax],ymax,zmin);,',...
'set(hcont,''EdgeColor'',[.7,.7,.7],''LineWidth'',.5),',...
'[sx,sy,sz] = meshgrid(80,20:10:50,0:5:15);,',...
'hlines = streamline(x,y,z,y,v,w,sx,sy,sz);,',...
'set(hlines,''LineWidth'',2,''Color'',''r''),',...
'view(3),',...
'daspect([2,2,1]),',...
'axis tight'];
b2huidiao=[...
'cla,',...
'wind_speed = sqrt(u.^2 + v.^2 + w.^2);,',...
'hiso = patch(isosurface(x,y,z,wind_speed,40));,',...
'isonormals(x,y,z,wind_speed,hiso),',...
'set(hiso,''FaceColor'',''red'',''EdgeColor'',''none'');,',...
'hcap = patch(isocaps(x,y,z,wind_speed,40),''FaceColor'',''interp'',''EdgeColor'',''none'');,',...
'colormap hsv,',...
'daspect([1,1,1]);,',...
'[f verts] = reducepatch(isosurface(x,y,z,wind_speed,30),0.07);,',...
'h1 = coneplot(x,y,z,u,v,w,verts(:,1),verts(:,2),verts(:,3),3);,',...
'set(h1,''FaceColor'',''blue'',''EdgeColor'',''none'');,',...
'xrange = linspace(min(x(:)),max(x(:)),10);,',...
'yrange = linspace(min(y(:)),max(y(:)),10);,',...
'zrange = 3:4:15;,',...
'[cx,cy,cz] = meshgrid(xrange,yrange,zrange);,',...
'h2 = coneplot(x,y,z,u,v,w,cx,cy,cz,2);,',...
'set(h2,''FaceColor'',''green'',''EdgeColor'',''none'');,',...
'axis tight,',...
'box on,',...
'camproj perspective,',...
'camzoom(1.25),',...
'view(65,45),',...
'camlight(-45,45),',...
'lighting phong,',...
'set(hcap,''AmbientStrength'',.6)'];
b1=uicontrol('parent',h0,...
'style','pushbutton',...
'units','points',...
'tag','b1',...
'backgroundcolor',[0.75 0.75 0.75],...
'string','可视化',...
'position',[50 100 60 20],...
'callback',b1huidiao);
b2=uicontrol('parent',h0,...
    'style','pushbutton',...
'units','points',...
'tag','b2',...
'backgroundcolor',[0.75 0.75 0.75],...
'string','锥形图',...
'position',[200 100 60 20],...
'callback',b2huidiao);
b3=uicontrol('parent',h0,...
'style','pushbutton',...
'units','points',...
'tag','b3',...
'backgroundcolor',[0.75 0.75 0.75],...
'string','关闭',...
'position',[125 60 60 20],...
'callback','close');
????效果
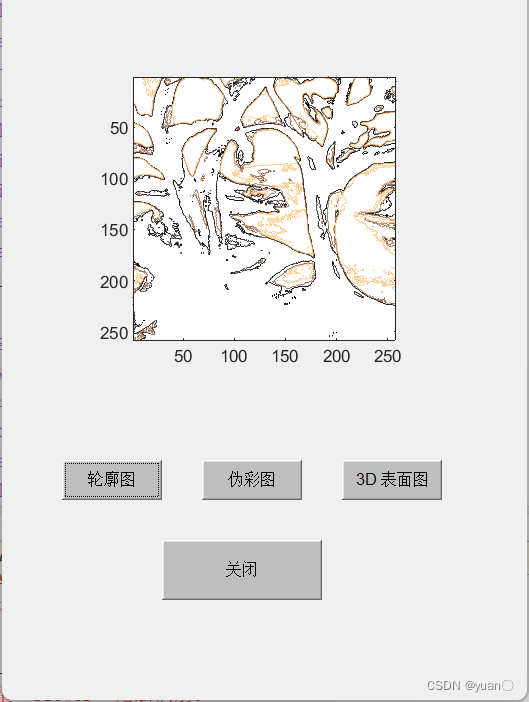
78. 图像分析(2)
????代码
h0=figure('toolbar','none',...
'position',[198 56 350 468],...
'name','实例 78');
h1=axes('parent',h0,...
    'position',[0.25 0.45 0.5 0.5],...
'visible','off');
I=imread('trees.tif');
imshow(I)
colormap(copper);
n=size(X,1);
b1=uicontrol('parent',h0,...
    'units','points',...
'tag','b1',...
'style','pushbutton',...
'string','轮廓图',...
'backgroundcolor',[0.75 0.75 0.75],...
'position',[30 100 50 20],...
'callback',[...
'cla,',...
'[X,map]=imread(''trees.tif'');,',...
'X=double(I);,',...
'X=(0.25/256)*X;,',...
'C=copper(35);,',...
'set(gca,''colororder'',C(21:35,:),''box'',''on'');,',...
'imcontour(X,3);,',...
'axis([1 n 1 n]),',...
'axis(''ij''),',...
'axis(''square'')']);
b2=uicontrol('parent',h0,...
'units','points',...
'tag','b2',...
'style','pushbutton',...
'string','伪彩图',...
'backgroundcolor',[0.75 0.75 0.75],...
'position',[100 100 50 20],...
'callback',[...
'cla,',...
'D=-del2(X);,',...
'pcolor(D),',...
'axis([1 n 1 n]),',...
'axis(''ij''),',...
'shading(''flat'')']);

b3=uicontrol('parent',h0,...
    'units','points',...
'tag','b3',...
'style','pushbutton',...
'string','3D 表面图',...
'backgroundcolor',[0.75 0.75 0.75],...
'position',[170 100 50 20],...
'callback',[...
'cla,',...
'D=-del2(X);,',...
'surf(X,D),',...
'colormap(copper),',...
'axis([1 n 1 n 0 1]),',...
'axis(''ij''),',...
'shading(''flat''),',...
'view(-20,75);']);
b4=uicontrol('parent',h0,...
    'units','points',...
'tag','b4',...
'style','pushbutton',...
'string','关闭',...
'backgroundcolor',[0.75 0.75 0.75],...
'position',[80 50 80 30],...
'callback','close');
????效果
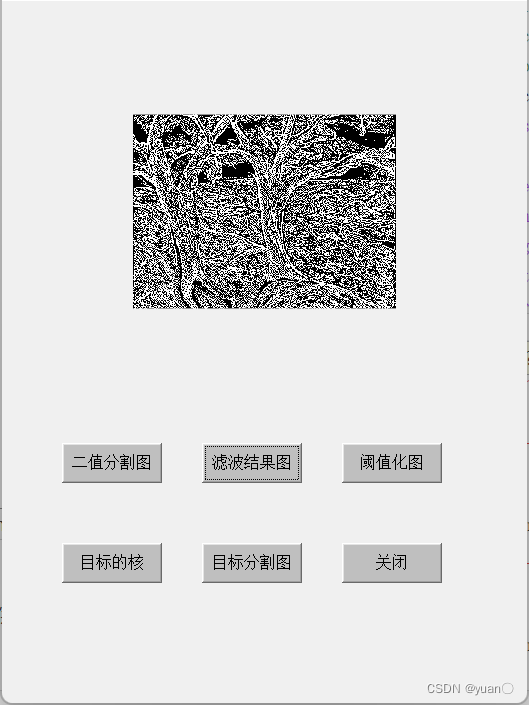
79. 图像逻辑操作
有些小问题
????代码
h0=figure('toolbar','none',...
'position',[198 56 350 468],...
'name','实例 79');
h1=axes('parent',h0,...
    'position',[0.25 0.45 0.5 0.5],...
'visible','off');
I=imread('trees.tif');
imshow(I)
k1=~(I>100);
k2=filter2(fspecial('laplacian'),I);
k3=(k2>-4)&k1;
% k4=imerode((k1,k3);
% [r,c]=find(k4);
% k5=bwselect(k1,c,r);
b1=uicontrol('parent',h0,...
'units','points',...
'tag','b1',...
'style','pushbutton',...
'string','二值分割图',...
'backgroundcolor',[0.75 0.75 0.75],...
'position',[30 110 50 20],...
'callback',[...
'cla,',...
'imshow(k1)']);
b2=uicontrol('parent',h0,...
'units','points',...
'tag','b2',...
'style','pushbutton',...
'string','滤波结果图',...
'backgroundcolor',[0.75 0.75 0.75],...
'position',[100 110 50 20],...
'callback',[...
'cla,',...
'imshow(k2)']);
b3=uicontrol('parent',h0,...
'units','points',...
'tag','b3',...
'style','pushbutton',...
'string','阈值化图',...
'backgroundcolor',[0.75 0.75 0.75],...
'position',[170 110 50 20],...
'callback',[...
'cla,',...
'imshow(k3)']);
b4=uicontrol('parent',h0,...
'units','points',...
'tag','b4',...
'style','pushbutton',...
'string','目标的核',...
'backgroundcolor',[0.75 0.75 0.75],...
'position',[30 60 50 20],...
'callback',[...
'cla,',...
'imshow(k4)']);
b5=uicontrol('parent',h0,...
'units','points',...
'tag','b5',...
'style','pushbutton',...
'string','目标分割图',...
'backgroundcolor',[0.75 0.75 0.75],...
'position',[100 60 50 20],...
'callback',[...
'cla,',...
'imshow(k5)']);
b6=uicontrol('parent',h0,...
'units','points',...
'tag','b6',...
'style','pushbutton',...
'string','关闭',...
'backgroundcolor',[0.75 0.75 0.75],...
'position',[170 60 50 20],...
'callback','close');
????效果
80. 进度条的使用
????代码
h0=figure('toolbar','none',...
'position',[198 56 350 450],...
'name','实例 80');
h1=axes('parent',h0,...
    'position',[0.25 0.45 0.6 0.5],...
'visible','off');
I=imread('trees.tif');
imshow(I);
b1=uicontrol('parent',h0,...
'units','points',...
'tag','b1',...
'style','pushbutton',...
'string','转换',...
'backgroundcolor',[0.75 0.75 0.75],...
'position',[50 80 60 25],...
'callback',[...
'handlek=waitbar(0,''initializing......'');,',...
'pause(0.5),',...
'i=1;,',...
'while	i<=100,',...
'waitbar(i/100,handlek,[num2str(i),''%finished''],handlek),',...
'i=i+1;,',...
'pause(0.05),',...
'end,',...
'pause(1.5),',...
'cla,',...
'delete(handlek),',...
'Y=rgb2ntsc(I);,',...
'J=Y(:,:,1);,',...
'imshow(J)']);
b2=uicontrol('parent',h0,...
'units','points',...
'tag','b2',...
'style','pushbutton',...
'string','关闭',...
'backgroundcolor',[0.75 0.75 0.75],...
'position',[150 80 60 25],...
'callback','close');
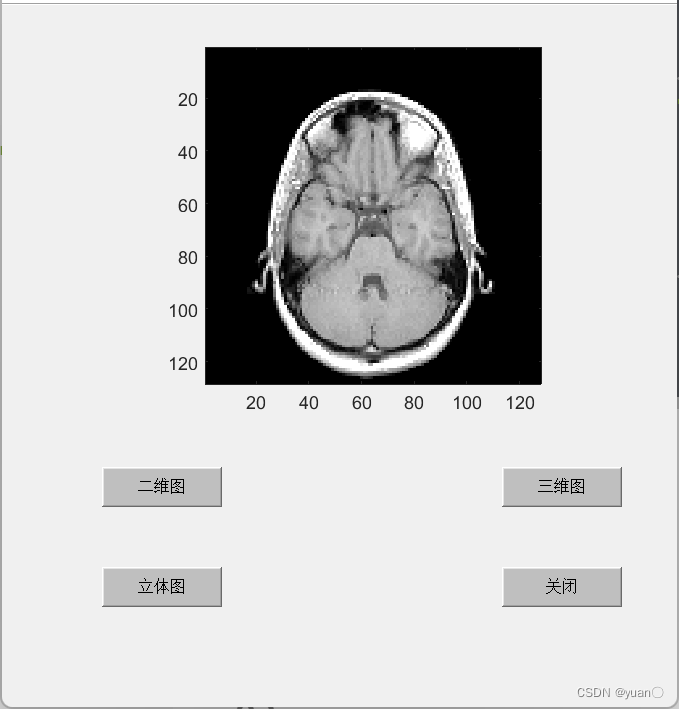
81. MRI 数据的显示
????代码
load mri;
D = squeeze(D); h0=figure('toolbar','none',...
'position',[198 56 450 468],...
'name','实例 81');
h1=axes('parent',h0,...
    'position',[0.3 0.45 0.5 0.5],...
'visible','off');
image_num = 8;
image(D(:,:,image_num));
axis image;
colormap(map);
x = xlim;
y = ylim;
b1=uicontrol('parent',h0,...
    'units','points',...
'tag','b1',...
'style','pushbutton',...
'backgroundcolor',[0.75 0.75 0.75],...
'position',[50 100 60 20],...
'string','二维图',...
'callback',[...
'cla,',...
'contourslice(D,[],[],image_num),',...
'axis ij,',...
'xlim(x),',...
'ylim(y),',...
'daspect([1,1,1]),',...
'colormap(''default'')']);
b2=uicontrol('parent',h0,...
'units','points',...
'tag','b2',...
'style','pushbutton',...
'backgroundcolor',[0.75 0.75 0.75],...
'position',[250 100 60 20],...
'string','三维图',...
'callback',[...
'cla,',...
'phandles = contourslice(D,[],[],[1,12,19,27],8);,',...
'view(3);,',...
'axis tight,',...
'set(phandles,''LineWidth'',2)']);
b3=uicontrol('parent',h0,...
    'units','points',...
'tag','b3',...
'style','pushbutton',...
'backgroundcolor',[0.75 0.75 0.75],...
'position',[50 50 60 20],...
'string','立体图',...
'callback',[...
'cla,',...
'Ds = smooth3(D);,',...
'hiso = patch(isosurface(Ds,5),''FaceColor'',[1,.75,.65],''EdgeColor'',''none'');,',...
'hcap = patch(isocaps(D,5),''FaceColor'',''interp'',''EdgeColor'',''none'');,',...
'colormap(map),',...
'view(45,30),',...
'axis tight,',...
'daspect([1,1,.4]),',...
'lightangle(45,30),',...
'lighting phong,',...
'isonormals(Ds,hiso),',...
'set(hcap,''AmbientStrength'',.6),',...
'set(hiso,''SpecularColorReflectance'',0,''SpecularExponent'',50)']);
b4=uicontrol('parent',h0,...
    'units','points',...
'tag','b4',...
'style','pushbutton',...
'backgroundcolor',[0.75 0.75 0.75],...
'position',[250 50 60 20],...
'string','关闭',...
'callback','close');
????效果
82. 图像类型转换
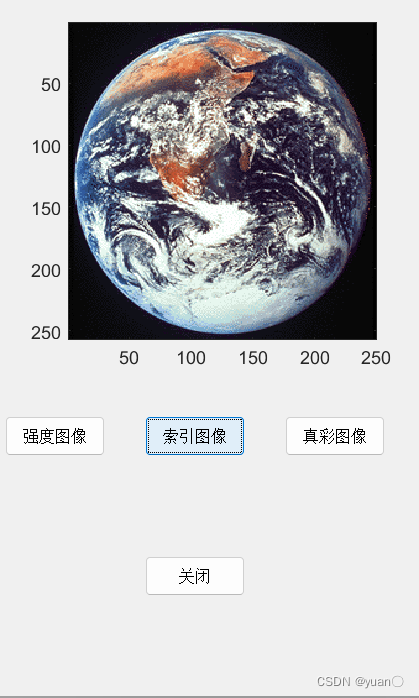
????代码
h0=figure('toolbar','none',...
'position',[198 56 350 468],...
'name','实例 82');
h1=axes('parent',h0,...
    'position',[0.2 0.45 0.5 0.5],...
'visible','off');
load earth;
clims = [10 60];
b1=uicontrol('parent',h0,...
    'units','points',...
'tag','b1',...
'style','pushbutton',...
'string','强度图像',...
'position',[30 120 50 20],...
'callback',[...
'cla,',...
'imagesc(X,clims),',...
'colormap(gray)']);
b2=uicontrol('parent',h0,...
    'units','points',...
'tag','b2',...
'style','pushbutton',...
'string','索引图像',...
'position',[100 120 50 20],...
'callback',[...
'cla,',...
'image(X),',...
'colormap(map),',...
'axis image']);
b3=uicontrol('parent',h0,...
    'units','points',...
'tag','b3',...
'style','pushbutton',...
'string','真彩图像',...
'position',[170 120 50 20],...
'callback',[...
'cla,',...
'image(X),',...
'axis image']);
b4=uicontrol('parent',h0,...
    'units','points',...
'tag','b4',...
'style','pushbutton',...
'string','关闭',...
'position',[100 50 50 20],...
'callback','close');
????效果
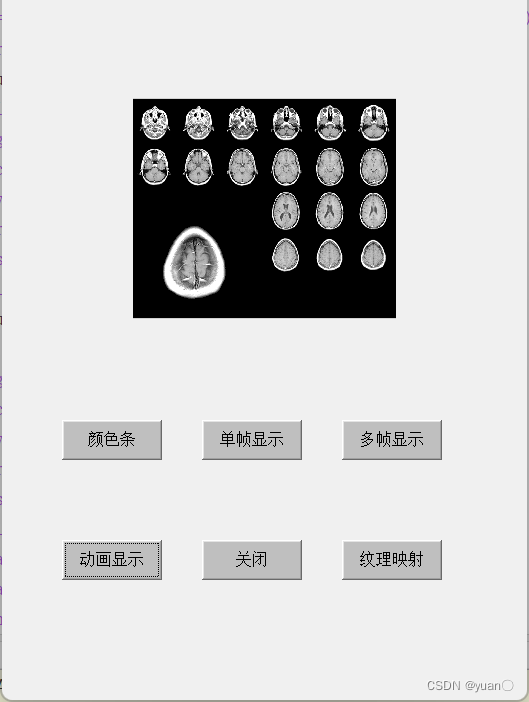
83. 特殊的图像显示技术
????代码
h0=figure('toolbar','none',...
'position',[198 56 350 468],...
'name','实例 83');
h1=axes('parent',h0,...
    'position',[0.25 0.45 0.5 0.5],...
'visible','off');
b1=uicontrol('parent',h0,...
'units','points',...
'tag','b1',...
'backgroundcolor',[0.75 0.75 0.75],...
'style','pushbutton',...
'string','颜色条',...
'position',[30 120 50 20],...
'callback',[...
'cla,',...
'I = imread("D:opencvJPEGdataIMG_20210603_185840.jpg");,',...
'imshow(I),',...
'colorbar']);
b2=uicontrol('parent',h0,...
'units','points',...
'tag','b2',...
'backgroundcolor',[0.75 0.75 0.75],...
'style','pushbutton',...
'position',[100 120 50 20],...
'string','单帧显示',...
'callback',[...
'cla,',...
'load mri,',...
'imshow(D(:,:,:,7))']);
b3=uicontrol('parent',h0,...
    'units','points',...
'tag','b3',...
'backgroundcolor',[0.75 0.75 0.75],...
'style','pushbutton',...
'string','动画显示',...
'position',[30 60 50 20],...
'callback',[...
'cla,',...
'load mri,',...
'montage(D,map),',...
'mov=immovie(D,map);,',...
'colormap(map),',...
'movie(mov)']);
b4=uicontrol('parent',h0,...
'units','points',...
'tag','b4',...
'backgroundcolor',[0.75 0.75 0.75],...
'style','pushbutton',...
'string','纹理映射',...
'position',[170 60 50 20],...
'callback',[...
'cla,',...
'[x,y,z] = cylinder;,',...
'I = imread("D:opencvJPEGdataIMG_20210603_185840.jpg");,',...
'warp(x,z,y,I);']);
b5=uicontrol('parent',h0,...
'units','points',...
'tag','b5',...
'backgroundcolor',[0.75 0.75 0.75],...
'style','pushbutton',...
'string','关闭',...
'position',[100 60 50 20],...
'callback','close');
b6=uicontrol('parent',h0,...
    'units','points',...
'tag','b6',...
'backgroundcolor',[0.75 0.75 0.75],...
'style','pushbutton',...
'string','多帧显示',...
'position',[170 120 50 20],...
'callback',[...
'cla,',...
'load mri,',...
'montage(D,map)']);
????效果
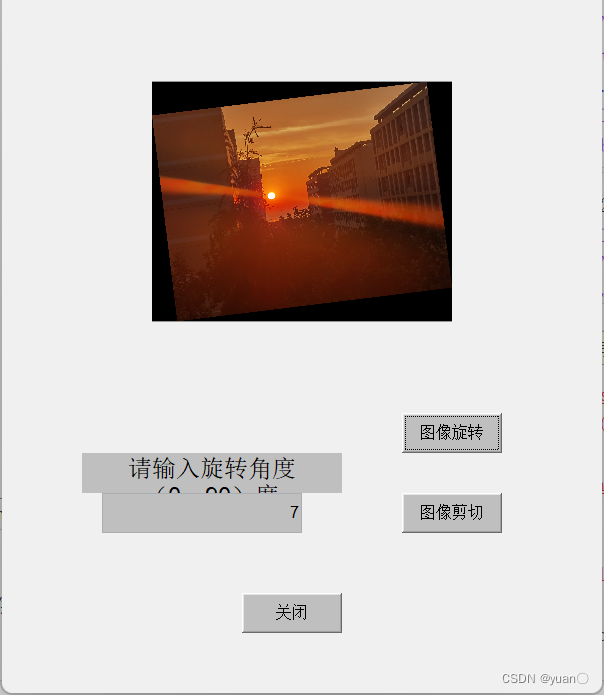
84. 图像的几何操作
????代码
h0=figure('toolbar','none',...
'position',[198 56 400 468],...
'name','实例 84');
h1=axes('parent',h0,...
    'position',[0.25 0.45 0.5 0.5],...
'visible','off');
I=imread("D:opencvJPEGdataIMG_20210603_185840.jpg",'jpg');
imshow(I);
b1=uicontrol('parent',h0,...
'units','points',...
'tag','b1',...
'backgroundcolor',[0.75 0.75 0.75],...
'style','pushbutton',...
'string','图像旋转',...
'position',[200 120 50 20],...
'callback',[...
'cla,',...
'k=str2num(get(e1,''string''));,',...
'I=imread("D:opencvJPEGdataIMG_20210603_185840.jpg",''jpg'');,',...
'J=imrotate(I,k,''bilinear'');,',...
'imshow(J)']);
b2=uicontrol('parent',h0,...
    'units','points',...
'tag','b2',...
'backgroundcolor',[0.75 0.75 0.75],...
'style','pushbutton',...
'string','图像剪切',...
'position',[200 80 50 20],...
'callback',[...
'cla,',...
'imshow D:opencvJPEGdataIMG_20210603_185840.jpg,',...
'I=imcrop;,',...
'imshow(I)']);
b3=uicontrol('parent',h0,...
'units','points',...
'tag','b3',...
'backgroundcolor',[0.75 0.75 0.75],...
'style','pushbutton',...
'string','关闭',...
'position',[120 30 50 20],...
'callback','close');
e1=uicontrol('parent',h0,...
    'units','points',...
'tag','e1',...
'backgroundcolor',[0.75 0.75 0.75],...
'style','edit',...
'horizontalalignment','right',...
'position',[50 80 100 20]);
t1=uicontrol('parent',h0,...
    'units','points',...
'tag','t1',...
'backgroundcolor',[0.75 0.75 0.75],...
'style','text',...
'string','请输入旋转角度(0~90)度',...
'fontsize',12,...
'position',[40 100 130 20]);
????效果
最后
以上就是仁爱鸭子最近收集整理的关于【MATLAB100个实用小技巧】——图形处理(76-84)前言系列文章76. 交换显示图像77. 矢量数据的显示78. 图像分析(2)79. 图像逻辑操作80. 进度条的使用81. MRI 数据的显示82. 图像类型转换83. 特殊的图像显示技术84. 图像的几何操作的全部内容,更多相关【MATLAB100个实用小技巧】——图形处理(76-84)前言系列文章76.内容请搜索靠谱客的其他文章。


发表评论 取消回复