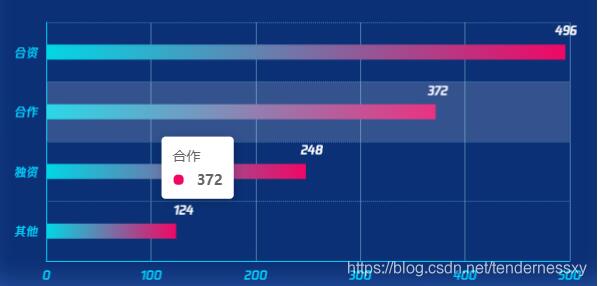
本文实例为大家分享了vue echarts实现横向柱状图的具体代码,供大家参考,具体内容如下
实现效果:
代码:
<template>
  <div class="OverYearsPompany">
    <div id="OverYearsPompanyChart" style="flex: 1; height: 368px; margin-top: -42px"></div>
  </div>
</template>
<script>
import { getProposedInvestments } from '@/api/government';
const colors = [
  ['rgba(240, 7, 100, 1)', 'rgba(0, 215, 229, 1)'],
  ['rgba(240, 7, 100, 1)', 'rgba(0, 215, 229, 1)'],
  ['rgba(240, 7, 100, 1)', 'rgba(0, 215, 229, 1)'],
  ['rgba(240, 7, 100, 1)', 'rgba(0, 215, 229, 1)'],
];
export default {
  data() {
    return {
      investmentsWayData: [],
      investmentsWayDataCount: [],
      investmentsWayDataCounts: [],
    };
  },
  mounted() {
    this.getProposedInvestments();
  },
  methods: {
    initMap() {
      var myChart = this.$echarts.init(document.getElementById('OverYearsPompanyChart'));
      const option = {
        tooltip: {
          show: true,
          trigger: 'axis',
          axisPointer: {
            type: 'shadow',
          },
        },
        xAxis: {
          type: 'value',
          axisLabel: {
            show: true,
            color: '#02CFFCFF',
            fontFamily: 'TencentSans',
          },
          axisLine: {
            show: true,
            lineStyle: {
              color: '#02CFFCFF',
            },
          },
          splitLine: {
            show: true,
            lineStyle: {
              color: 'rgba(71, 126, 171, 1)',
            },
          },
        },
        yAxis: [
          {
            type: 'category',
            inverse: true, //倒叙
            axisLabel: {
              color: '#02CFFCFF',
              fontFamily: 'TencentSans',
            },
            axisTick: {
              show: false,
            },
            axisLine: {
              show: true,
              lineStyle: {
                color: '#02CFFCFF',
              },
            },
            splitLine: {
              show: true,
              lineStyle: {
                type: 'dotted',
                color: 'rgba(71, 126, 171, 1)',
              },
            },
            data: this.investmentsWayData,
          },
        ],
        series: [
          {
            type: 'bar',
            barWidth: 15,
            label: {
              position: ['98%', -20],
              show: true,
              color: '#fff',
              fontFamily: 'TencentSans',
            },
            data: this.investmentsWayDataCount,
            itemStyle: {
              color(params) {
                const { dataIndex } = params;
                let color = {
                  type: 'linear',
                  x: 1,
                  y: 0,
                  x2: 0,
                  y2: 0,
                  colorStops: [
                    {
                      offset: 0,
                      color: colors[dataIndex] ? colors[dataIndex][0] : 'red',
                    },
                    {
                      offset: 1,
                      color: colors[dataIndex] ? colors[dataIndex][1] : 'red',
                    },
                  ],
                };
                return color;
              },
            },
          },
        ],
      };
      myChart.setOption(option);
    },
    getProposedInvestments() {
      getProposedInvestments().then((res) => {
        const { status, data } = res;
        const { proposedInvestmentsWayDis } = JSON.parse(data);
        if (status === 200) {
          // this.investmentsWayData=[{0: "合资", 1: "合作", 2: "独资", 3: "其他"}]
          this.investmentsWayData = proposedInvestmentsWayDis.map((item) => {
            return item.wayDis;
          });
          // this.investmentsWayDataCount=[{0: "496", 1: "372", 2: "248", 3: "124"}]
          this.investmentsWayDataCount = proposedInvestmentsWayDis.map((item) => {
            return item.count;
          });
          // this.investmentsWayDataCounts=[{itemStyle:
    // color:{
    // 0: "rgba(240, 7, 100, 1)"
    // 1: "rgba(0, 215, 229, 1)"}
    // value: "496"}]
          this.investmentsWayDataCounts = proposedInvestmentsWayDis.map((item, index) => {
            return {
              value: item.count,
              itemStyle: {
                color: colors[index],
              },
            };
          });
          this.initMap();
        }
      });
    },
  },
};
</script>
以上就是本文的全部内容,希望对大家的学习有所帮助,也希望大家多多支持靠谱客。
最后
以上就是洁净大象最近收集整理的关于vue echarts实现横向柱状图的全部内容,更多相关vue内容请搜索靠谱客的其他文章。
本图文内容来源于网友提供,作为学习参考使用,或来自网络收集整理,版权属于原作者所有。


发表评论 取消回复