解决页面echarts 图表 resize问题
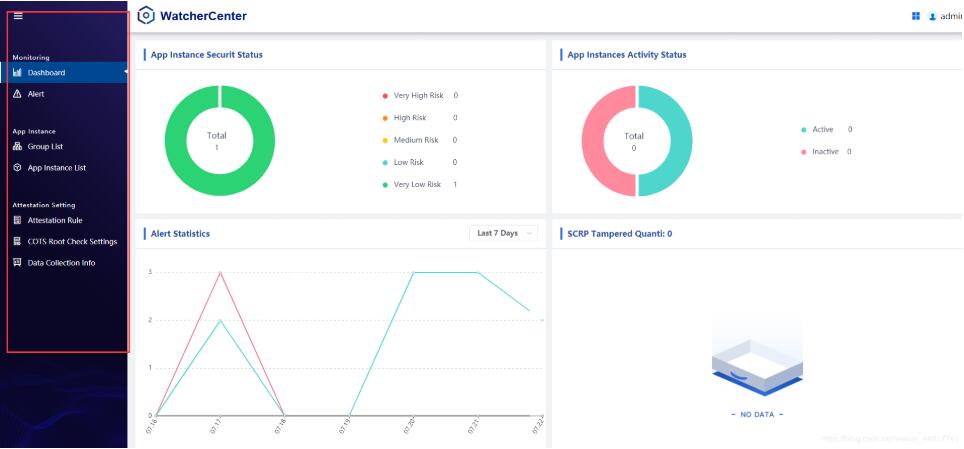
左侧的菜单栏模块是可以收缩的,点击左上角的 icon 可以收缩,但是点击左上角的icon后,右侧的echarts图并未进行对应的收缩,使用 element-resize-detector 插件能够解决问题(如何解决Vue项目中使用echarts,宽度变化导致图不能resize问题)但是会有点卡顿,所以采用原生的方法来处理,再结合windows 自带的原生 resize 事件处理 浏览器宽度高度变化,可以不使用插件来处理问题了。
<template>
 <div
 id="leftEchartPie"
 ref="leftEchartPie"
 ></div>
</template>

<script>
export default {
 props: {
 leftPieData: {
  type: Object,
  default: {}
 }
 },
 data() {
 return {
  myChart: null,
  option: null,
  observe: null,
  optionData: []
 };
 },
 watch: {
 leftPieData: {
  deep: true,
  handler(leftPieData) {
  if (leftPieData) {
   this.initChart(leftPieData);
  }
  }
 }
 },
 mounted() {
 const option = {
  title: {
  zlevel: 0,
  text: null,
  rich: {
   value: {
   color: "#3F495A",
   fontSize: 14,
   lineHeight: 16
   },
   name: {
   color: "#3F495A",
   fontSize: 14,
   lineHeight: 16
   }
  },
  top: "center",
  left: "19.3%",
  textAlign: "center",
  textStyle: {
   rich: {
   value: {
    color: "#3F495A",
    fontSize: 14,
    lineHeight: 16
   },
   name: {
    fontSize: 16,
    color: "#3F495A",
    lineHeight: 30
   }
   }
  }
  },
  tooltip: {
  show: true,
  trigger: "item",
  formatter: "{a} <br/>{b}: {c} ({d}%)"
  },
  legend: {},
  series: [
  {
   name: "Security Status",
   type: "pie",
   center: ["20%", "50%"],
   radius: ["80%", "45%"],
   itemStyle: {
   borderWidth: 6,
   borderColor: "#fff"
   },
   hoverAnimation: false,
   avoidLabelOverlap: false,
   label: {
   show: false,
   position: "center"
   },
   emphasis: {
   label: {
    show: false,
    fontSize: "30",
    fontWeight: "bold"
   }
   },
   labelLine: {
   show: false
   },
   data: []
  }
  ]
 };
 this.option = option;
 var dom = document.getElementById("leftEchartPie");
 var myChart = this.echarts.init(dom);
 this.myChart = myChart;

	// 使用浏览器原生的MutationObserver来处理
 const observer = new MutationObserver(() => {
  setTimeout(this.myChart.resize, 201);
 });
 const config = { attributes: true, childList: true, subtree: false };
 this.observe = observer;
 observer.observe(document.getElementsByClassName("spoc-menu")[0], config);
 	// 处理浏览器窗口大小变化触发resize
 window.addEventListener("resize", this.resizeEchart, true);
 },
 beforeDestroy() {
 this.observe.dis;
 window.removeEventListener("resize", this.resizeEchart, true);
 },
 methods: {
 resizeEchart() {
  this.myChart.resize();
 },
 initChart(leftPieData) {
  this.option.text = [
  "{name|Total}",
  "{value|" + leftPieData.totalNum + "}"
  ].join("n");
  this.option.legend.data = [
  `Very High Risk`,
  `High Risk`,
  `Medium Risk`,
  `Low Risk`,
  `Very Low Risk`
  ];

  this.option.series[0].data = [
  {
   value: this.leftPieData.veryHighRiskNum,
   name: `Very High Risk`,
   itemStyle: {
   color: "#FF4D4F"
   }
  },
  {
   value: this.leftPieData.highRiskNum,
   name: `High Risk`,
   itemStyle: {
   color: "#FA9314"
   }
  },
  {
   value: this.leftPieData.mediumRiskNum,
   name: `Medium Risk`,
   itemStyle: {
   color: "#FACB14"
   }
  },
  {
   value: this.leftPieData.lowRiskNum,
   name: `Low Risk`,
   itemStyle: {
   color: "#4ED6CC"
   }
  },
  {
   value: this.leftPieData.veryLowNum,
   name: `Very Low Risk`,
   itemStyle: {
   color: "#2BD374"
   }
  }
  ];

  this.optionData = this.option.series[0].data;
  const optionData = this.optionData;
  this.option.legend = {
  textStyle: {
   fontSize: 14,
   color: "#3F495A"
  },
  orient: "vertical",
  left: "60%",
  itemGap: 30, // 字高
  top: "middle",
  icon: "circle",
  itemHeight: 10, //改变圆圈大小
  // data: [],
  formatter(params) {
   if (optionData.length) {
   switch (params) {
    case "Very High Risk":
    return params + "  " + optionData[0].value;
    break;
    case "High Risk":
    return params + "    " + optionData[1].value;
    break;
    case "Medium Risk":
    return params + "  " + optionData[2].value;
    break;
    case "Low Risk":
    return params + "    " + optionData[3].value;
    break;
    case "Very Low Risk":
    return params + "  " + optionData[4].value;
    break;
    default:
    return "";
   }
   }
  }
  };
  // 绘制图表
  this.myChart.setOption(this.option);
 }
 }
};
</script>

<style>
#leftEchartPie {
 width: 100%;
 height: calc(100% - 60px);
}
</style>
核心代码
 // 使用浏览器原生的MutationObserver来处理
 const observer = new MutationObserver(() => {
  setTimeout(this.myChart.resize, 201);
 });
 const config = { attributes: true, childList: true, subtree: false };
 this.observe = observer;
 observer.observe(document.getElementsByClassName("spoc-menu")[0], config);
 // 处理浏览器窗口大小变化触发resize
 window.addEventListener("resize", this.resizeEchart, true);
关于MutationObserver的使用 参考
最后注意需要beforeDestroy 里面销毁掉 监听的时间和 MutationObserver 监听的事件,避免事件一直在页面里面,消耗内存。
最后开发完后,对比了下和之前使用的插件,原生js处理的体验比插件反应快,插件给人的感觉盾一点
ok 这就是关于 vue 结合原生js 解决echarts resize问题 的开发心得啦 ~希望能给大家一个参考,也希望大家多多支持靠谱客。
最后
以上就是爱笑楼房最近收集整理的关于关于vue 结合原生js 解决echarts resize问题的全部内容,更多相关关于vue内容请搜索靠谱客的其他文章。
本图文内容来源于网友提供,作为学习参考使用,或来自网络收集整理,版权属于原作者所有。


发表评论 取消回复