今天在造dropout模拟数据集的时候,发现了一个问题,Rtsne的结果和skelarn中的tsne画图结果非常不同,让我感到很好奇,到底是什么原因导致这个的
%load_ext rpy2.ipython
%%R -o counts -o truecounts -o geneinfo -o cellinfo

# make sure that splatter is installed: https://github.com/Oshlack/splatter
suppressPackageStartupMessages({
  library(splatter)
  library(Rtsne)
  library(ggplot2)
  library(repr)
})


simulate <- function(nGroups=2, nGenes=200, batchCells=2000, dropout=3)
{
    if (nGroups > 1) method <- 'groups'
    else             method <- 'single'

    group.prob <- rep(1, nGroups) / nGroups

    # new splatter requires dropout.type
    if ('dropout.type' %in% slotNames(newSplatParams())) {
        if (dropout)
            dropout.type <- 'experiment'
        else
            dropout.type <- 'none'

        sim <- splatSimulate(group.prob=group.prob, nGenes=nGenes, batchCells=batchCells,
                             dropout.type=dropout.type, method=method,
                             seed=42, dropout.shape=-1, dropout.mid=dropout)

    } else {
        sim <- splatSimulate(group.prob=group.prob, nGenes=nGenes, batchCells=batchCells,
                             dropout.present=!dropout, method=method,
                             seed=42, dropout.shape=-1, dropout.mid=dropout)
    }

    counts     <- as.data.frame(t(counts(sim)))
    truecounts <- as.data.frame(t(assays(sim)$TrueCounts))

    dropout    <- assays(sim)$Dropout
    mode(dropout) <- 'integer'

    cellinfo   <- as.data.frame(colData(sim))
    geneinfo   <- as.data.frame(rowData(sim))

    list(counts=counts,
         cellinfo=cellinfo,
         geneinfo=geneinfo,
         truecounts=truecounts)
}
sim <- simulate(nGroups=6, dropout=1) ## 因为这个地方的dropout从1变成了3,导致两者不一致

counts <- sim$counts
geneinfo <- sim$geneinfo
cellinfo <- sim$cellinfo
truecounts <- sim$truecounts

X <- t(counts) ## counts with dropout
Y <- as.integer(substring(cellinfo$Group,6))
Y <- Y-1

X.normalized <- apply(X, 2, function(z) z/sum(z)) ## 我大概知道这个图的原因了,因为sc.ppnor
X.normalized <- log(X.normalized + 1)
tsne.X <- Rtsne(t(X.normalized), max_iter = 1000)

tsne_plot.X <- data.frame(`x-tsne` = tsne.X$Y[,1], `y-tsne` = tsne.X$Y[,2],
                        truelabel = Y, check.names = F)
tsne_plot.X$truelabel <- factor(tsne_plot.X$truelabel, levels = c(0:max(Y)))

ggplot(tsne_plot.X) + geom_point(aes(x=`x-tsne`, y=`y-tsne`, color=truelabel), size=0.5) +
          labs(color='true label') +
          ggtitle("Simulated data") +
          theme_bw() +
          theme(panel.grid.major = element_blank(), panel.grid.minor = element_blank(),
                legend.key = element_rect(fill = 'white', colour = 'white'), legend.position="none",
                axis.title.y=element_blank(), axis.title.x=element_blank())

# sim <- simulate()

# counts <- sim$counts
# geneinfo <- sim$geneinfo
# cellinfo <- sim$cellinfo
# truecounts <- sim$truecounts
## 我也可以在R中显示的
结果如下
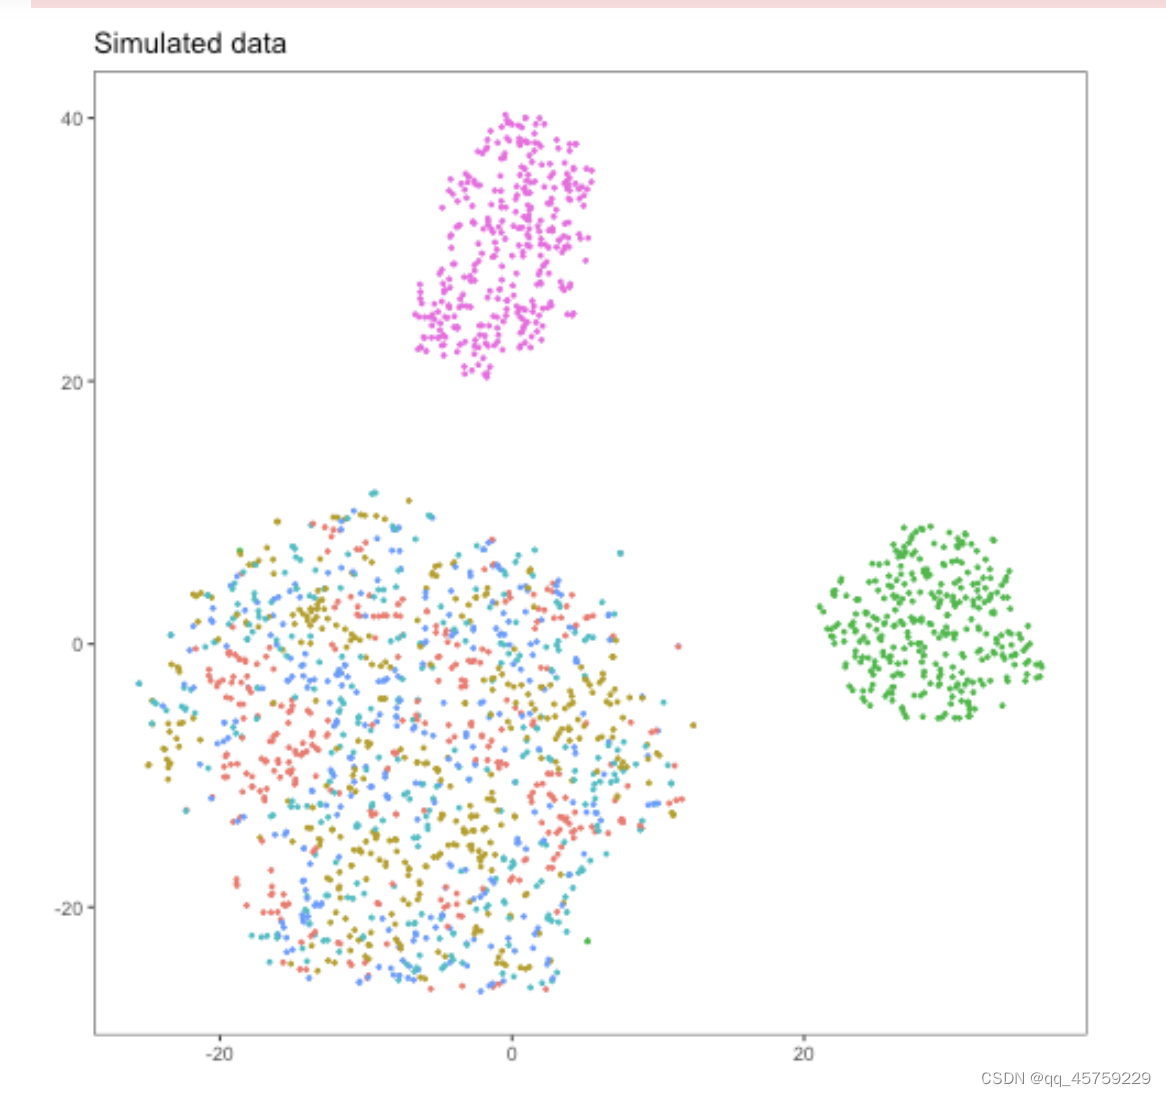
visulize in python
import scanpy as sc
adata = sc.AnnData(counts.values, obs=cellinfo, var=geneinfo)
adata.obs_names = cellinfo.Cell
adata.var_names = geneinfo.Gene

adata.obs.index = list(adata.obs.index) ## add this line to avoid error
adata.var.index = list(adata.var.index) ## add this line to avoid error


#sc.pp.filter_genes(adata, min_counts=1)


adata_true = sc.AnnData(truecounts.values, obs=cellinfo, var=geneinfo)
adata_true.obs_names = cellinfo.Cell
adata_true.var_names = geneinfo.Gene
adata_true.obs.index = list(adata_true.obs.index) ## add this line to avoid error
adata_true.var.index = list(adata_true.var.index) ## add this line to avoid error

adata_true = adata_true[:, adata.var_names].copy()

sc.pp.normalize_per_cell(adata)
sc.pp.normalize_per_cell(adata_true)

sc.pp.log1p(adata)
sc.pp.log1p(adata_true)

sc.pp.pca(adata)
sc.pp.pca(adata_true)

sc.tl.tsne(adata)
sc.tl.tsne(adata_true)

sc.pp.neighbors(adata)
sc.pp.neighbors(adata_true)
sc.pl.tsne(adata,color=["Group"],title="dropout_tsne")
sc.pl.tsne(adata_true,color=["Group"],title="true_tsne")

sc.tl.umap(adata)
sc.tl.umap(adata_true)
sc.pl.umap(adata,color=["Group"],title="dropout_umap")
sc.pl.umap(adata_true,color=["Group"],title="true_out")
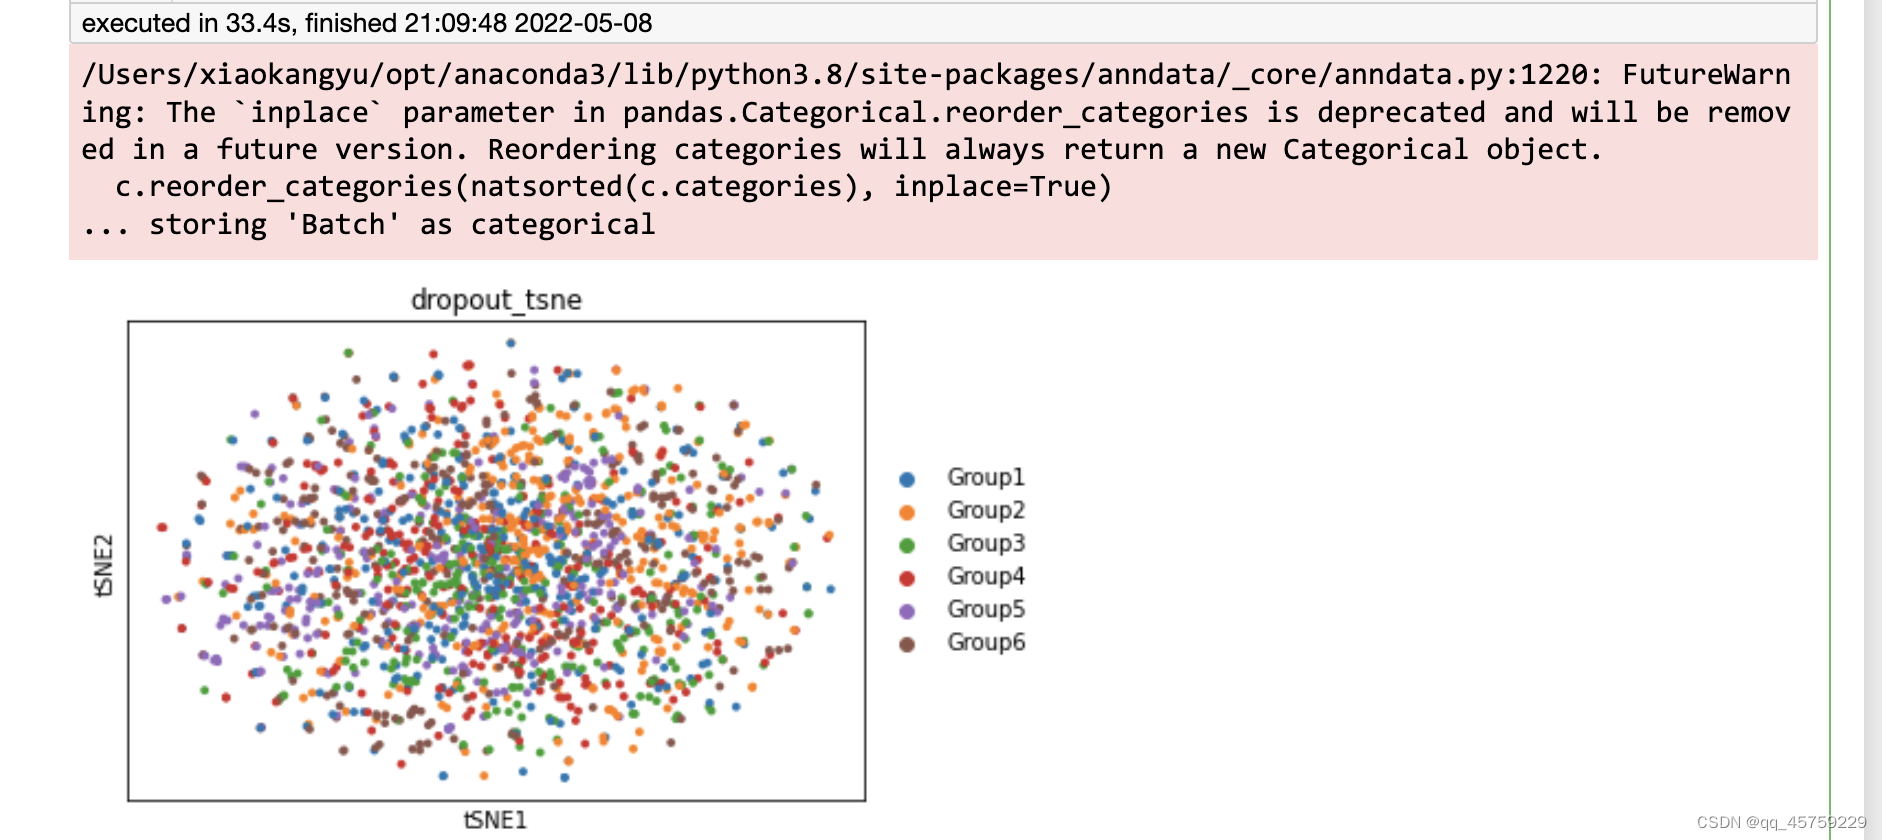
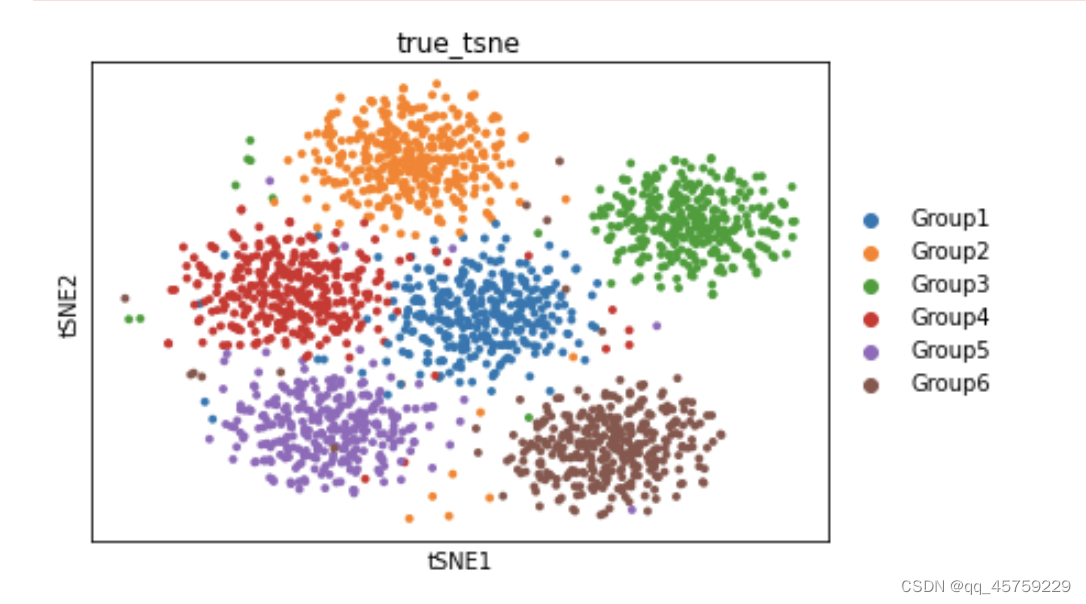
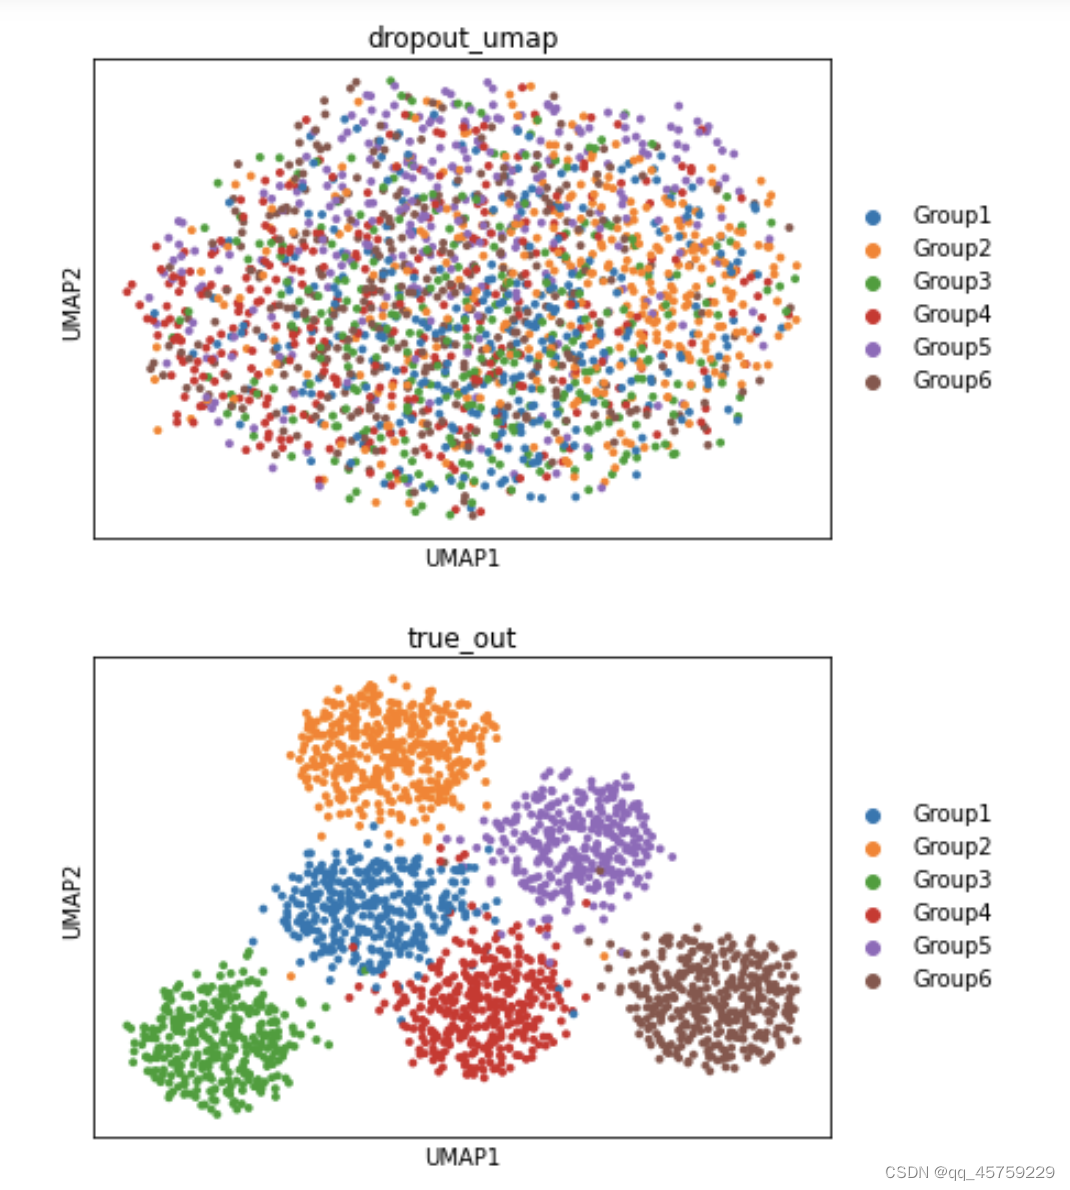 可以看到这结果的tsne看起来是不一样的,这个结果很奇怪,Rtsne有两个cluster竟然显示出来了,而python中的tsne直接混合了数据
我首先排除了可能是Rtsne的原因
# X_raw=adata.X.copy()
# Y=adata.obs["Group"].cat.codes.values

X_raw=adata_true.X.copy()
Y=adata_true.obs["Group"].cat.codes.values
%%R -i X_raw -i Y
tsne.X <- Rtsne(X_raw, max_iter = 1000)

tsne_plot.X <- data.frame(`x-tsne` = tsne.X$Y[,1], `y-tsne` = tsne.X$Y[,2],
                        truelabel = Y, check.names = F)
tsne_plot.X$truelabel <- factor(tsne_plot.X$truelabel, levels = c(0:max(Y)))

ggplot(tsne_plot.X) + geom_point(aes(x=`x-tsne`, y=`y-tsne`, color=truelabel), size=0.5) +
          labs(color='true label') +
          ggtitle("Simulated data") +
          theme_bw() +
          theme(panel.grid.major = element_blank(), panel.grid.minor = element_blank(),
                legend.key = element_rect(fill = 'white', colour = 'white'), legend.position="none",
                axis.title.y=element_blank(), axis.title.x=element_blank())
结果如下
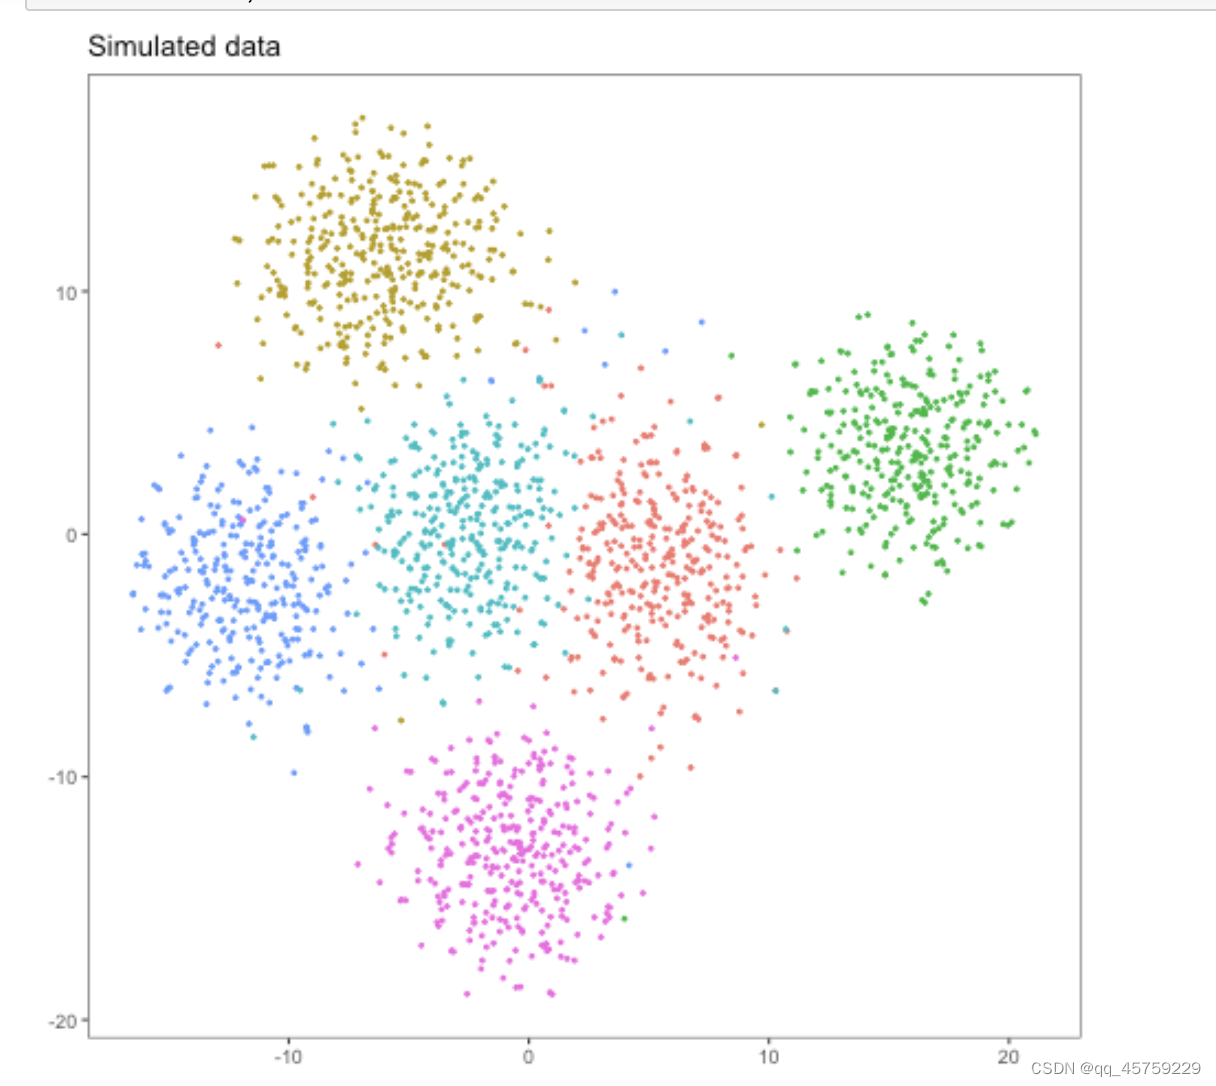 所以唯一的问题,就是这个预处理的过程
R的预处理流程如下
 而scanpy的处理流程如下
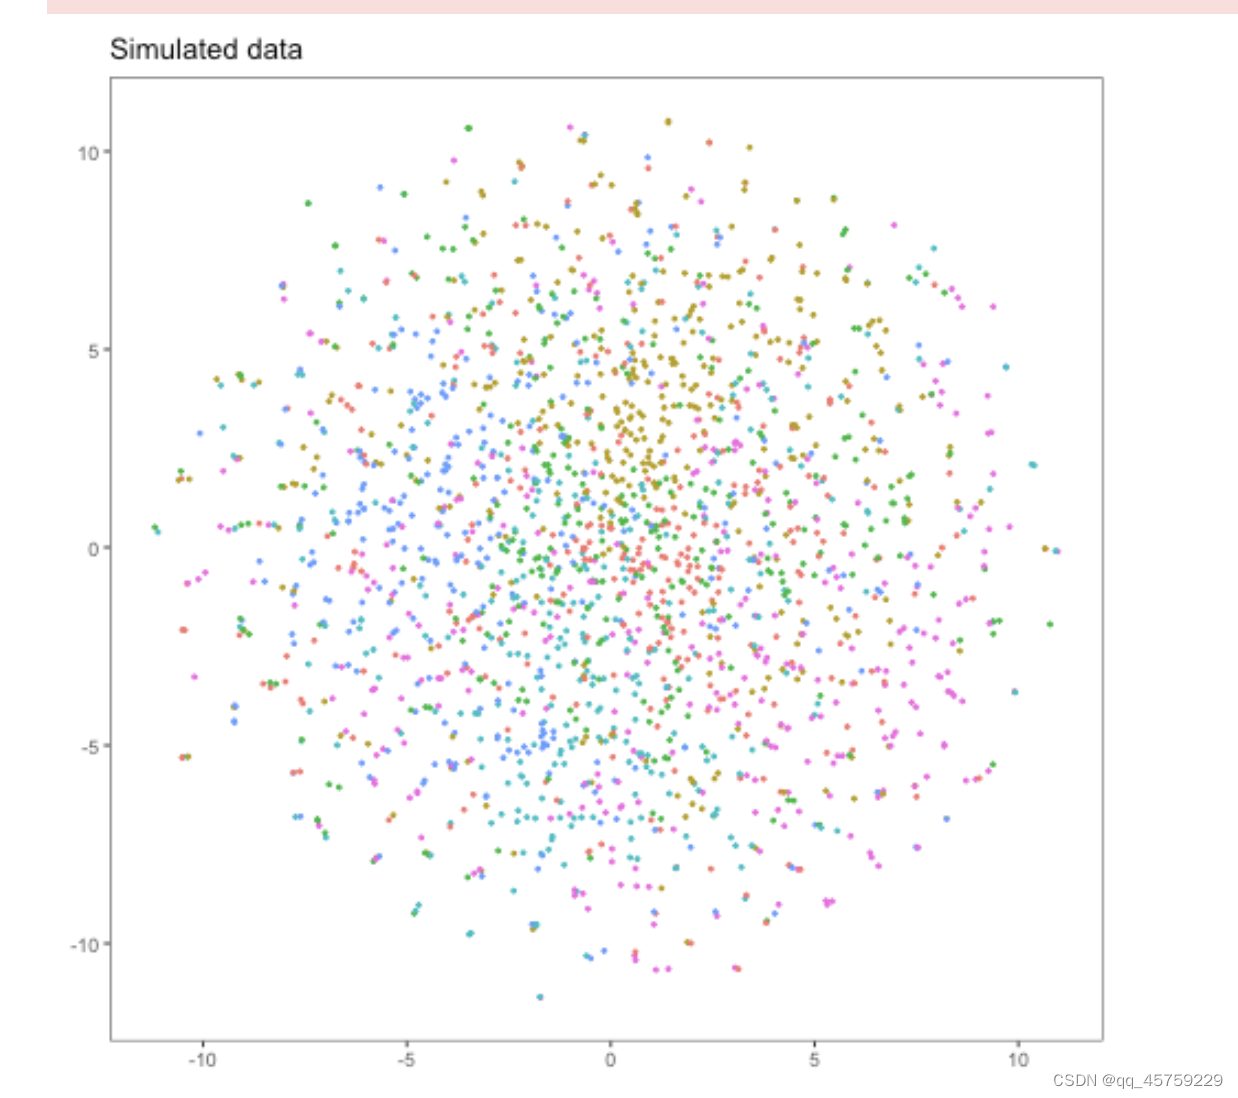
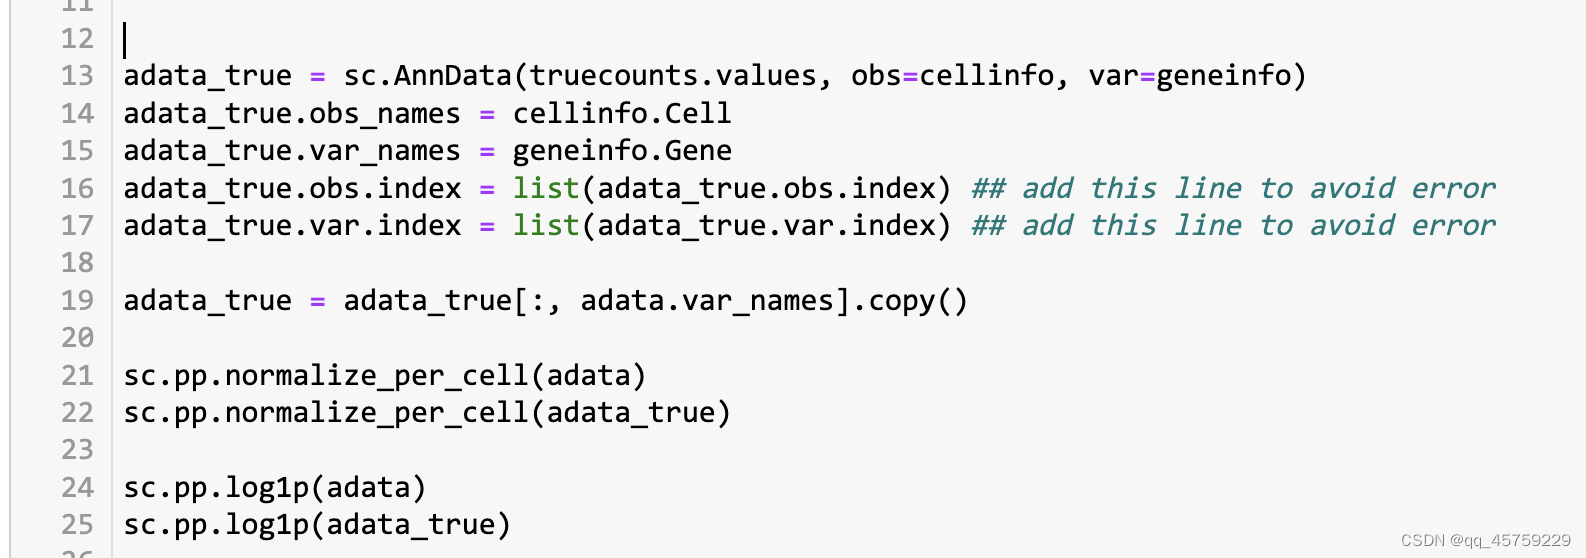 根据我前几天刚看的sc.pp.normal_per_cell的实现原理,里面涉及到中位数,但是R中的标准化并没有,也就是说scanpy得到的结果可能会更稳定,这也就是结果的原因
我验证了这个结果,我在R中实现了中位数的标准化,
%%R -o counts -o truecounts -o geneinfo -o cellinfo

# make sure that splatter is installed: https://github.com/Oshlack/splatter
suppressPackageStartupMessages({
  library(splatter)
  library(Rtsne)
  library(ggplot2)
  library(repr)
})


simulate <- function(nGroups=2, nGenes=200, batchCells=2000, dropout=3)
{
    if (nGroups > 1) method <- 'groups'
    else             method <- 'single'

    group.prob <- rep(1, nGroups) / nGroups

    # new splatter requires dropout.type
    if ('dropout.type' %in% slotNames(newSplatParams())) {
        if (dropout)
            dropout.type <- 'experiment'
        else
            dropout.type <- 'none'

        sim <- splatSimulate(group.prob=group.prob, nGenes=nGenes, batchCells=batchCells,
                             dropout.type=dropout.type, method=method,
                             seed=42, dropout.shape=-1, dropout.mid=dropout)

    } else {
        sim <- splatSimulate(group.prob=group.prob, nGenes=nGenes, batchCells=batchCells,
                             dropout.present=!dropout, method=method,
                             seed=42, dropout.shape=-1, dropout.mid=dropout)
    }

    counts     <- as.data.frame(t(counts(sim)))
    truecounts <- as.data.frame(t(assays(sim)$TrueCounts))

    dropout    <- assays(sim)$Dropout
    mode(dropout) <- 'integer'

    cellinfo   <- as.data.frame(colData(sim))
    geneinfo   <- as.data.frame(rowData(sim))

    list(counts=counts,
         cellinfo=cellinfo,
         geneinfo=geneinfo,
         truecounts=truecounts)
}
sim <- simulate(nGroups=6, dropout=1) ## 因为这个地方的dropout从1变成了3,导致两者不一致

counts <- sim$counts
geneinfo <- sim$geneinfo
cellinfo <- sim$cellinfo
truecounts <- sim$truecounts

X <- t(counts) ## counts with dropout
Y <- as.integer(substring(cellinfo$Group,6))
Y <- Y-1

#X.normalized <- apply(X, 2, function(z) z/sum(z))
X_t=t(X)
me=median(apply(X_t,1,sum))
sf=me/apply(X_t,1,sum)
X.normalized=diag(sf)%*%X_t

X.normalized <- log(X.normalized + 1)
tsne.X <- Rtsne(X.normalized, max_iter = 1000)

tsne_plot.X <- data.frame(`x-tsne` = tsne.X$Y[,1], `y-tsne` = tsne.X$Y[,2],
                        truelabel = Y, check.names = F)
tsne_plot.X$truelabel <- factor(tsne_plot.X$truelabel, levels = c(0:max(Y)))

ggplot(tsne_plot.X) + geom_point(aes(x=`x-tsne`, y=`y-tsne`, color=truelabel), size=0.5) +
          labs(color='true label') +
          ggtitle("Simulated data") +
          theme_bw() +
          theme(panel.grid.major = element_blank(), panel.grid.minor = element_blank(),
                legend.key = element_rect(fill = 'white', colour = 'white'), legend.position="none",
                axis.title.y=element_blank(), axis.title.x=element_blank())

# sim <- simulate()

# counts <- sim$counts
# geneinfo <- sim$geneinfo
# cellinfo <- sim$cellinfo
# truecounts <- sim$truecounts
## 我也可以在R中显示的
结果如下
最后
以上就是犹豫香水最近收集整理的关于Rtsne的问题总结visulize in python的全部内容,更多相关Rtsne的问题总结visulize内容请搜索靠谱客的其他文章。
本图文内容来源于网友提供,作为学习参考使用,或来自网络收集整理,版权属于原作者所有。


发表评论 取消回复